Square
Following
Hot
News
Profile
Share your thoughts
placeholder
Article
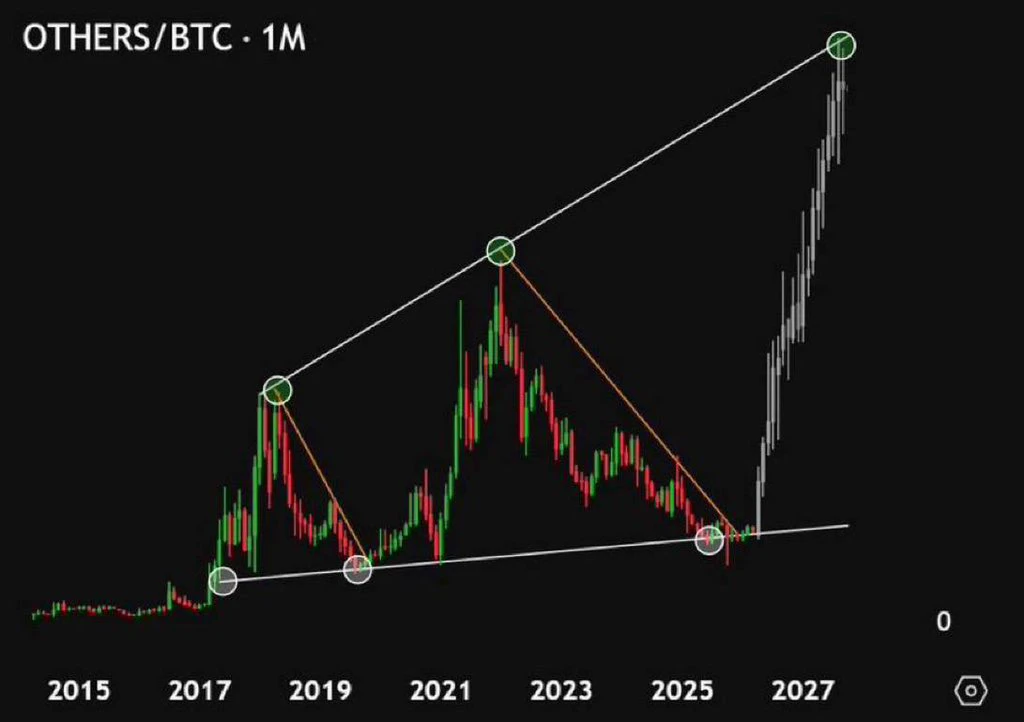
Biggest #Altseason starts any day now.
GET READY 🚀
post-image
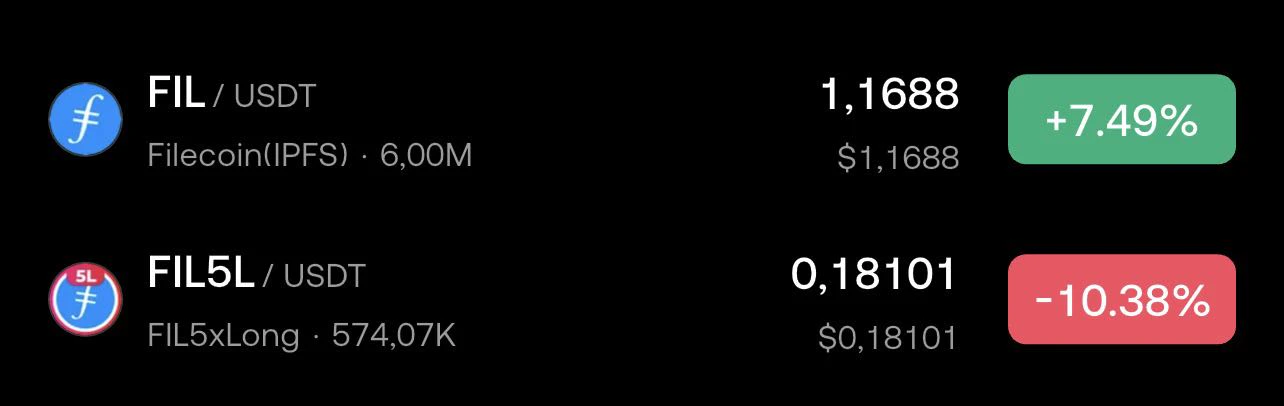
$FIL the big move by gateio has begun, where everyone who believed in and invested in these ETF tokens literally gets screwed 🤡🤯
post-image
FIL+8.61%
Open a large long position on $WAL
! 🚀Entry range: 0.04995 - 0.05107Take-profit 1: 0.05335Take-profit 2: 0.05562Stop-loss: 0.04795The price is currently testing the 24-hour low of 0.05021, showing signs of stabilization on the 15-minute chart and potentially forming a double bottom. RSI(6) is 44.73, and with the funding rate negative, a short-term trade reverting upward toward the MA25 resistance at 0.05211 is currently the highest-probability strategy. Click here to trade 👇👇👇Other tokens: $SKHYNIX : Current price 981.58 - 24-hour change: -4.95%$AGT : Current price 0.032281 - 24-hour chan
post-image
AGT+113.65%
The answer is always hidden in the process that time brings. I’ve already made it extremely clear—the hints have been laid out plainly. Since June, it has felt exactly like hitting whatever I aim at and winning every battle; there’s only one word for it: “awesome”!
$BTC #美国9月CPI超预期
BTC+0.47%
#Bitcoin Golden Cross loading.
You know what this means...
post-image
BTC+0.46%
solana:7b6dX3nE25xrfNViEKZHL9wVJFcBxQYuWPpmzHUxx28H 🥀 Zero or Hero there is no in between
7b6dX3nE25xrfNViEKZHL9wVJFcBxQYuWPpmzHUxx28H
#Crypto #memecoin $sol
post-image
SOL+1.16%
Trade is actually an old script. In the 1980s, Japan’s economy was at its peak, with GDP reaching nearly 70% of the United States’, while its semiconductor industry was putting immense pressure on the US. Japan also wanted to improve relations with China and bring China in to counterbalance the US. What happened? The US launched a combination of measures: the 1985 Plaza Accord forced the yen to appreciate; the 1986 US-Japan Semiconductor Agreement forced Japan to open its market and restricted its exports; and the constraints of the US-Japan security alliance kept Japan firmly in line. From th
post-image
AAPL-0.31%
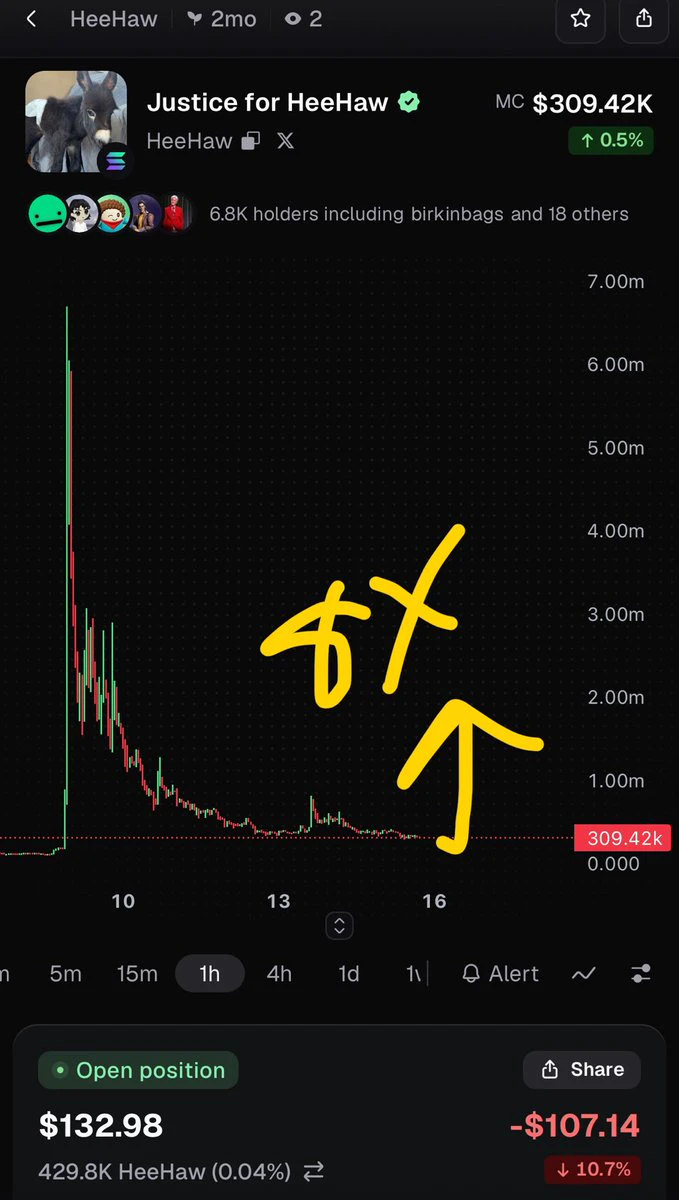
$TOLLY let’s go 5X
post-image
TOLLY-2.28%
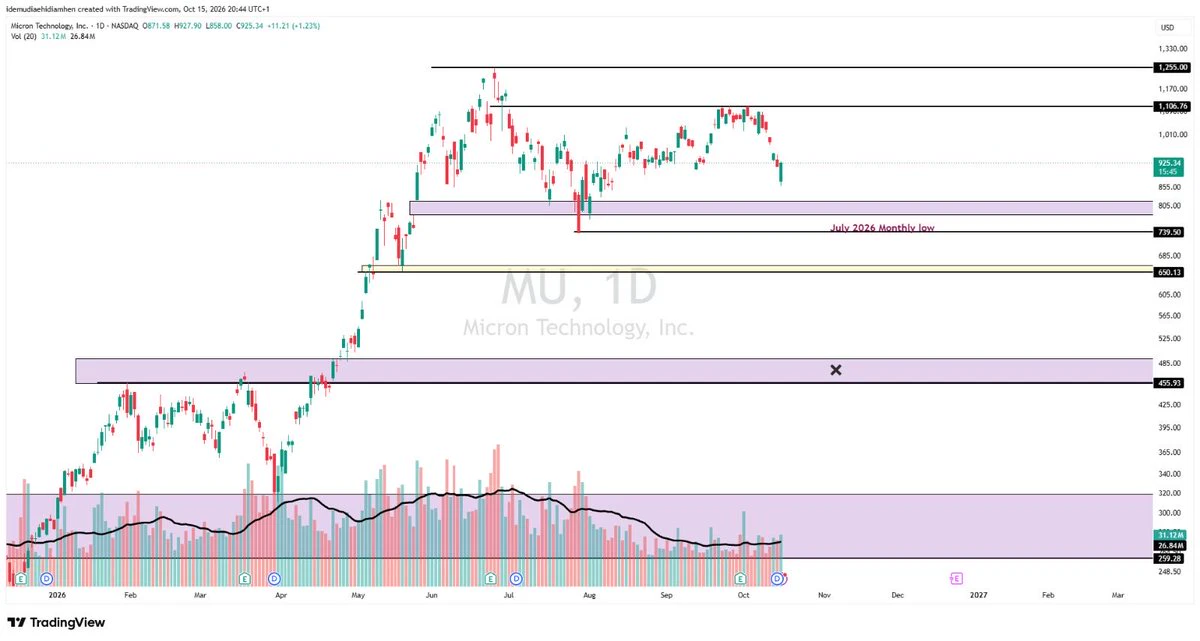
$MU
Refined my Micron zones.
Fundamentally, we know this stock is cheap.
Currently trading at 8.85x EV/EBITDA, and its NTM EV/EVITDA at a shocking 3.91x; then, looking at the EV/REVENUE, it is currently trading at 7.24x, and its NTM EV/REVENUE is 3.52x.
But looking at the chart, we love a good entry despite the FA shouting buy. I am looking at two key levels
1. The demand zone of $782.03-$817.22
and
2. The July 2026 monthly low of $739.5
#NFA
post-image
MU+1.93%
$ZEC short fighting a fresh bullish reversal.
Pair: $ZEC /USDT
Direction: SHORT
Entry: 1135.67
TP1: 1090.48 +4.0%
TP2: 1060.36 +6.6%
SL: 1195.92
- Steady decline from ~1280 through all three MAs, into a sharp final push down, now a strong green reversal candle
- RSI snapped from ~20s to ~55-58 one of the sharpest recoveries of the week
- MACD still negative overall, but the last bar just flipped green fresh cross, same timing as CRCL/ZEC-last-week
$ZEC ‌
ZEC+8.92%
Bitcoin Support and Resistance Levels
live-cover
LIVE57
Everyone watching SYMBOL long is about to get blindsided by a sharp drop.

$MU /USDT - SHORT

Trade Plan:
Entry: 927.98 – 934.84
SL: 964.38
TP1: 906.68
TP2: 890.19
TP3: 865.47

Why this setup?


Debate:
Are we testing TP2 or is 994.50 about to flip this setup?

⚠️ Personal market analysis only. NFA — manage risk and DYOR.
Educational content, not investment advice or a recommendation to buy, sell, deposit, or withdraw any asset. No paid promotion or referral/affiliate links.
MU+2.12%
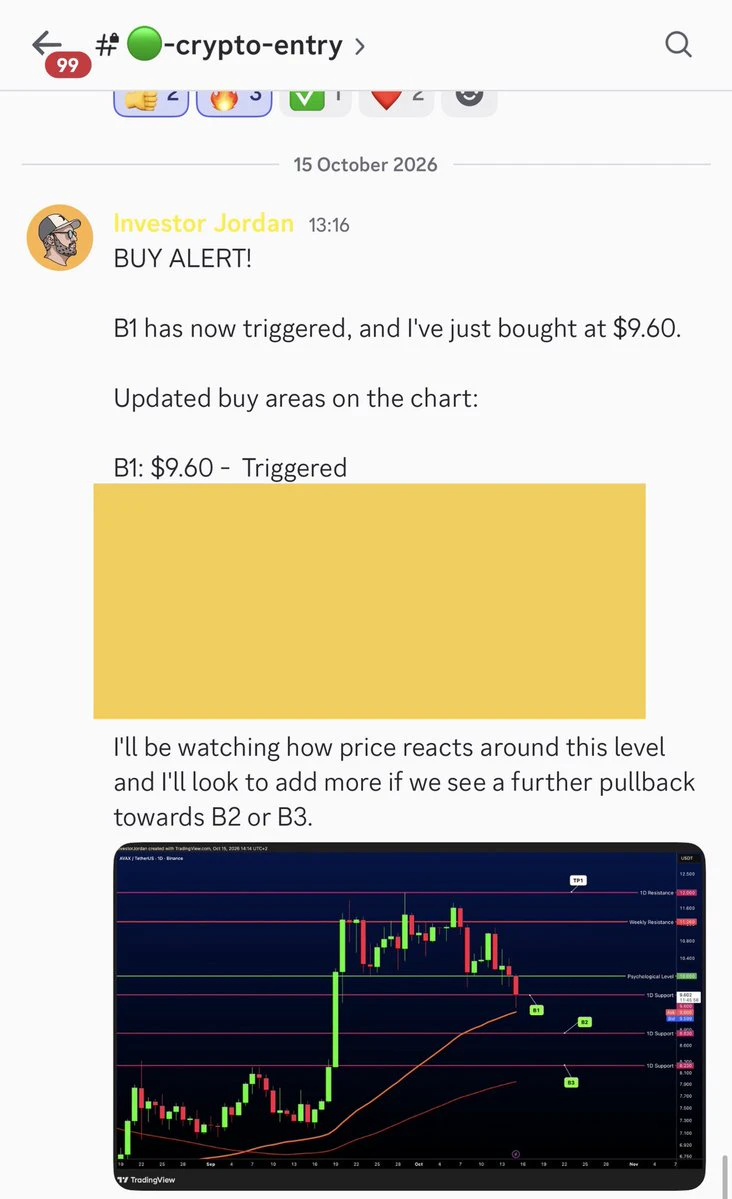
$AVAX 🔺
B1 filled for the subs at $9.60 🎯
$10.07 already
we keep winning 🔔🚀
post-image
AVAX+0.29%
CPI Comes in Hotter Than Expected
live-cover
LIVE30
Many people reflexively buy the dip as soon as they see a 15% drop in 24 hours, while ignoring broader market sentiment and sector correlation—this is the most typical trading misconception. The Fear and Greed Index is 53, neutral but leaning cautious. There has been neither panic selling nor greedy capital stepping in, so looking at a coin’s decline in isolation is meaningless at this point.
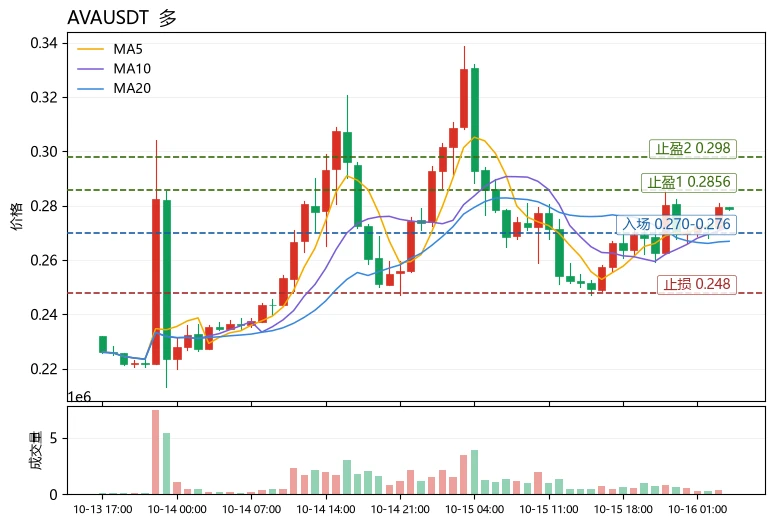
$AV Down 15.18% today, with a trading volume of only 6.2M USDT, a typical low-volume sharp drop. However, the technicals have not deteriorated: MA5=0.27448 remains above MA20=0.26686, so the medium-term
post-image
XPL+7.13%
Pepe have magikal skillz of riding things down to $0 & then back up again with gainz 🚀🌙
solana:EEpng77ZPn9FT4xsRjwuxNCcMBYq3HTwEscyTpump MFs get in 🚀🚀 we riding this to the moon 🌖
EEpng77ZPn9FT4xsRjwuxNCcMBYq3HTwEscyTpump
#crypto
post-image
PEPE+1.94%
SOL+1.16%
🚀 GT/USDT Technical Insights: Is GateToken Preparing for a Bullish Reversal at $10.00 Support?
Pair: GT/USDT (Spot)
Current Price: ~$10.42
24h Range: $10.00 – $10.45
24h Volume: ~67.70K GT (~$691.81K turnover)
📊 1. Key Technical Breakdown Across Timeframes
1-Hour Chart (Short-Term Recovery):
GT tested strong psychological support around $10.00 before staging a clean V-shaped rebound back above $10.40.
Short-term EMAs (EMA5 at 10.38 and EMA10 at 10.33) are sloping upward, crossing above the short-term Moving Averages, signaling early bullish momentum in micro-timeframes.
MACD has fli
GT+0.28%
  • 4
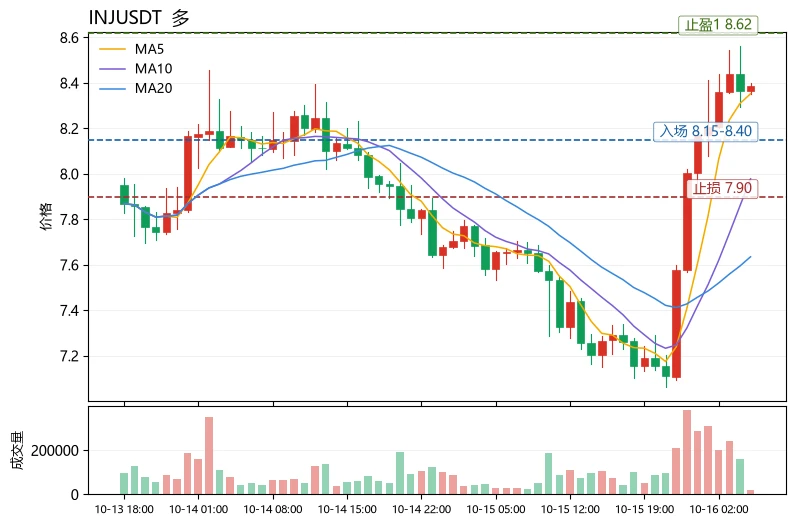
$INJ ‌ has flipped the momentum, and buyers are back in control.
After dipping to $7.061, INJ has rallied to $8.56, reclaiming key levels with a strong hourly breakout. The Supertrend has turned bullish at $7.81, adding strength to the setup.
Key levels:
Support: $8.25–$8.30
Stronger support: $7.80–$7.95
Resistance: $8.56–$8.63
Targets: $8.80 → $9.00
A clean break above $8.56 could extend the move, while holding above $8.25 would keep the recovery structure healthy. After this sharp rally, a retest would be constructive.
INJ is looking stronger. Now it needs to turn this breakout into sustai
INJ+10.95%
NVDA-1.92%
  • 2
Who is truly leading the gains in the same sector? The answer points to $INJ
.
A horizontal comparison makes it clear: $INJ rose 10.92% over 24h, with a trading volume of 24.0M USDT, while $JTO fell 3.94% and $DOGE barely moved (-0.28%) over the same period. All three have an MA5 crossing above MA20, but only $INJ ’s RSI surged to 71.2, with the MACD histogram expanding significantly to +0.136. Its price of 8.379 is already approaching the Bollinger upper band at 8.618, and its 30-candle amplitude of 17.89% shows far greater volatility elasticity than the other two. The funding rate of +0.0
post-image
INJ+10.96%
JTO-3.42%
DOGE-0.46%
$ZEC The altcoin king is a money printer—stay steady, hold spot through the bull market. It feels incredible
ZEC+9.10%
Load More

Join 40 M users in our growing community

⚡️ Join 40 M users in the crypto craze discussion

💬 Engage with your favorite top creators

👍 See what interests you

Trending Topics

USSeptemberPPIBeatsExpectations

91.35k Views1.88k Discussing

US September PPI came in at 6.3% YoY, well above the 5.3% market expectation, pointing to renewed producer-side inflation pressure. Weekly jobless claims were 199K, broadly in line with forecasts. Could hotter inflation further reduce room for rate cuts, and what does it mean for $BTC, US stocks, and gold?

DrLinHanSpeaksAtOxfordUnion

135.63k Views1.86k Discussing

JapanAndKoreaStocksPlunge

47.27k Views1.76k Discussing

View More