Square
Following
Hot
News
Notifications
Profile
Share your thoughts
placeholder
Article
new stimers
live-cover
LIVE1,789
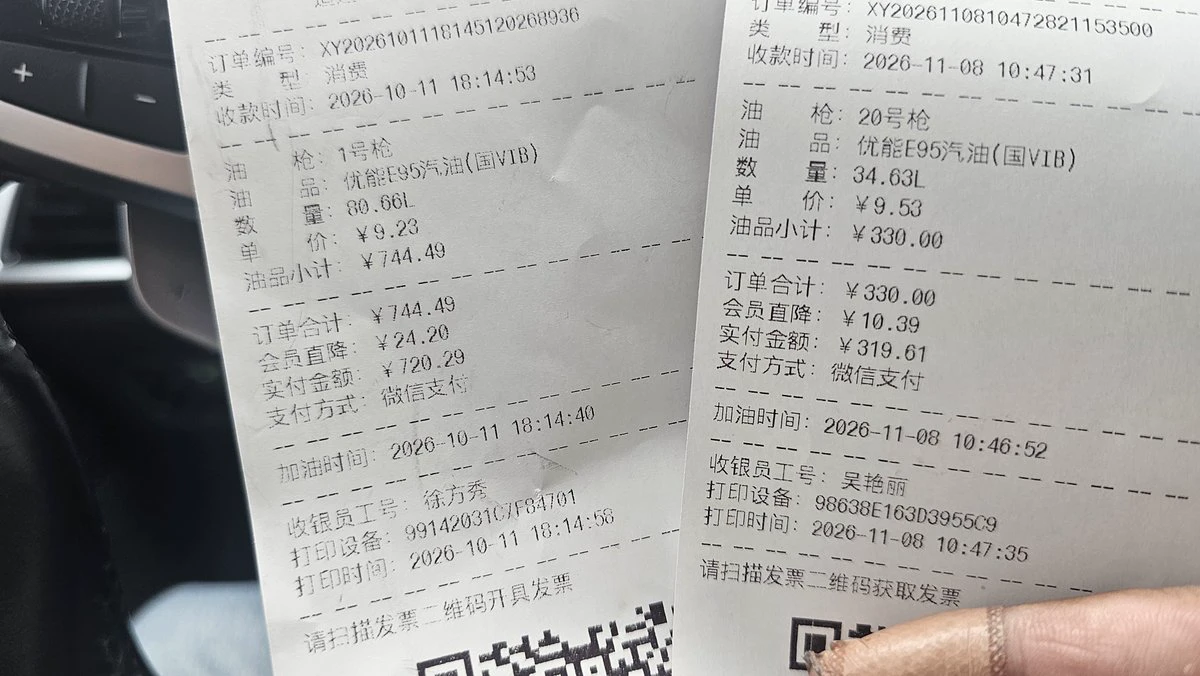
A month ago, international oil prices were the same, but domestic consumer prices were different.
Just looking at the impact on ordinary consumers, I’d also vote against Trump.
post-image
Trenches
ZIG
Z
bade
b
ZIG
0x8c...1145
Market Cap
$.
Change
.
24h Vol
$.
Holders
.
STONK
S
bade
b
STONK
6GmA...UNgx
Market Cap
$.
Change
.
24h Vol
$.
Holders
.
IDOL
I
bade
b
IDOL
0x3b...ab07
Market Cap
$.
Change
.
24h Vol
$.
Holders
.
BTC
B
bade
b
BTC
C5xp...pump
Market Cap
$.
Change
.
24h Vol
$.
Holders
.
FLOAT
F
bade
b
FLOAT
Bv1a...BMmr
Market Cap
$.
Change
.
24h Vol
$.
Holders
.
Featured11.8 Weekend Morning Market Overview: Sideways Trading Over the Weekend—Get Some Rest

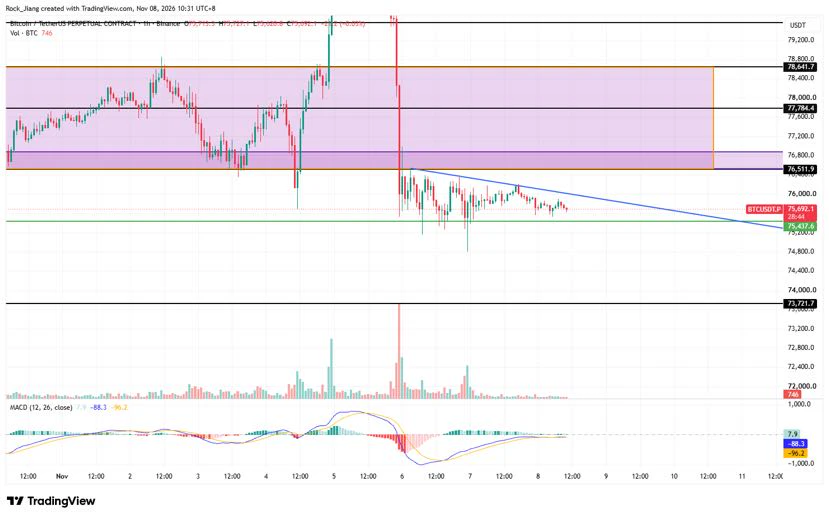
BTC formed a doji this morning and is trading sideways near the lows

BTC is in a descending converging triangle pattern. As time passes, 7.54 and the descending trendline are converging, showing signs of a rebound

BTC has retested 7.54 several times, and the candlestick bodies have not broken below it, so support is holding for now

Resistance is above 7.65. Support and resistance have switched roles. A bullish rebound is only likely if the price breaks above 7.65 and holds; otherwise, expect c
post-image
BTC-0.65%
  • 5
BTC, go long around the current price of 75,700, stop-loss at 74,800, target around 78,000. $BTC
post-image
BTC-0.67%
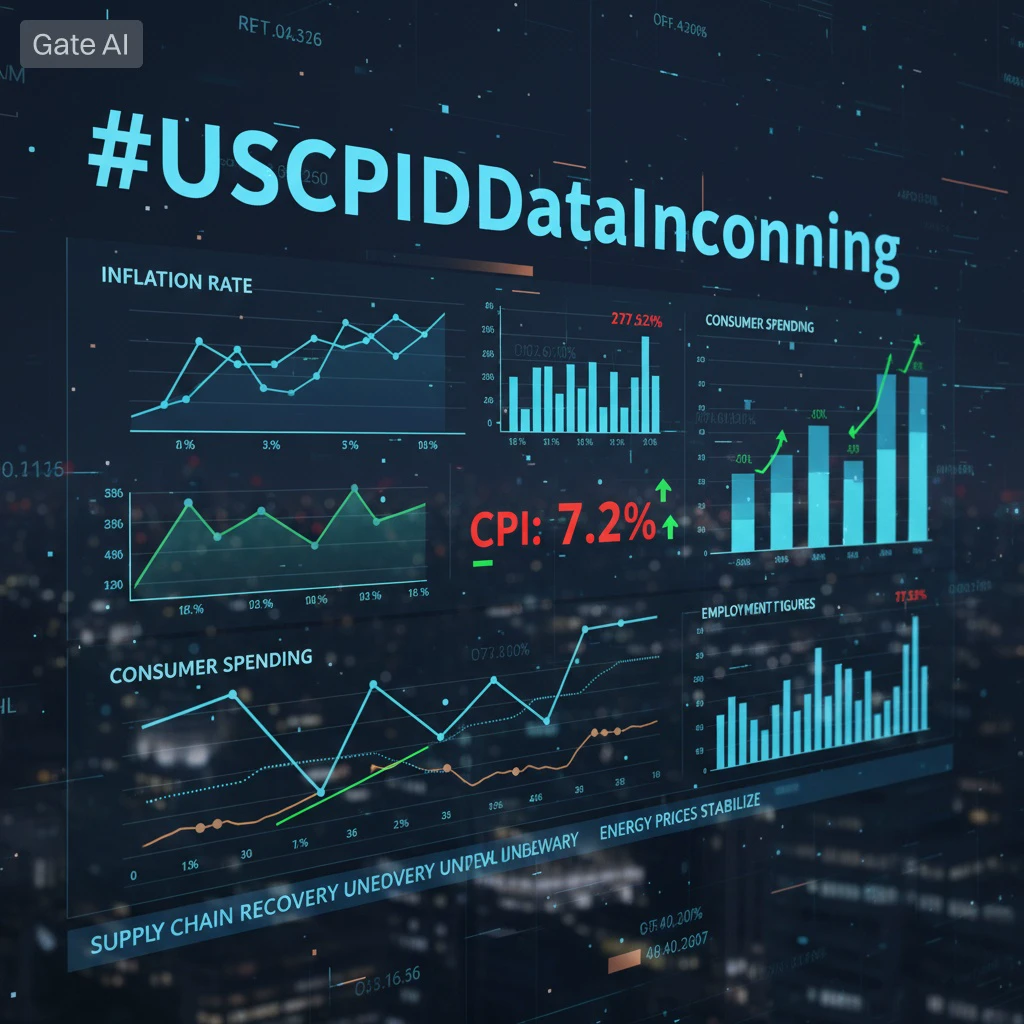
#USCPIDataIncoming #每周来晒
Unpacking the October CPI Scenarios and Monetary Crossroads

The global financial system is bracing for a high-stakes macroeconomic checkpoint as the U.S. Bureau of Labor Statistics (BLS) prepares to release its October Consumer Price Index (CPI) report on Tuesday, November 10, 2026, at 8:30 AM ET (6:30 PM Pakistan Time). Following the exceptionally robust October Nonfarm Payrolls report (+165,000 jobs, 4.1% unemployment), this inflation print serves as the ultimate decider for the Federal Reserve's final monetary policy track of the year.
Traditional equities, digita
post-image
GAS-0.57%
SPX500+0.19%
XAU+0.38%
BTC-0.67%
  • 3
  • 1
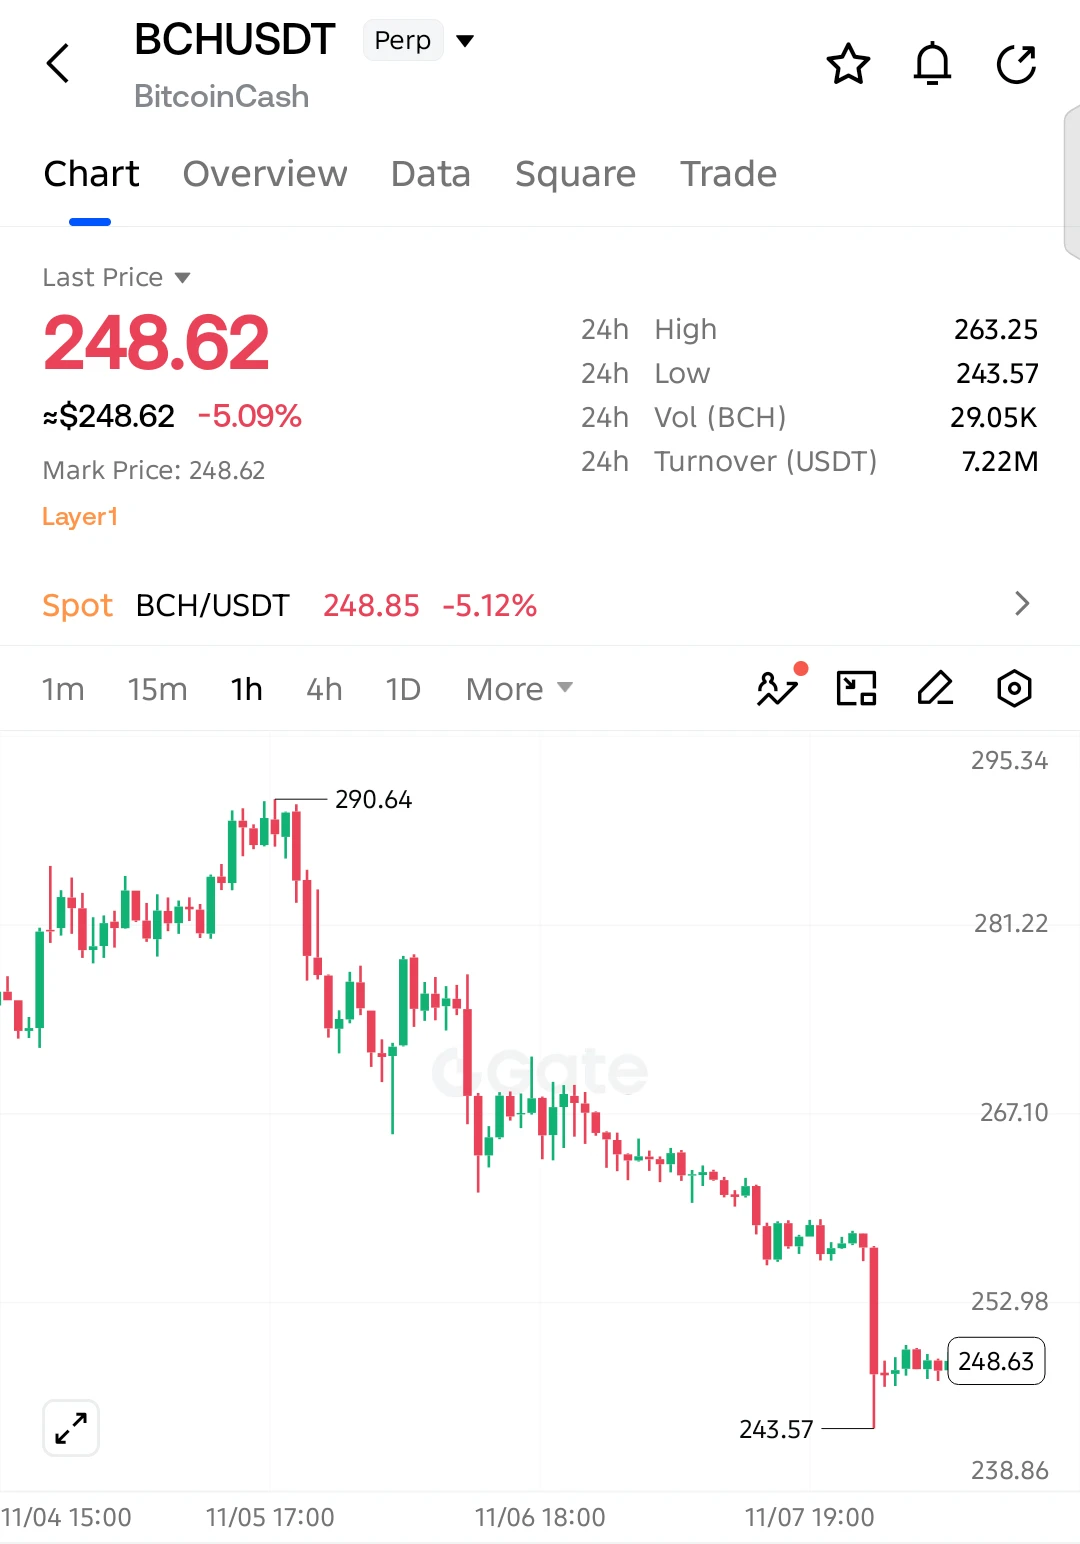
$BCH SHORT SETUP — SELLERS TARGET ANOTHER BREAKDOWN!

$BCH is down 5.09%, with selling pressure continuing after a sharp decline from 290.64. The bearish trend remains intact!

Entry: 248.62
SL: 253.40

TP1: 243.57
TP2: 240.00
TP3: 238.86
Final Target: 235.00

Sellers remain in control as $BCH struggles to recover above 253.00. The latest consolidation near the lows shows weak buying momentum, and a breakdown below 243.57 could trigger another decline toward 240.00 and potentially 235.00.

Invalidation: A sustained recovery above 253.40 weakens the bearish setup.
post-image
BCH+1.05%
  • 1
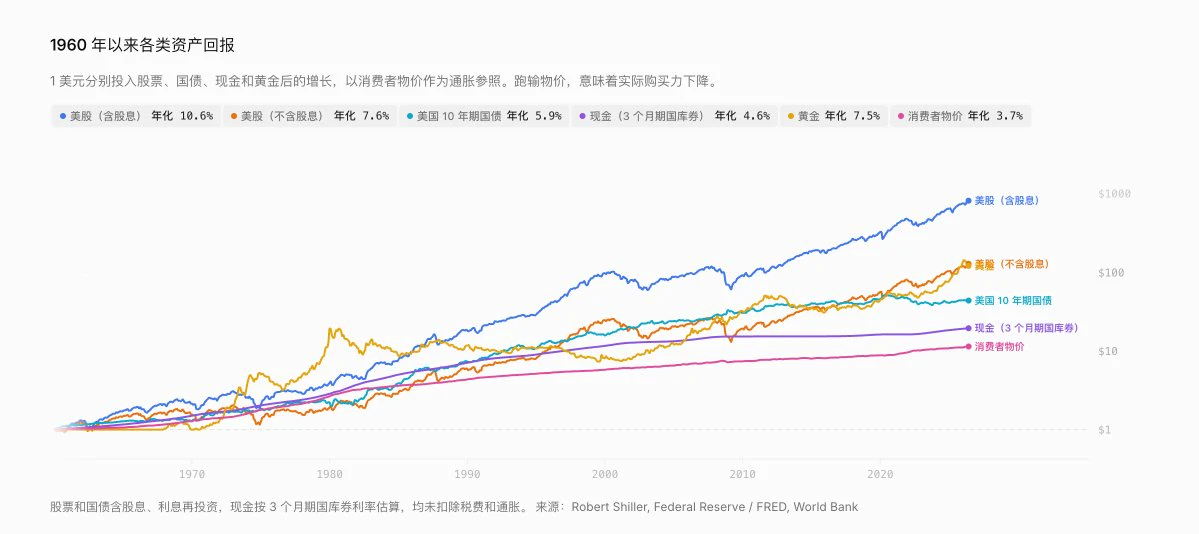
If your dad had been dollar-cost averaging into U.S. stocks since birth, he’d be A9 by now
post-image
$APR The panic reading has surged to 82, and funding rates have been negative for a third straight day—I've seen this script too many times.
Down 12% in 24 hours, from 0.0444 all the way to 0.0382. The 10.2M in trading volume shows this isn't a slow bleed caused by a liquidity drought; people are genuinely panic-selling their holdings. What does a Fear and Greed Index reading of 82 mean? The last time it reached this extreme was during the sharp drop in March this year. Funding rates turned negative then too, and the price rebounded 18% 72 hours later. History doesn't repeat, but it rhymes.
Le
APR-10.63%
📄 Decree 5,460: Less paperwork to export, more foreign currency flowing into P2P?
The Executive Branch repealed 37 administrative acts—permits, tariff codes, and guidelines—that had been hindering exports of fish, coffee, and cocoa. The regulation, published in Official Gazette 43,268 on November 5, 2026, has 36 articles and two final provisions and will remain in effect through December 31, 2026. It also ordered that no requirements, registrations, or authorizations not published in the Official Gazette may be required.
🔹 The hard numbers
• 37 administrative acts repealed (permits, tariff c
post-image
$MET Trend watch: After rising from the bottom area, trading volume has increased significantly as the price rebounded. It has moved back above the 7-day and 25-day moving averages, and short-term sentiment is warming. The market shows active capital inflows driving the move, with strong bullish momentum. There is still room for further upside, so the strategy is to add to long positions in line with the trend⬇️⬇️⬇️

MET +18.68%
Risk warning: The above is only my personal market view and does not constitute investment advice. Contract trading is highly volatile, so please manage your position
post-image
MET-0.16%
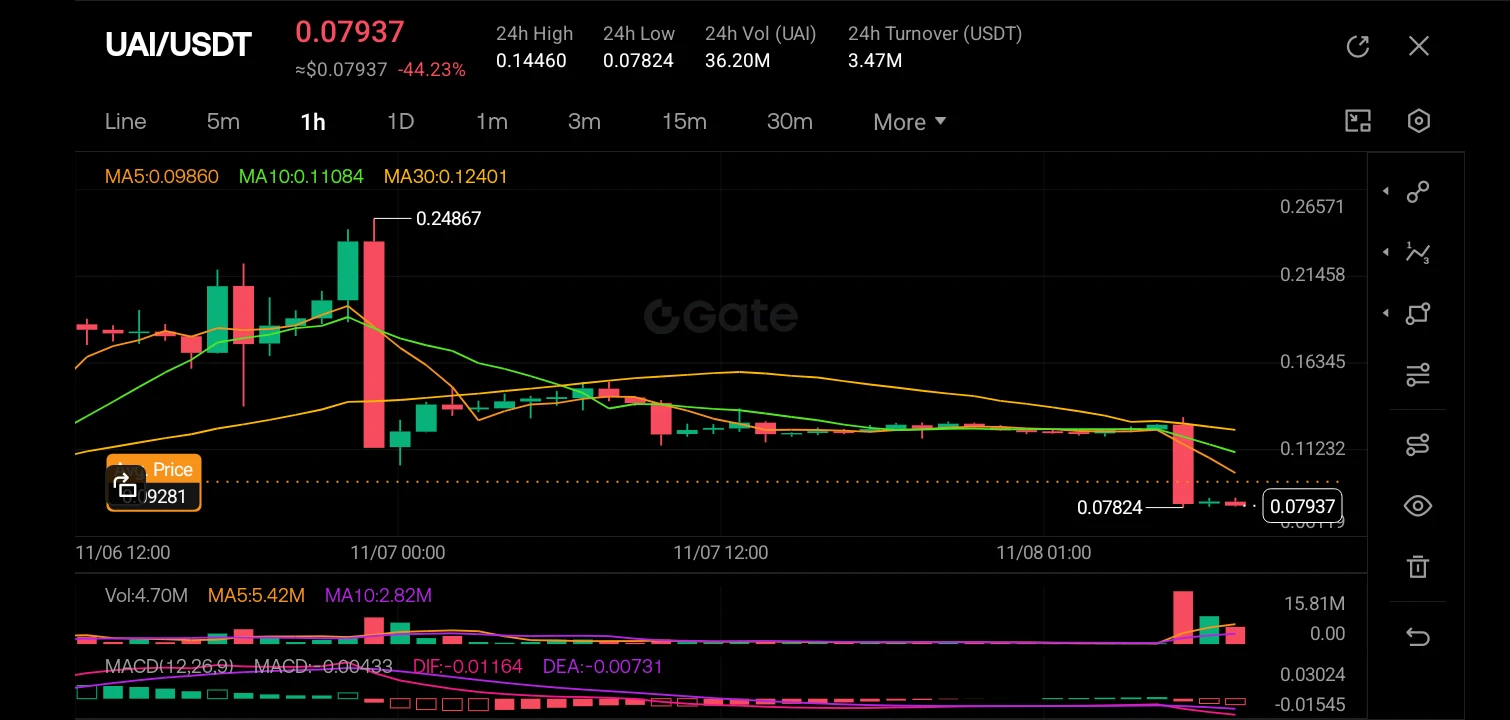
$UAI ‌
The 1-hour chart for UAI/USDT is showing a severe bearish breakdown, with the price currently sitting at 0.07937, representing a massive 44.23% drop over the 24-hour period. The chart clearly displays a steep waterfall decline from the recent high of 0.24867, completely obliterating the short and medium-term moving averages (MA5, MA10, MA30), which are now fanning out downwards in a classic bearish alignment. The most recent candle is a massive, long-bodied red marubozu that has crashed through any nearby support levels, accompanied by a significant volume spike (15.81M), indicating in
post-image
UAI-7.58%
  • 3
⚡ 𝗦𝗢𝗟𝗔𝗡𝗔 | 𝗘𝗖𝗢𝗦𝗬𝗦𝗧𝗘𝗠 𝗦𝗧𝗔𝗬𝗦 𝗔𝗖𝗧𝗜𝗩𝗘
$SOL remains among today's trending cryptocurrencies. Network activity and ecosystem developments continue to keep Solana on traders' watchlists.
#ShareWeekly #USCPIDataIncoming
post-image
SOL-0.74%
$LYN Go long!! The market just showed unusual activity. The pullback is over, and the price is starting to rise. This coin still has a major rally ahead! Go long! ⬇️
post-image
LYN-0.44%
BTC | ETH | Gold | Crude Oil
live-cover
LIVE2,796
Good Morning!
What's your plan for today? 💚
post-image
Sometimes when the market is as slow as it is, the best move can be to do nothing.
Lessons in patience.
I believe the end of this year will be good for $BTC and $ETH .
post-image
BTC-0.67%
ETH-1.26%
#USAIStocksHitHard

US AI Stocks Hit Hard: What Triggered the Sell-Off and What Investors Should Understand

The Myth: A Strong AI Industry Means AI Stocks Cannot Fall

Many investors believe that companies building artificial intelligence will continue rising as long as AI technology keeps improving. That is a dangerous assumption. A company can have excellent technology, growing demand and strong long-term potential while its stock price still falls sharply.

That is exactly the lesson emerging from the recent sell-off in U.S. AI stocks. The market is not suddenly rejecting artificial intel
post-image
AMD+11.55%
$MET Up 19.44% in 24 hours to 0.3306, with 43.5M in trading volume—retail traders alone couldn't drive this kind of volume. The current price is just 1.5% below the 24-hour high of 0.3356. Go long on a breakout, with a stop-loss at 0.315 (above today's low) and a first take-profit at 0.36. Keep your position at or below 5% of your total capital, and do not exceed 3x leverage. If you're not in a position, wait for a pullback to the 0.318–0.322 range and scale in. If it falls below 0.31, admit you're wrong and exit immediately. The token selection logic is simple: a high 24-hour volume-to-turnov
MET-0.33%
🔥 $ZEC /USDT – Bears Are Losing Control or Is This Just a Trap?

I'm watching $ZEC closely because the 15-minute chart is showing an important battle around the $1,250–$1,265 zone.

After getting rejected from the $1,387 high, ZEC has experienced a clear downside move, forming lower highs and lower lows. However, buyers are now attempting to defend the $1,247 support area. A successful recovery could trigger a short-term bullish reaction, but confirmation is still needed.

🎯 Entry Level: $1,255 – $1,267

🥇 TP1: $1,280

🥈 TP2: $1,300

🥉 TP3: $1,325

🛑 STOP LOSS: $1,242

⚡ Key Level to Wat
ZEC+1.16%
How Much Should You Lose on a Single Trade? Scientifically Managing Risk Is Key to Long-Term, Consistent Profits!

In cryptocurrency futures trading, many people spend every day studying when BTC will rise or fall, yet rarely take the time to calculate one thing: if this trade goes against them, how much can they actually afford to lose?

In fact, in long-term trading, predicting direction is only part of the equation. Risk management is what determines whether an account can survive over time.

First, set your risk per trade in advance. You can use 1% of your account balance as the risk budge
post-image
BTC-0.65%
Load More

Join 40 M users in our growing community

⚡️ Join 40 M users in the crypto craze discussion

💬 Engage with your favorite top creators

👍 See what interests you

Trending Topics

USCPIDataIncoming

1.04k Views1.48k Discussing

The U.S. October CPI report will be released on November 10 at 8:30 a.m. ET. September CPI came in at 3.7% year over year, and markets will be watching closely for signs that inflation is cooling, especially in core CPI. A softer-than-expected reading could strengthen rate-cut expectations, while hotter inflation may pressure risk assets through higher Treasury yields and a stronger dollar. How do you think this CPI print will move $BTC, U.S. stocks and gold?

USAIStocksHitHard

23.56k Views3.69k Discussing

USNonfarmPayrolls

40.34k Views4.38k Discussing

View More