Square
Following
Hot
News
Notifications
Profile
Share your thoughts
placeholder
Article
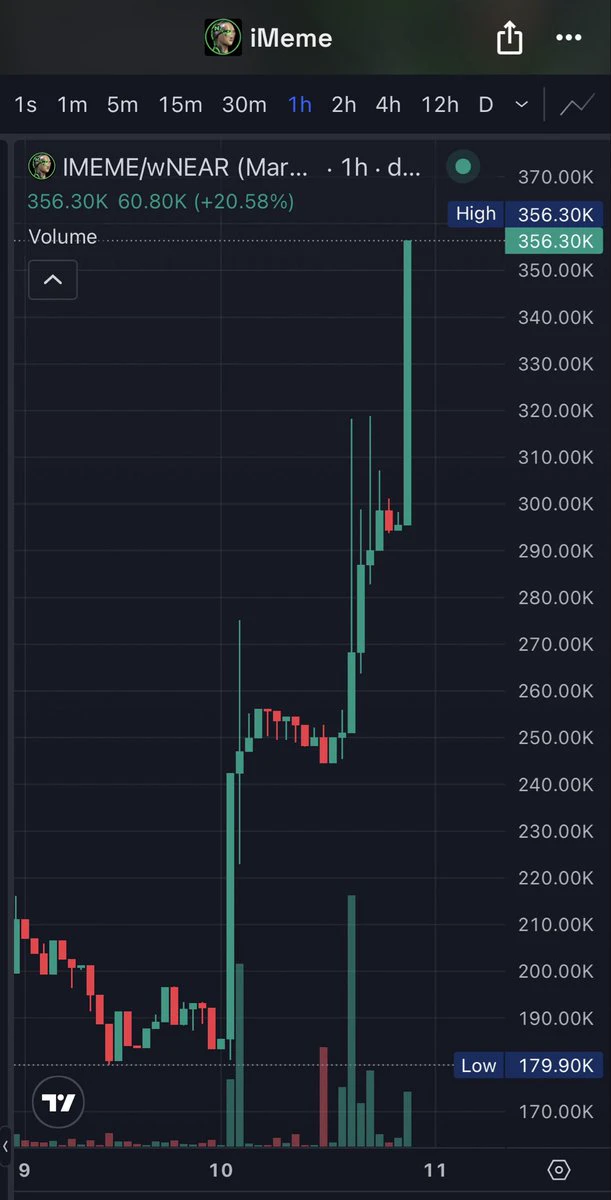
So @ilblackdragon aped more $IMEME then this happened right after 👇
->Wallet truekale619.near added 5,065 wNEAR (~$18.2K) in one-sided concentrated liquidity to the iMEME/wNEAR pool on Rhea.
->MC range: ~$293K–$299K
->DCL points: 44000–44200
->Deposited: 5,065 wNEAR and 0 iMEME
This effectively acts as buy-side liquidity, allowing NEAR to be gradually converted into iMEME as the price moves down through the range.
Something is cooking, I’m buying all dips

@IMEMEonHOOT
post-image
RHEA-10.24%
Short every bounce on $XAG . Trading range: 51.54 - 51.93 Take-profit 1: 49.28 | Take-profit 2: 47.32 Stop-loss: 53.49 Bears firmly control the situation; this weak rebound is just a trap before the next leg down. Note: The 1-hour RSI is oversold, which could trigger a stronger mean-reversion bounce. Don’t go all in, bro. Size your position appropriately for your account.
post-image
XAG+0.47%
Trenches
PIEVERSE
P
bade
b
PIEVERSE
0x0e...25a9
Market Cap
$.
Change
.
24h Vol
$.
Holders
.
X
X
bade
b
X
9VZe...pump
Market Cap
$.
Change
.
24h Vol
$.
Holders
.
牛逼
牛
bade
b
牛逼
0x96...7777
Market Cap
$.
Change
.
24h Vol
$.
Holders
.
DacityCoin
D
bade
b
DacityCoin
DKYc...pump
Market Cap
$.
Change
.
24h Vol
$.
Holders
.
FLOAT
F
bade
b
FLOAT
Bv1a...BMmr
Market Cap
$.
Change
.
24h Vol
$.
Holders
.
The Bull Run Is Coming. 🚀🔥

$BTC $ETH $PI
BTC-0.67%
ETH-1.26%
PI-0.60%
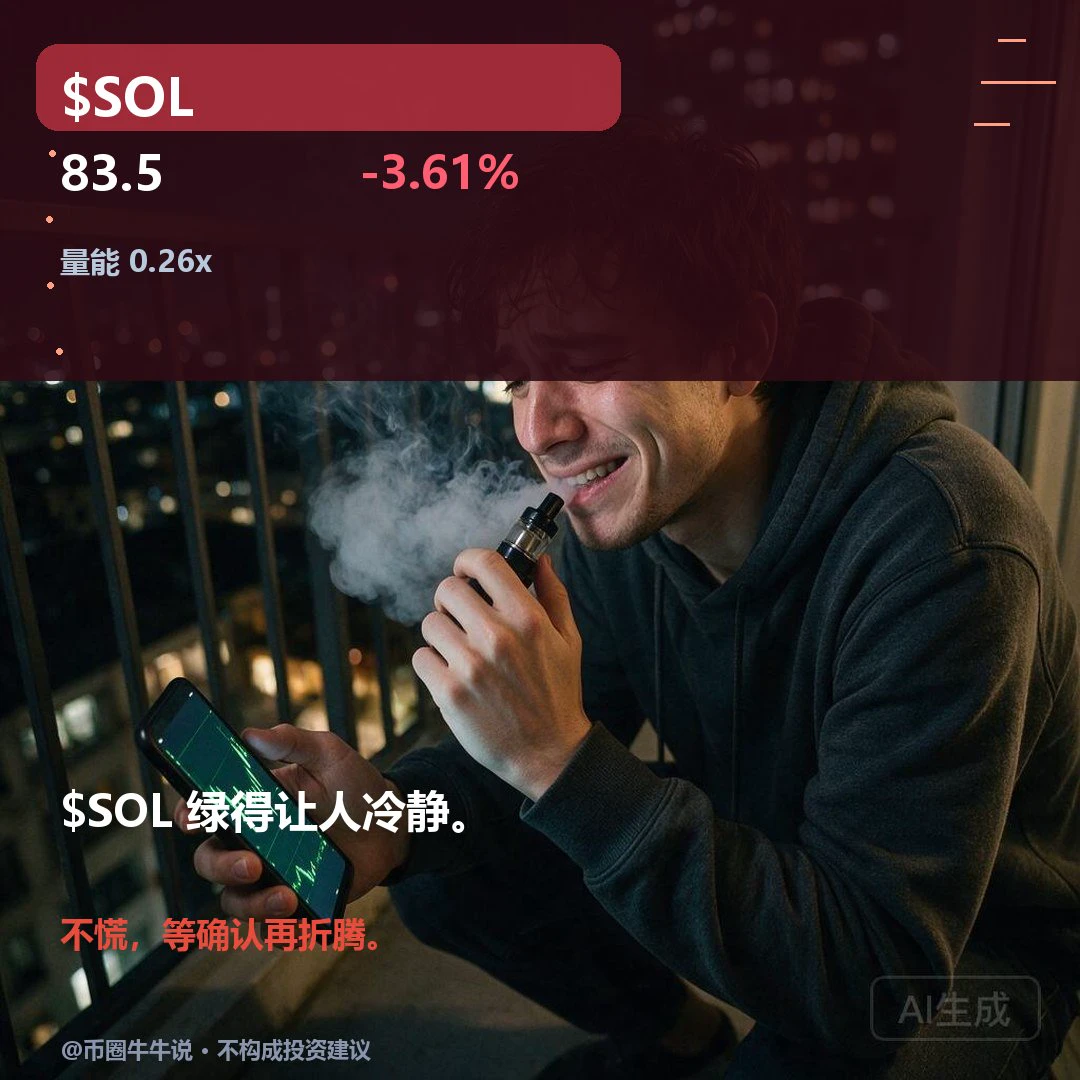
$SOL Currently at 83.5, down 3.61% over 24H. The 1H trend is weak, with EMA20 at 84.2, RSI at 32, and resistance at 87.03; the 4H trend is weak, with EMA20 at 86.5, RSI at 31, resistance at 90.67, and support at 81.34. Volume is only 0.26x the average. If price holds above 87.03, a rebound may be worth watching; a break below 81.34 would signal short-term weakness. In the follow-up review, watch whether 87.03 holds and whether price can recover after losing 81.34; volume at 0.26x the average still needs confirmation. Market volatility is high; for observation only.
post-image
SOL-0.77%
Closed the trade for some quick gains.
Building up the account bit by bit.
Remember all timeframes are the same.
The larger the timeframes take more patience.
20% gains on 100X long.
post-image
BTC market update
live-cover
LIVE553
It simply won't stop.
Stablecoins moved a record $18.62B on Stellar in October, 9.4 times the $1.98B of October 2025.
It was the eighth straight monthly high.
That is more than $600M a day.
@StellarOrg
XLM-0.64%
$INIT I chased in at $0.19 and didn’t sell at $0.29; now I’m sitting at 0.228 taking a beating. The 24h high was 0.303 and the low was 0.159, with the range nearly doubling; trading volume was 1.2 billion—that turnover rate clearly points to a sentiment-driven market, not a trend-driven one. I reviewed the last bull market: in weeks 5–7 after the halving, altcoins collectively saw sharp wick-down shakeouts, just like today’s upper wick on $INIT: a 21% pump to attract chasers, then a pullback to confirm support. There’s just one lesson: on a high-volume wick day like this, I’d rather wait for a
INIT-2.53%
Layout: Bitcoin, Ethereum, Dogecoin
live-cover
LIVE880
  • 1
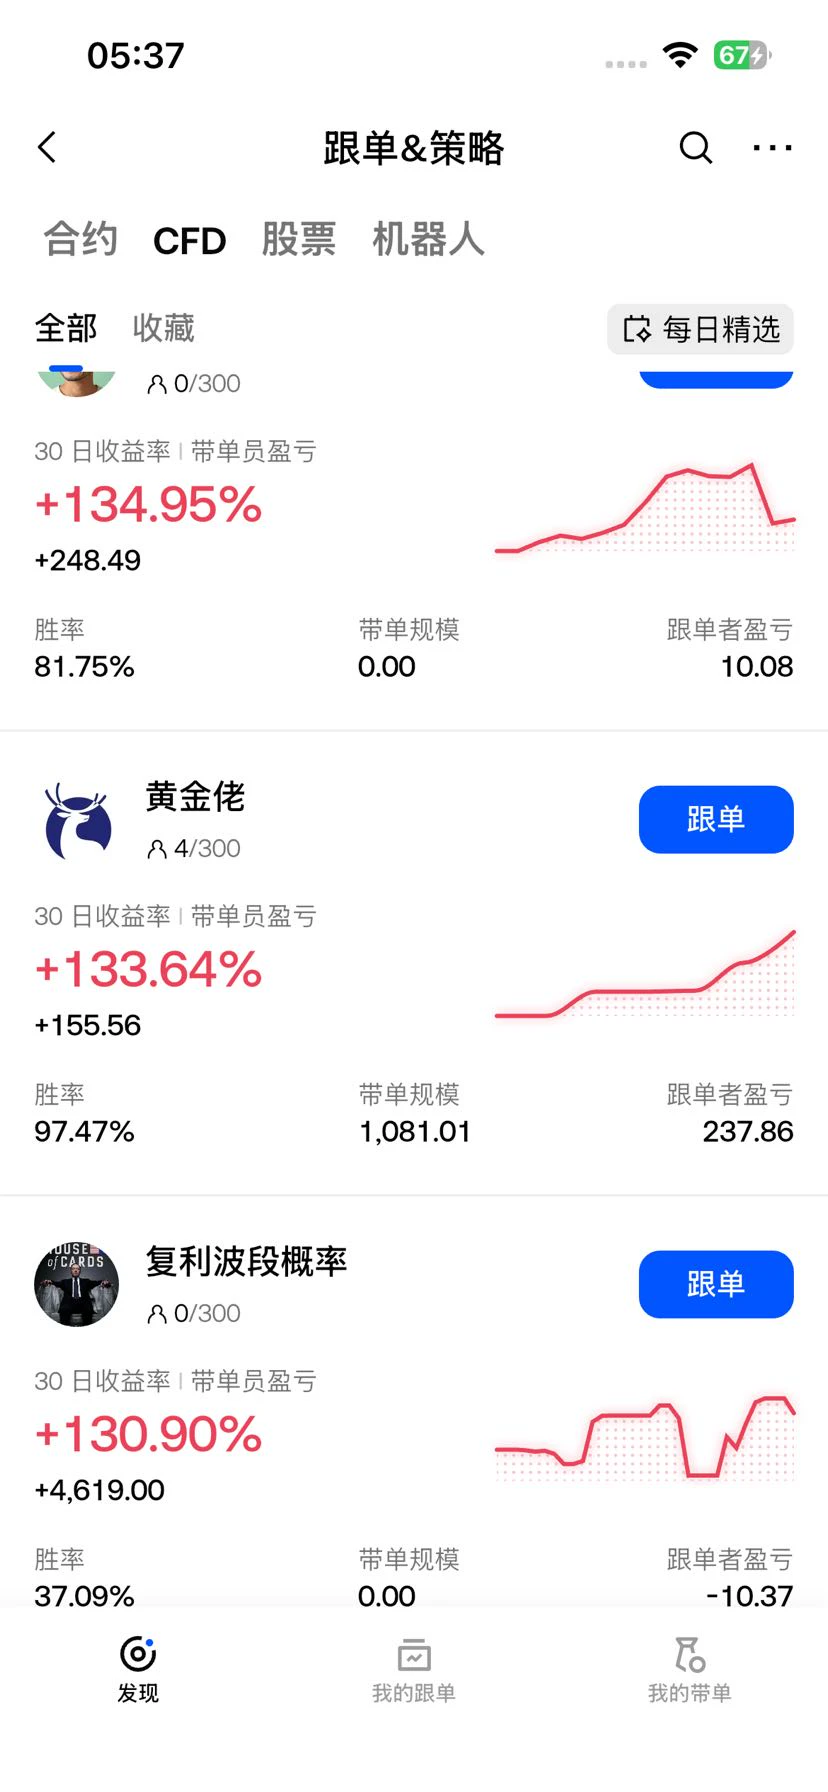
$XAUUSD Day 6 of copy trading. Let's see how many times it multiplies after a month. Copy trading requires caution; I recommend starting with 0.01
post-image
XAUUSD-2.65%
$LTC This rally is essentially just a rebound within a downtrend—don’t be fooled by the green candles on the surface. The bearish market structure hasn’t changed, and the rebound is an opportunity to go short.
My plan: enter short positions in the 50.58–50.83 range, with the first target at 48.24 and the next at 46.27; set the stop at 52.35. Note that if trading volume suddenly surges, the price could be pushed up to test around 51.00, so stay alert.
Remember, don’t go all in. Make sure your position size matches your account’s risk tolerance.
Risk warning: The above is solely my personal mar
post-image
LTC-0.07%
BlackRock's iShares 0-1 Year Treasury Bond ETF, tokenized by Ondo on Solana, is now worth $423,586,289, up 64.39% in the past 30 days.
It held $8,325,830 just 90 days ago, and took in $88,211,369 of net inflows in the past 7 days alone.
@BlackRock @Ondo @solana
BLK+0.42%
ONDO-0.29%
SOL-0.77%
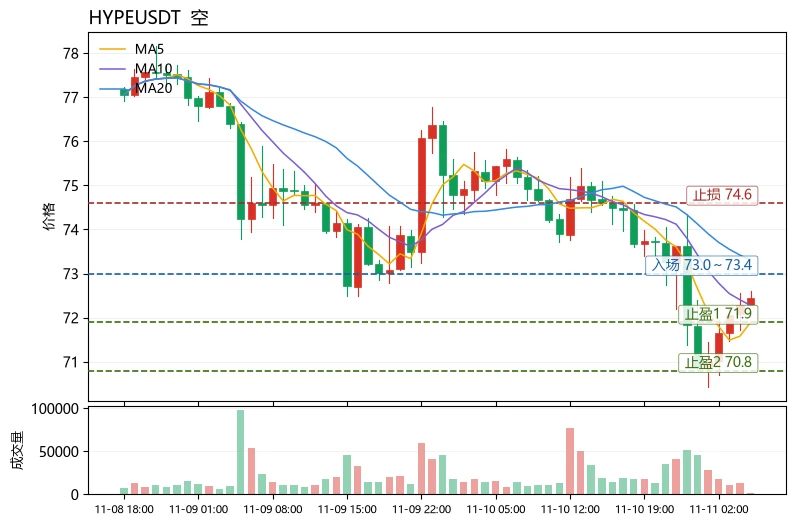
$HYPE Bottom line: The short-term outlook is bearish. A rebound is likely to encounter resistance around the cluster of moving averages, so chasing longs is inadvisable. The current price is 72.53, and MA5=71.894 is slightly below it but remains below MA20=73.309. The moving averages are bearishly aligned, so a rebound will first face resistance from MA20 around 73.3. The MACD histogram=-0.08897 remains negative, indicating that bearish momentum has not faded. RSI=41.9 is in weak territory but not oversold, leaving room for further downside. The Bollinger Bands are [70.7756, 75.8424], and the
post-image
HYPE+0.24%
NEAR+1.17%
FET-1.52%
$DUSK — LONGDUSK is consolidating after sharp volatility. If recent lows hold, buyers may have a chance to challenge the top of the range. Entry: 0.06901 Take-profit 1: 0.07100 Take-profit 2: 0.07350 Stop-loss: 0.06680
post-image
DUSK+5.54%
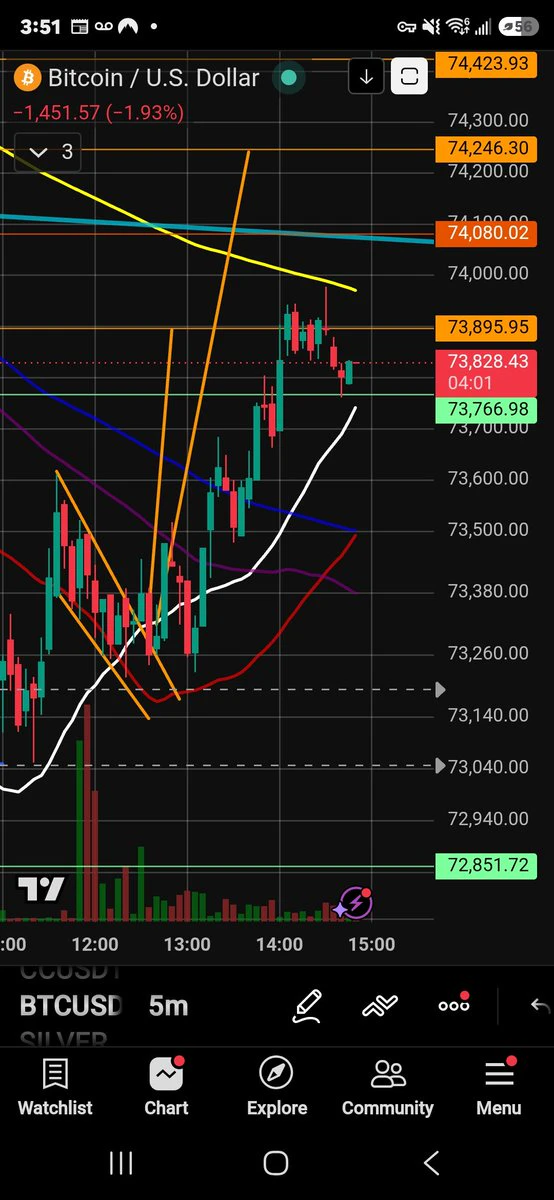
$BTC At Resistance!? 🤔
5 min 200MA rejection!? 👀
Entered the short entry.
At local resistance on the 1hr timeframe.
NFA, DYOR ⚠️
#Crypto #Trading #BTC
post-image
BTC-0.67%
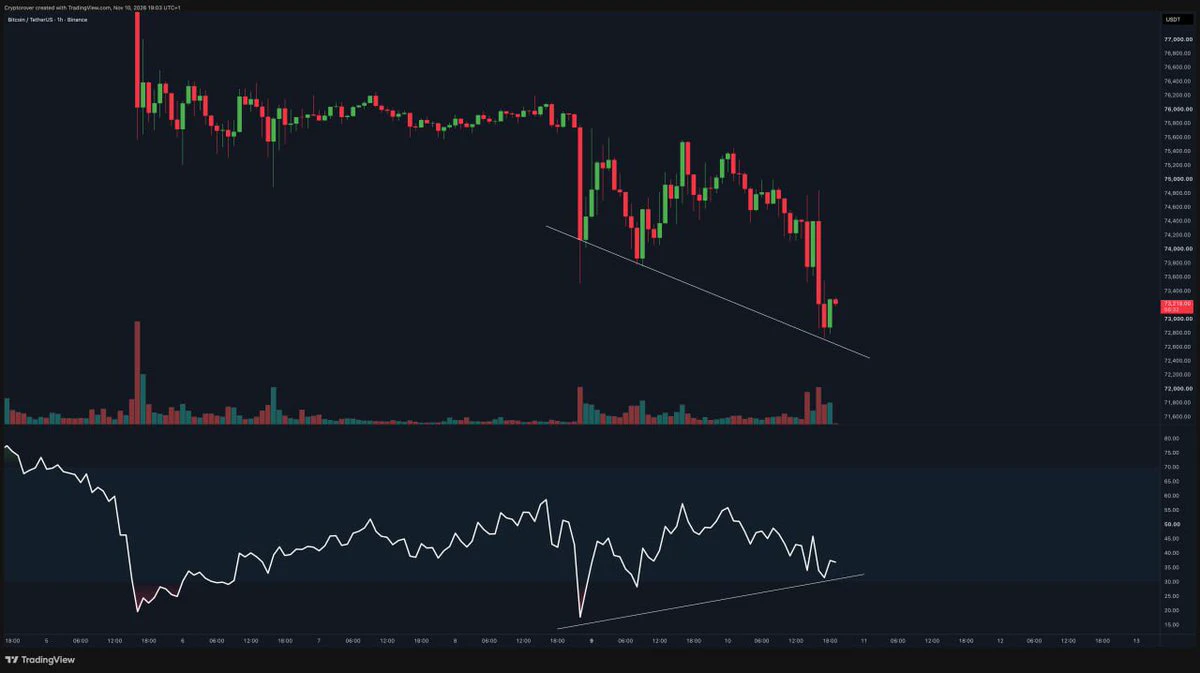
👀🚨 A BULLISH DIVERGENCE IS FORMING ON $BTC !
BITCOIN COULD BE PREPARING FOR A MAJOR REVERSAL! 📈🔥
THE NEXT BIG MOVE MIGHT BE CLOSER THAN WE THINK. 🚀
ARE YOU READY? 💎
post-image
BTC-0.67%
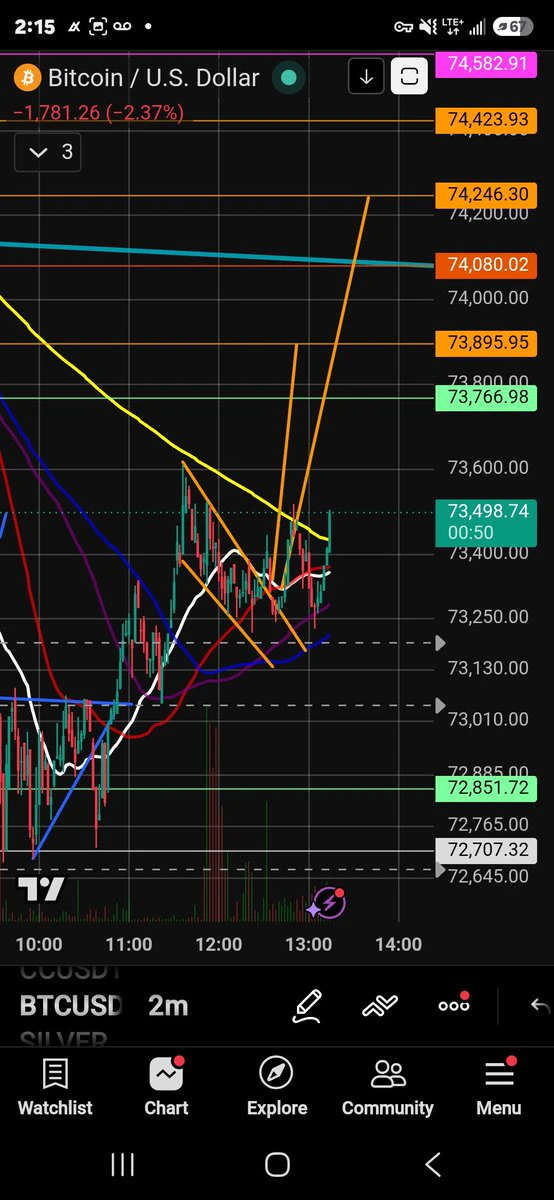
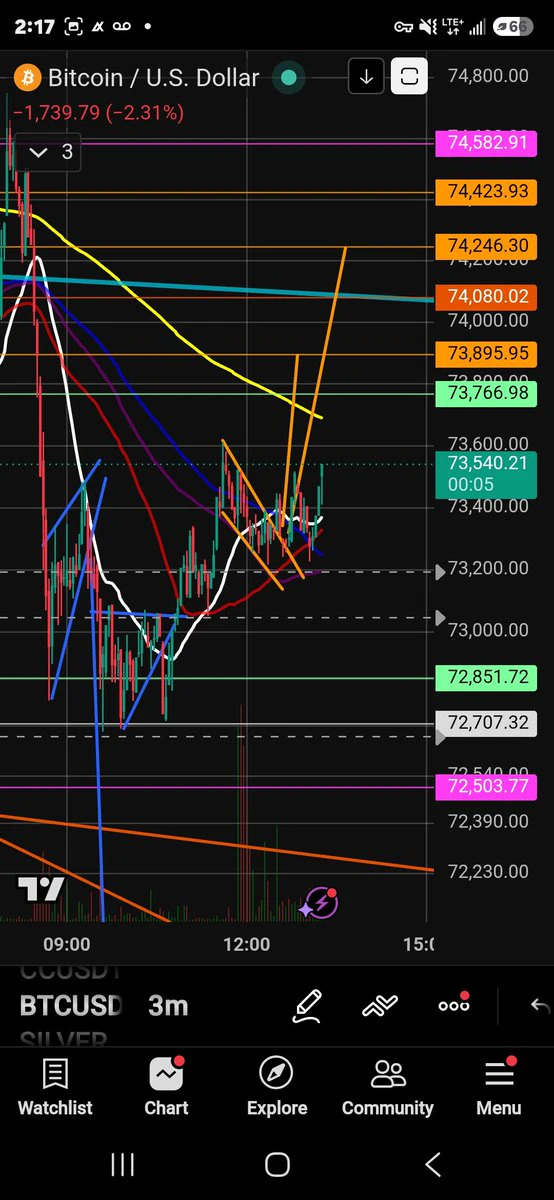
Here we can see the 3min money printer formation in effect.
Price will get pulled up to fill the gap between price action and the yellow 200MA. ✅️
As long as the 2min 200MA is held below price action.
post-image
The Democrats do not want war. Trump can no longer attack Iran; he is compelled to reach an agreement... and he will do so. The decline in oil prices supports this view. For this reason, I see every dip especially in $BTC as an opportunity. While risks can be high during such periods, the potential gains are equally significant. In my opinion, we have already moved past the riskiest phase...

#BTC #Bitcoin #Crypto #USIranTalksShowNewProgress $BTC ‌
post-image
BTC-0.67%
Long from below 73,000; currently at 73,700, already up 1,800 points!
#BTC
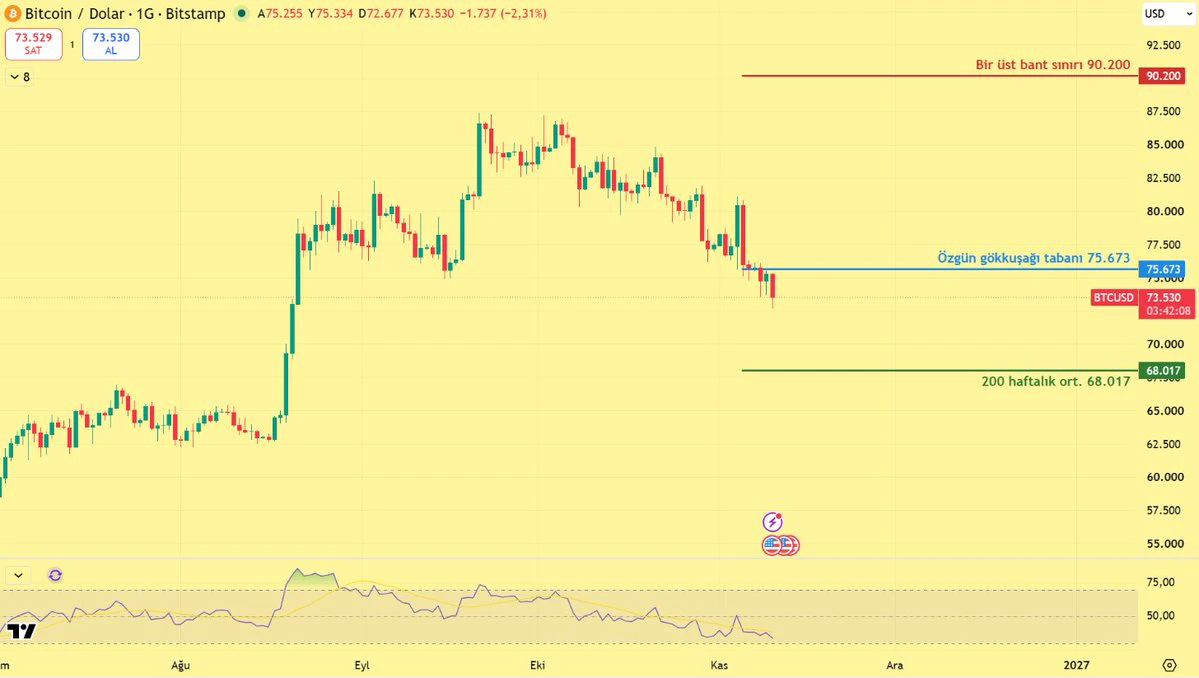
The lowest band on the Rainbow Chart.
Folks, Bitcoin $BTC is trading in the lowest band of the long-term Rainbow Chart.
In Blockchaincenter's current model, the price has been in the lowest "fire sale" band for 50 days. It would take a rise of approximately 23%, to around 90,200, to move into the next band. The price is 68% below the model's midline.
In the original Rainbow Chart, the floor of the lowest band is at 75,673. The price is also about 3% below that floor, meaning it has moved outside the chart.
The Rainbow Chart is not a price prediction, but a curve fitted to historical price
post-image
BTC-0.67%
Load More

Join 40 M users in our growing community

⚡️ Join 40 M users in the crypto craze discussion

💬 Engage with your favorite top creators

👍 See what interests you

Trending Topics

GateGlobalComplianceExpansion

9.31k Views260 Discussing

Gate continues to expand its global compliance footprint, now covering 81 regulated jurisdictions across Europe, North America, Asia, and Oceania. From MiCA and U.S. state-level MTLs to Japan’s FSA, Dubai, and Australia-related regulatory approvals, global exchanges are entering a new stage of compliance competition. Do you think regulatory strength will become as important as products and liquidity for exchanges in the future?

USCPIDataIncoming

71.36k Views2.4k Discussing

USIranTalksShowNewProgress

18.12k Views1.33k Discussing
View More