Square
Following
Hot
News
Notifications
Profile
Share your thoughts
placeholder
Article
From a high of 1988, it fluctuated downward all the way, with a low of 1875. All three take-profit targets were hit.

This is no longer about whether a single day's call was right; not one move in this month's market analysis was missed. From 2450 back down to 1900, in a downtrend, every rebound is an opportunity to short.
$ETH
ETH-1.23%
$AKE Start shorting now, or it'll drop before you do
post-image
AKE+6.07%
Trenches
mihao
m
bade
b
mihao
4Cxj...pump
Market Cap
$.
Change
.
24h Vol
$.
Holders
.
IDOL
I
bade
b
IDOL
0x3b...ab07
Market Cap
$.
Change
.
24h Vol
$.
Holders
.
FOOD
F
bade
b
FOOD
FTu5...pump
Market Cap
$.
Change
.
24h Vol
$.
Holders
.
AGT
A
bade
b
AGT
0x5d...e274
Market Cap
$.
Change
.
24h Vol
$.
Holders
.
NIO
N
bade
b
NIO
7SL2...pump
Market Cap
$.
Change
.
24h Vol
$.
Holders
.
The Butterfly project is making some progress now.
Paid card minting + liquidity pool opens upon sellout + token vesting
Each card corresponds to 8,440 tokens. When the pool opens, 20% unlocks upfront, and the remaining 80% is released linearly over 5 days.
If the cards don’t sell out, you can burn yours for a refund before the 21st.
Keep an eye on the progress before participating—after all, only 20% of the tokens unlock at launch.🤣
Link:
post-image
$WLD I'm screwed, this shitcoin is going to zero
WLD-5.61%
$XAUUSD ‌
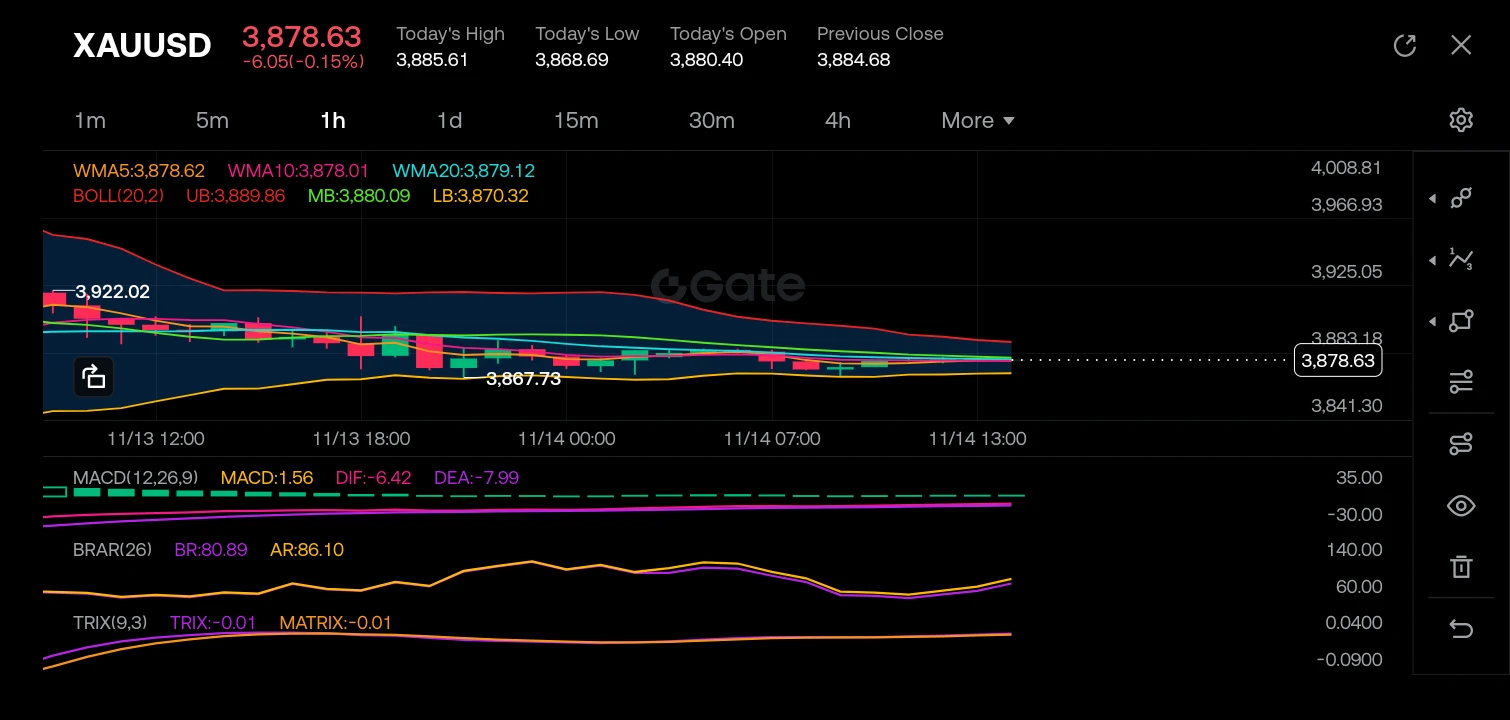
Gold ($XAUUSD) on the 1-hour timeframe is currently trading at 3,878.63 (-0.15%), caught in a tight, low-volatility consolidation phase following a sustained downward move from the 3,922.02 region. While sellers previously dominated the trend, downside momentum has stalled just above the 3,867.73 swing low, compressing price action directly beneath a cluster of flattened moving averages and the Bollinger Band midline.

➡️Prior Trend (Bearish): From 11/13 12:00 through 11/14 00:00, XAUUSD printed consistent lower highs and lower lows, driving price down into the 3,867.73 liquidity p
post-image
XAUUSD+0.00%
  • 3
  • 1
market update btc and eth
live-cover
LIVE2,064
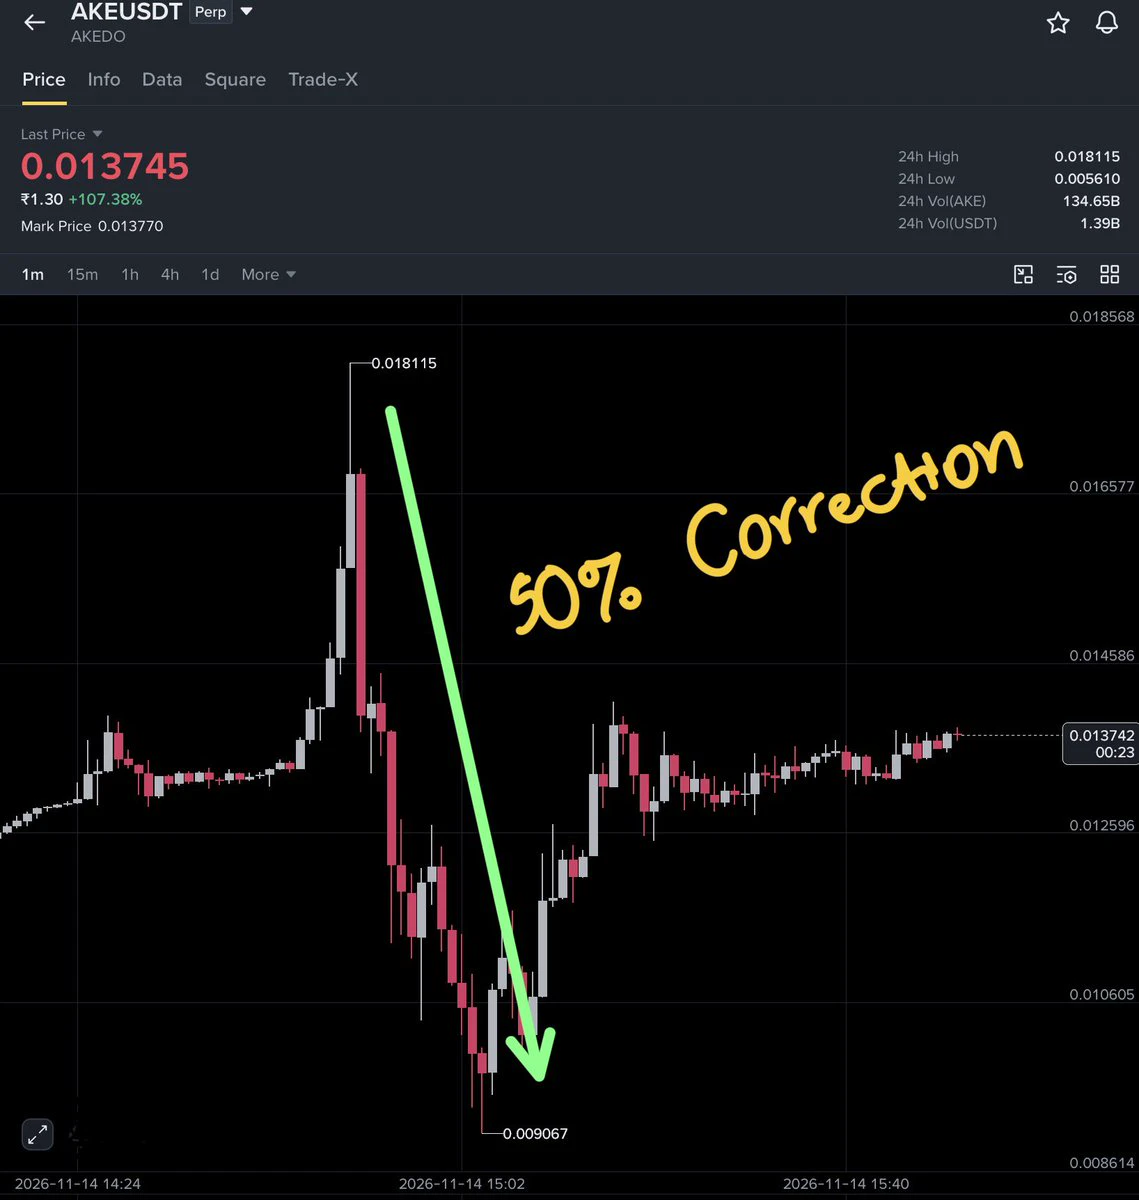
What’s happening with $AKE 😱
Price after hitting 0.018, then it went to 0.009 in few minutes.
Now it’s back to 0.014. Buyers are interested in Highs, so they may push towards 0.02 - 0.03, I guess .
post-image
AKE+6.07%
  • 1
  • 2
If it was easy everyone would do it.
Notifications on, BTC and ETH updates video coming up later🫡
BTC-0.67%
ETH-1.26%
$BTC Falling after the midterm elections—what comes next! Bitcoin has fallen about 15% since the election. If the trend follows historical averages, we could see another 10% to 15% decline. However, the following 12 months have historically been very strong. History may repeat itself!
post-image
BTC-0.67%
Friends in the U.S., do you know how lucky you are to be able to open Claude anytime and chat for a bit?

I use Claude in China, and every time I hit send, I’m as careful as a servant serving tea.

The tea can’t spill, and every word has to be delivered just right.

I’m afraid this princess might take a dislike to me and casually shut down my account too.
The widespread adoption of AI boosts productivity, but it could also enable a handful of companies to grow dominant, leaving ordinary workers marginalized.

AI is like a worker: it boosts efficiency but also gets squeezed. Big companies rake in the profits, while small businesses can only watch helplessly.

$BTC
post-image
BTC-0.67%
cryto live now
live-cover
LIVE1,049
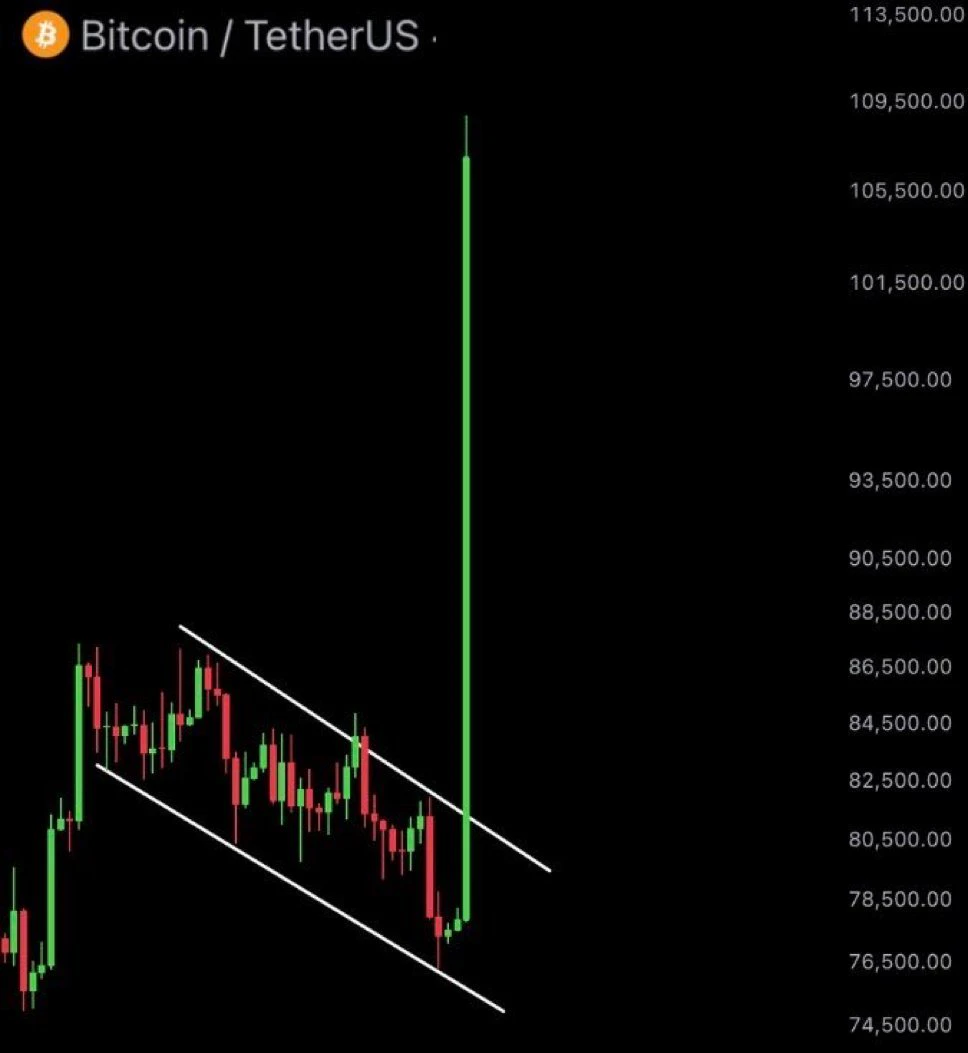
My expectations from crypto are getting lower every day.
I don’t need millions.
Just give me one decent green candle so I can feel something again. 😭
post-image
If gold is valued using “shadow prices,” the figures on paper really can come out to $5,200, $8,400, or even $21,000—numbers that seem unbelievable at first glance. A shadow price isn’t a real-time exchange quote; it’s derived by comparing the money supply with gold reserves. Some people divide U.S. M2 by official gold reserves and arrive at a theoretical value of over $8,000 per ounce. Use a broader measure of money or total global credit, and the figure can climb above $20,000. The $5,200 figure is more like a conservative coverage-ratio assumption. The huge differences between these models
post-image
GLDX-0.40%
PAXG+0.37%
BTC-0.67%
  • 2
  • 1
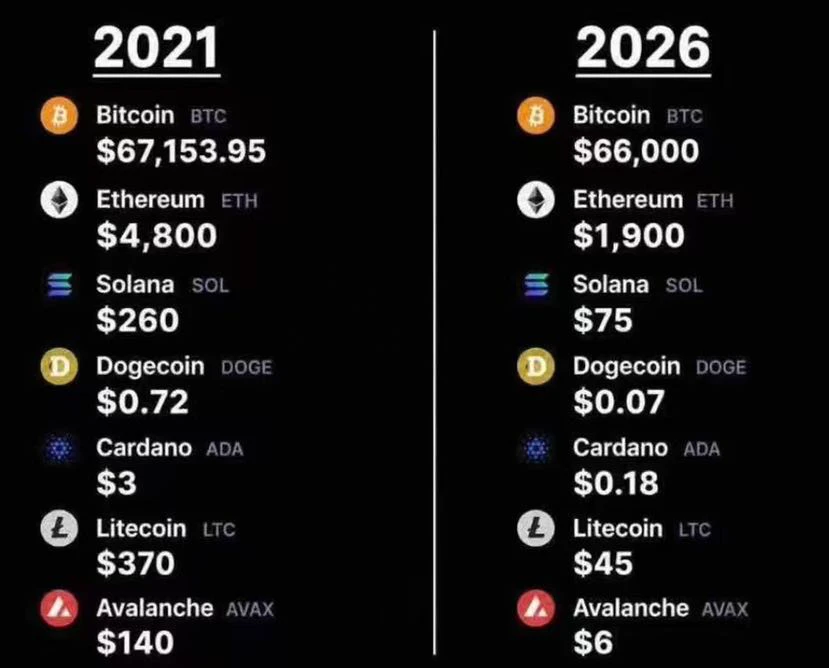
One chart lays bare the crypto market’s cruelest truth.

5 years ago, everyone was partying at the highs, talking big about the Ethereum Flippening, new L1 revolutions, ADA changing the world, and DOGE hitting $1;

5 years later, the bill comes due:
• Altcoins have been wiped out across the board, down anywhere from 60% to 95%; project teams cashed out and fled, while narratives came and went;

• Only $BTC remains, still firmly anchored at $66,000 after weathering an entire bull-bear cycle.

In the crypto market, 99% of altcoins aren’t assets at all—they’re just interest-free IOUs project tea
post-image
BTC-0.67%
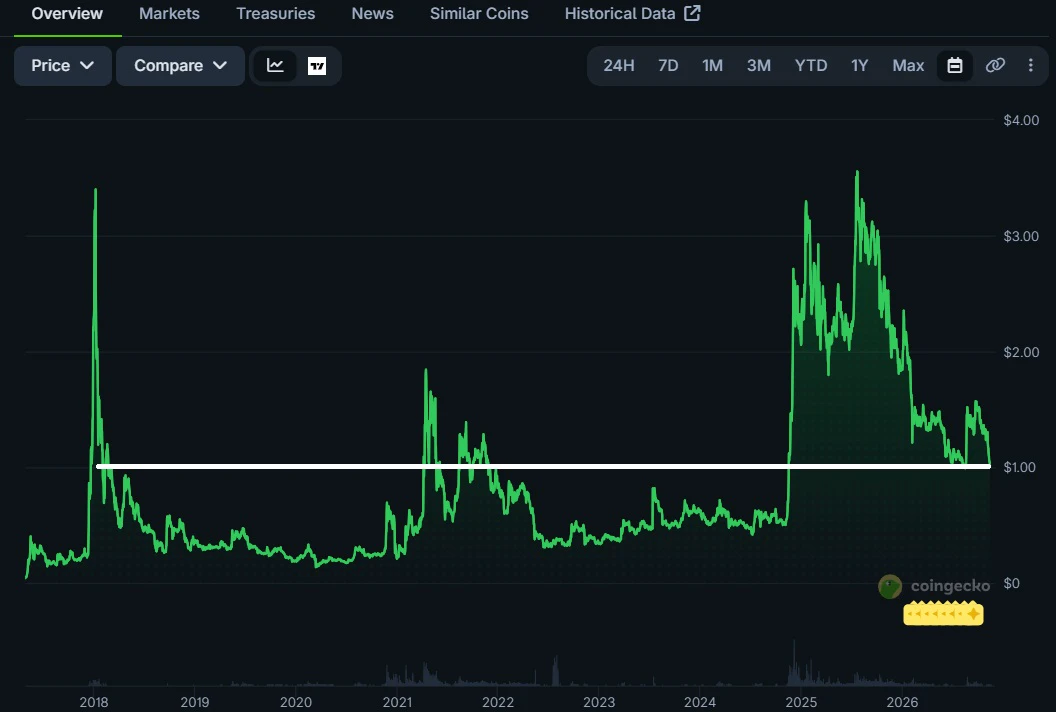
2017: $1
2018: $1
2021: $1
2022: $1
2024: $1
2025: $1
2026: $1
Can you guess the ticker?
post-image
Breaking:
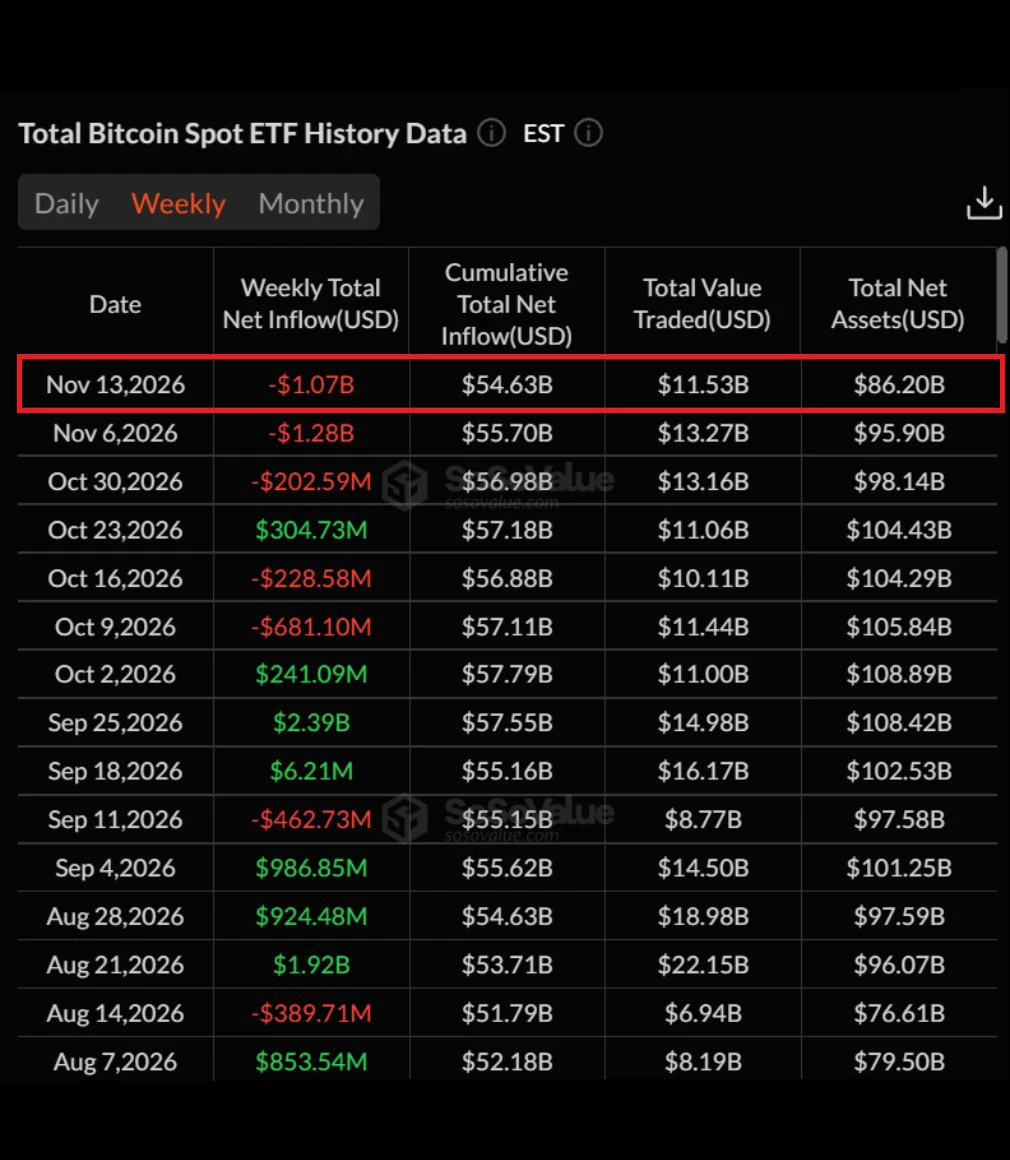
🇺🇲US Bitcoin ETFs, including BlackRock, sold $1.07 Billion worth of BTC this week.
Total ETF selling this month has now crossed $2.35 Billion.
post-image
BTC-0.67%
BLK+0.48%
Short $ETH : Price is near the 1900–1904 resistance zone. If 1904 rejects price, first watch 1873, then 1856. If price reclaims 1931, this setup is invalidated. I want to see sellers hold this area. A rejection here would look good. My observations:
- Price is at 1902, below the 4-hour EMA50, with the trend favoring sellers.
- The daily price is below the EMA200, adding support for this trading strategy.
- BTC's bearish trend supports this short idea.
Short zone 1900–1904 | Targets 1885, 1873, 1856 | Stop-loss 1931
Not investment advice · Do your own research
post-image
ETH-1.26%
BTC-0.67%
𝐒𝐓𝐎𝐏..... 𝐒𝐓𝐎𝐏..... 𝐒𝐓𝐎𝐏 🚨$BTC witnessed the largest stablecoin liquidity outflow of 2026! Look at the difference between previous pullbacks and the latest decline: 🔴 January 2026: BTC fell 38.42%, while stablecoin market cap declined only 1.92%. 🔴 May 2026: BTC fell 30.11%, while stablecoin market cap declined 3.70%. 🔴 October 2026: BTC fell 23.92%, but stablecoin market cap plunged 4.86%. Nearly $9 billion in stablecoin market cap evaporated. What’s concerning? Stablecoin liquidity is leaving the crypto ecosystem much faster than during previous pullbacks. 🚨 Less liquidity,
post-image
BTC-0.67%
ETH-1.26%
Everyone is saying gold is headed lower, but I haven’t seen enough reason to believe that. On the daily chart, it’s still moving within a descending channel. Sellers seem to have the upper hand, moving averages are weighing on the price, and sellers step in whenever a rebound gets near the channel’s midpoint. On the surface, sentiment is bearish. But I’ve heard “respect the range” too many times. When people call for a short while the lower end of the channel is holding, that often turns out to be the final leg. Take a typical channel-bound market: price touches the lower end for the third tim
post-image
GLDX-0.40%
PAXG+0.37%
XAU+0.38%
  • 2
  • 2
Load More

Join 40 M users in our growing community

⚡️ Join 40 M users in the crypto craze discussion

💬 Engage with your favorite top creators

👍 See what interests you

Trending Topics

GateIPOAccessAnthropic

309.8K Views2.8K Discussing

Gate IPO Access Phase 3 features Anthropic (ANT), with USDT subscription interest starting from 100 USDT. Successful allocations will be delivered as real shares to Gate Stock Accounts. Indicative price: $70–$78/share Subscription: Nov 12–17 (UTC+8) Allocation is not guaranteed. Please manage risk accordingly.

Dr.HanOxfordUnionSpeech

147.5K Views595 Discussing

USOctoberPPIBelowExpectations

462.7K Views1.5K Discussing
View More