Square
Following
Hot
News
Notifications
Profile
Share your thoughts
placeholder
Article
STRATEGY ADDED 210,333 $BTC … BUT LOST $22.78 BILLION IN VALUE. WHAT WENT WRONG?
On Oct 6, 2025: 640,031 BTC worth $79.82B.
Today: 850,364 BTC worth just $57B.
That's 210,333 additional BTC, yet nearly $23B wiped off its Bitcoin NAV.
Now imagine BTC reclaiming $125K.
Strategy's current holdings would be worth $106.3 BILLION. (+49B)
Accumulation continued. Valuation collapsed. What happens when Bitcoin reverses?
BTC-0.67%
CRYPTO BEST TRADING
live-cover
LIVE1,981
Trenches
mihao
m
bade
b
mihao
4Cxj...pump
Market Cap
$.
Change
.
24h Vol
$.
Holders
.
IDOL
I
bade
b
IDOL
0x3b...ab07
Market Cap
$.
Change
.
24h Vol
$.
Holders
.
FOOD
F
bade
b
FOOD
FTu5...pump
Market Cap
$.
Change
.
24h Vol
$.
Holders
.
Sakura
S
bade
b
Sakura
9sFG...pump
Market Cap
$.
Change
.
24h Vol
$.
Holders
.
AGT
A
bade
b
AGT
0x5d...e274
Market Cap
$.
Change
.
24h Vol
$.
Holders
.
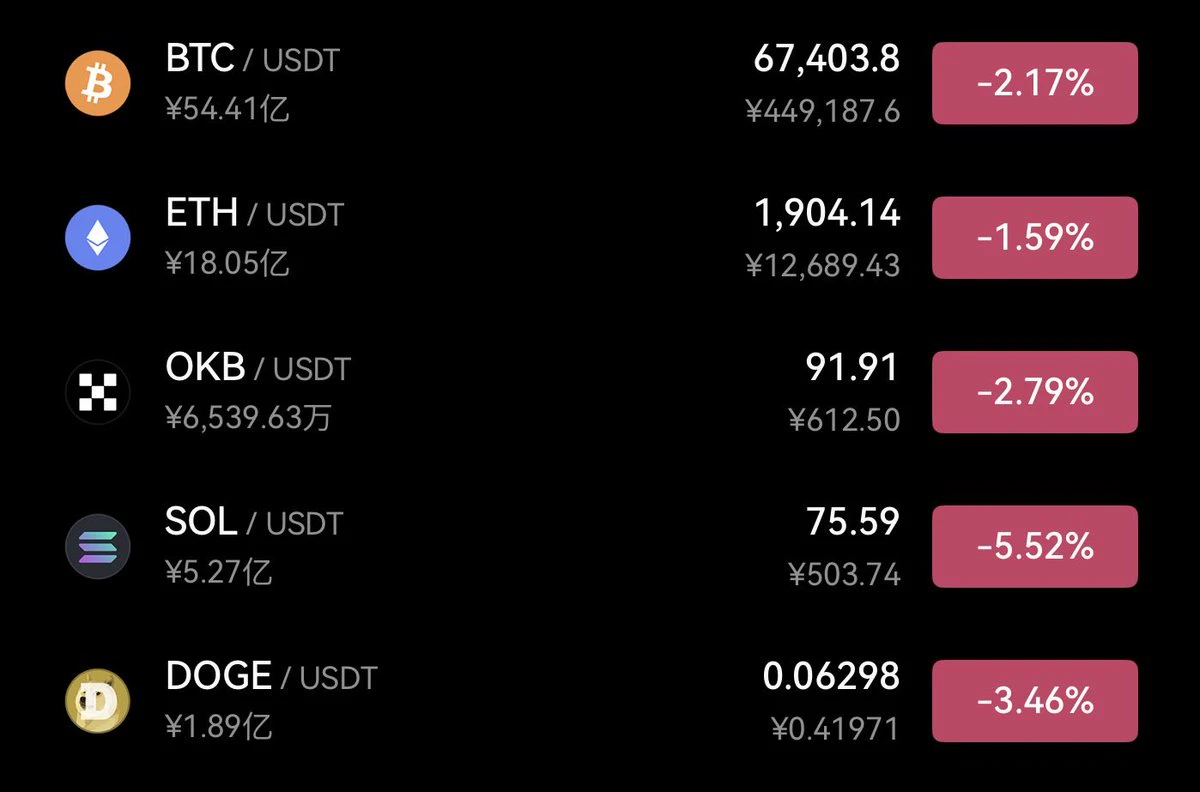
Every day, when I check the market and open my account, I have only one thought: hammer the hippo
post-image
In BTC trading, which suits you better: trend-following or countertrend trading?

There are two very common trading strategies in BTC trading: trend-following and countertrend trading. Some people like to follow the market trend, looking for opportunities to go long when prices are rising and to go short when they are falling; others like to look for market reversals after prices have risen or fallen sharply. So, what exactly is the difference between these two approaches?

First, trend-following: trade in the market’s primary direction. The core of trend-following is to identify the current t
post-image
BTC-0.67%
market update on gate
live-cover
LIVE2,616
Bitcoin Rebound Countdown? Short Positions Are Crowded, and a Stunning Reversal Could Happen Near $69k!

The further Bitcoin falls, the more likely the market is to see an interesting phenomenon: more and more people turn bearish, which may actually create the conditions for a rebound.
When a large number of investors bet on further declines, a sudden price stabilization could force shorts to cover their positions, driving prices sharply higher. This is known as a short squeeze.
Bitcoin’s daily RSI is already in oversold territory, so the possibility of a short-term rebound is worth watching.
BTC-0.65%
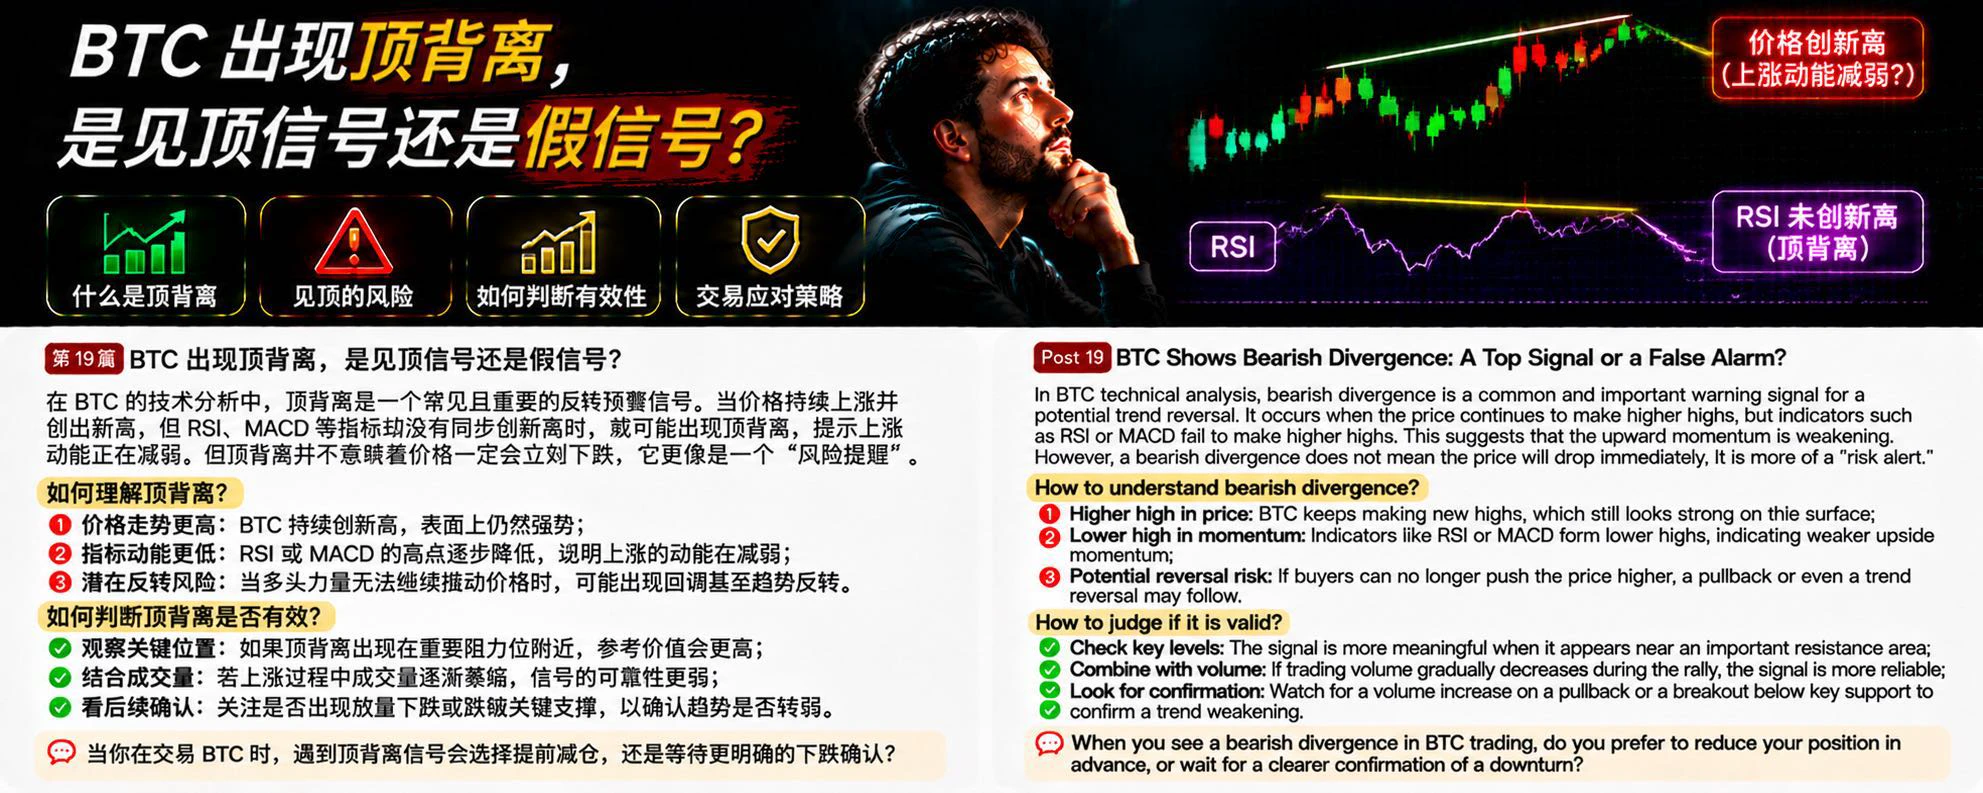
In BTC technical analysis, bearish divergence is a risk warning signal worth watching. Many traders see the price continually making new highs and assume the uptrend remains strong. But if the price keeps rising while indicators such as RSI or MACD fail to make new highs in tandem, bearish divergence may be forming.

What is bearish divergence?

Simply put, the price makes a higher high, while the technical indicator forms a lower high. This means that although the price is still rising, the momentum driving the rise may be weakening.

Why is bearish divergence worth watching?

First, upward m
post-image
BTC-0.67%
solana:4i5muJFFaTX7a6u9QhpZYs8Q1BwwCU4jSuRxAwuSHELL is currently at 0.03131, up 65.40% over 24H (range: 0.0188–0.05163). The 1H trend is strong, with an RSI of 66; the 4H trend is also strong, with an RSI of 69. If it breaks above 0.05163 decisively, watch for further upside. If it falls below the 0.01886 support level, the short-term structure may weaken. The market is highly volatile; for observation only.
post-image
SOL-0.77%
I have some good news to share with everyone!!
After years of hard work on X 💪,
I finally reached A1 level.
post-image
In cryptocurrency futures trading, 10x leverage may not sound particularly high, but many traders underestimate the risks behind it.

Suppose you have 1000 USDT and use 10x leverage. This means you can open a notional position worth about 10000 USDT (though the exact amount also depends on the margin mode and trading fees).

If the market price moves 1% against you, your position will incur an unrealized loss of about 100 USDT, equivalent to 10% of your principal. If the price moves 5% against you, the theoretical unrealized loss could reach 500 USDT.

This does not include trading fees, fundi
post-image
#USJoblessClaimsBeatExpectations US Jobless Claims Beat Expectations: What It Means for the Economy and Crypto Markets

The US labor market remains one of the most important indicators for understanding the direction of the global economy. Weekly jobless claims provide valuable insight into employment conditions, business confidence, and the overall strength of the American economy.

The latest US jobless claims report has attracted market attention as investors continue monitoring employment data for clues about the Federal Reserve's future interest-rate decisions.

Jobless claims measure the
post-image
BTC-0.67%
ETH-1.26%
proxima users getting drained
post-image
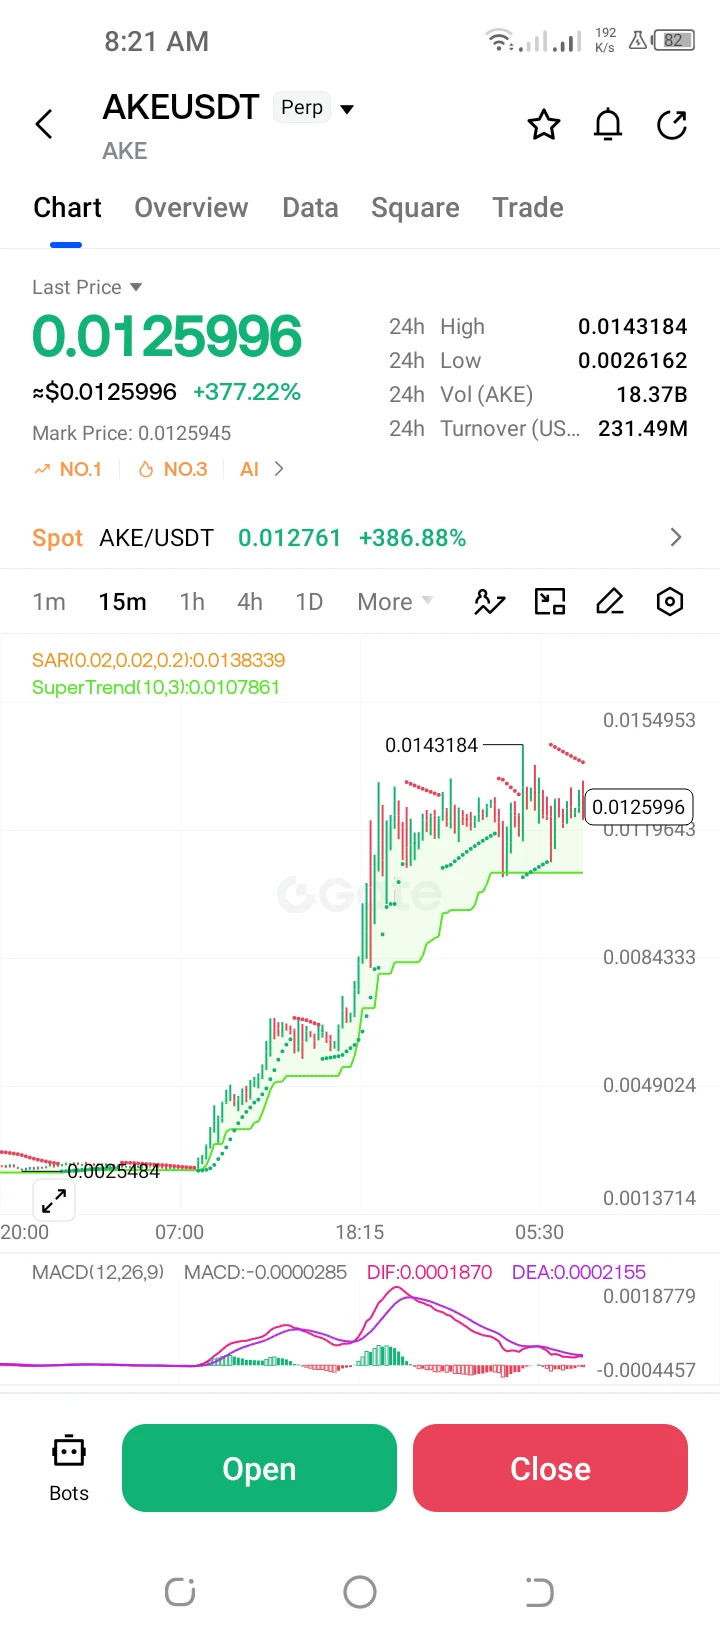
**$AKE /USDT Perp – "Hyper-Parabolic Extension – Long"**
Trading Plan Long $AKE
Entry: 0.0125996
SL: 0.0107861
TP1: 0.0143184
TP2: 0.0154953
AKE is up an astronomical +377.22%. MACD remains highly elevated. Targeting a retest of the 0.0143184 high. Use extreme caution and very tight risk management due to parabolic volatility.
#ShareWeekly.
post-image
AKE+6.39%
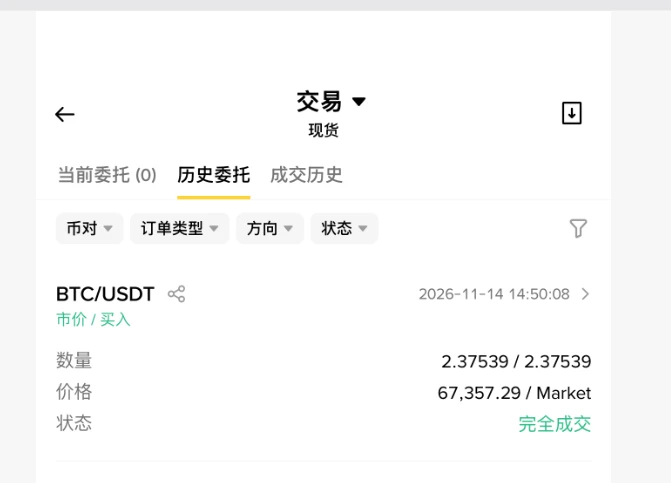
Although I’m extremely bearish on crypto, I still bought 2 BTC at 6700, showing I can’t let go of the industry;
Sigh, my damn human nature—it’s always hard to give up my love for crypto;
post-image
BTC-0.67%
#📊 US Jobless Claims Beat Expectations

The latest U.S. jobless claims data came in better than expected, pointing to continued resilience in the labor market.

💪 A stronger-than-anticipated employment picture could reduce concerns about a rapid slowdown in the U.S. economy, while also influencing expectations for the Federal Reserve’s next policy moves.

📈 Markets will be watching the impact on the U.S. dollar, Treasury yields, stocks, and crypto as investors assess what the data means for interest rates.

#USJoblessClaimsBeatExpectations #USJobs #Economy #FederalRes$MU
post-image
MU-2.56%
BTC has been moving sideways for three days, with its price fluctuating within a range. Many traders are starting to feel anxious: Should they go long or short?

In fact, the easiest mistake to make in a sideways market is to predict the direction of a breakout in advance.

There are three key signals to watch when assessing a breakout.

First, trading volume. If volume continues to rise as the price approaches the top of the range, it indicates growing market participation. But rising volume alone does not mean the price will necessarily go up; you also need to see whether it can hold above t
BTC-0.67%
$H This drop from 0.026 to 0.0206, down 15.46% in 24 hours—I just lost 2,300U on a similar setup last month, and that lesson hurt. But today, instead of ranting, I'll break it down with data—and this level is actually starting to look interesting.
First, volume: 24-hour trading volume is 19.5M. The low of 0.0198 wicked back up right around the 0.020 round-number level, suggesting panic sellers were absorbed in the 0.0198–0.0200 range. The price is down 15%, but volume didn't explode, so this looks like a wick after a slow decline on shrinking volume—not a high-volume collapse like a project te
  • 2
  • 3
#Analytics

#AKE Strong gains, but the price is overheated

AKE is trading at $0.01243 after rising 372.90% in 24 hours. On the four-hour chart, RSI 14 is 95.9 — extreme overbought territory. The assessment is mixed: the strength of the rally is clear, but the risk of a sharp correction is high. This RSI alone does not yet signal the start of a reversal.

The price is significantly above the EMA 20 ($0.00622784) and EMA 50 ($0.00556965), with the shorter average above the longer one. This supports a positive assessment of the trend, but the large gap from both averages underscores the overheat
post-image
AKE+6.07%
Ancestor worship is really a way for the living to put themselves at ease
post-image
$PI I said I wouldn’t buy, I said I wouldn’t buy, but they insisted I buy. Now look what happened—I’m stuck holding the bag, aren’t I
post-image
PI-0.60%
  • 10
Load More

Join 40 M users in our growing community

⚡️ Join 40 M users in the crypto craze discussion

💬 Engage with your favorite top creators

👍 See what interests you

Trending Topics

GateIPOAccessAnthropic

303.4K Views2.8K Discussing

Gate IPO Access Phase 3 features Anthropic (ANT), with USDT subscription interest starting from 100 USDT. Successful allocations will be delivered as real shares to Gate Stock Accounts. Indicative price: $70–$78/share Subscription: Nov 12–17 (UTC+8) Allocation is not guaranteed. Please manage risk accordingly.

Dr.HanOxfordUnionSpeech

147K Views583 Discussing

USOctoberPPIBelowExpectations

460.5K Views1.4K Discussing

View More