Square
Following
Hot
News
Notifications
Profile
Share your thoughts
placeholder
Article
🏆 Gate hits the global Top 3 — giveaway time! 🎁
Per DeFiLlama (Nov 9), Gate ranked 3rd globally among CEXs, with $40.66M in 24-hour net inflows.
Let's celebrate 💙
🎁 3 winners × 5 USDT
Join in 👇
✅ Follow @Gate_Livezh & @Gate__Live
❤️ Like + Repost
💬 What's a recent win you're proud of? Share it below! 🏆
📊
congratulations 🎉🎉 to all
$NVDA $GT $BTC
#GateRanksThirdIn24HNetInflows #GateLive #Gate #ShareWeekly
post-image
GateLive
🏆 Gate hits the global Top 3 — giveaway time! 🎁
Per DeFiLlama (Nov 9), Gate ranked 3rd globally among CEXs, with $40.66M in 24-hour net inflows.
Let's celebrate 💙
🎁 3 winners × 5 USDT
Join in 👇
✅ Follow @Gate_Livezh & @Gate__Live
❤️ Like + Repost
💬 What's a recent win you're proud of? Share it below! 🏆
📊 Source:
https://www.odaily.news/zh-CN/newsflash/532275
‍#GateLive #Gate
repost-content-media
NVDA-4.34%
GT-2.24%
BTC-0.67%
What Is an RSI and MACD Combination Strategy? How Can Different Indicators Confirm Each Other to Reduce Misjudgments from a Single Signal?

In cryptocurrency trading, using just one technical indicator can leave you vulnerable to interference from sideways markets or short-term volatility. RSI mainly reflects recent price momentum, while MACD helps track trend direction and changes in momentum. Combining the two lets you analyze the market from different perspectives, but it does not mean the signals will necessarily be more accurate.

First, what does each indicator show?

RSI is typically us
post-image
Trenches
PIEVERSE
P
bade
b
PIEVERSE
0x0e...25a9
Market Cap
$.
Change
.
24h Vol
$.
Holders
.
牛逼
牛
bade
b
牛逼
0x96...7777
Market Cap
$.
Change
.
24h Vol
$.
Holders
.
ON
O
bade
b
ON
0x0e...1d48
Market Cap
$.
Change
.
24h Vol
$.
Holders
.
STONK
S
bade
b
STONK
6GmA...UNgx
Market Cap
$.
Change
.
24h Vol
$.
Holders
.
FLOAT
F
bade
b
FLOAT
Bv1a...BMmr
Market Cap
$.
Change
.
24h Vol
$.
Holders
.
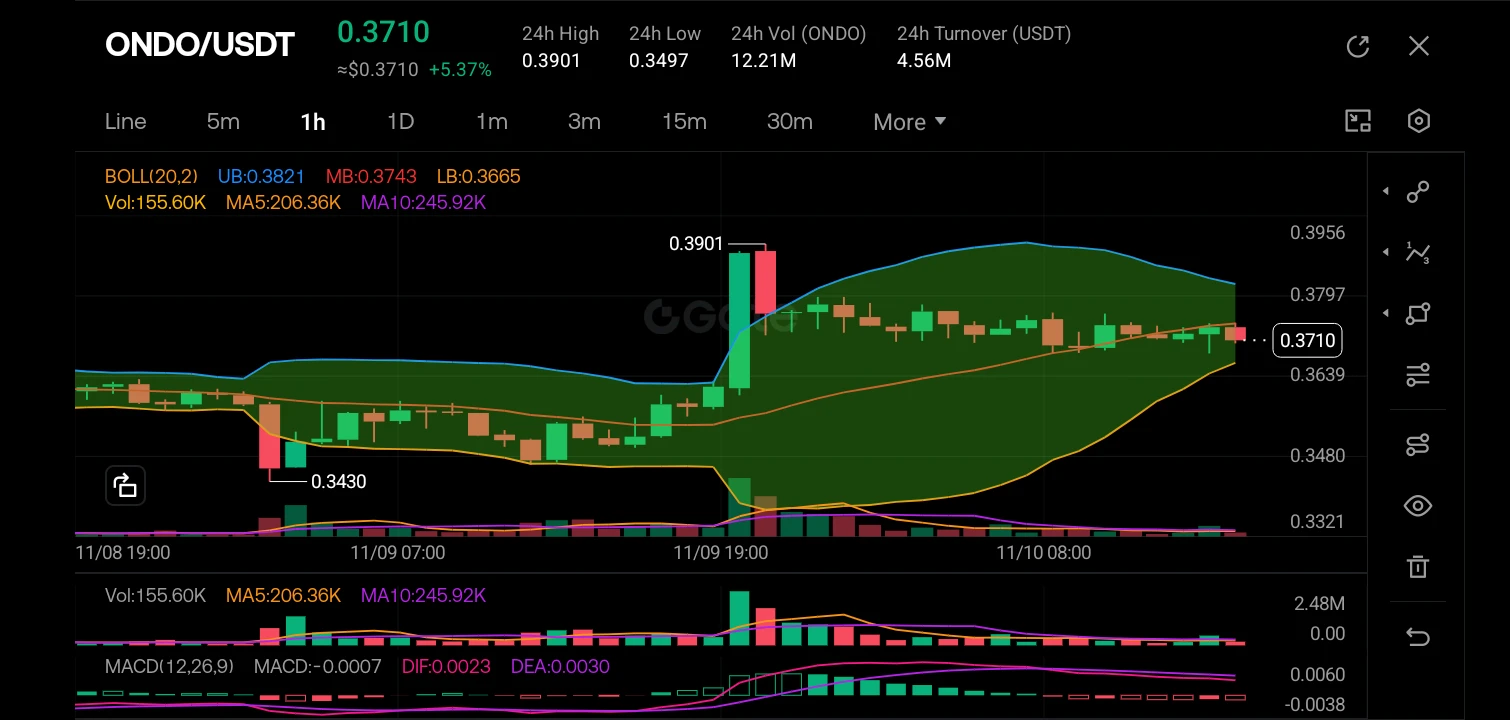
$ONDO ‌
The market structure has shifted from a bearish downtrend to a bullish reversal after a significant "impulse" move. We can see a clear break of structure to the upside, breaking above the previous consolidation zone around 0.3500 and peaking at 0.3901. Currently, the price is in a retracement/consolidation phase, holding above the middle Bollinger Band (MB: 0.3743) and the moving averages (MA5 and MA10), suggesting the bullish trend remains intact but is taking a breather.

The recent price action shows a massive green candle that pumped the price to 0.3901, followed by a series of sm
post-image
ONDO-0.29%
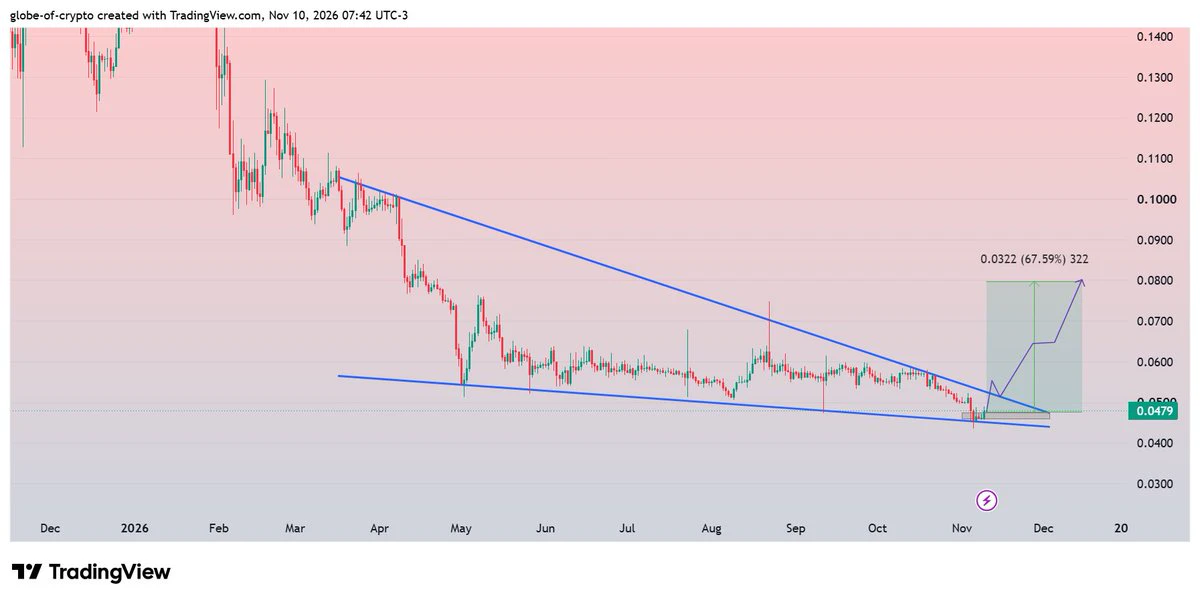
$WLFI #WLFI
Looking positive on a multiple support zone in the verge of Falling Wedge.
Bounce could follow our projected move for a breakout and solid rise during coming sessions ✍️
post-image
WLFI-0.16%
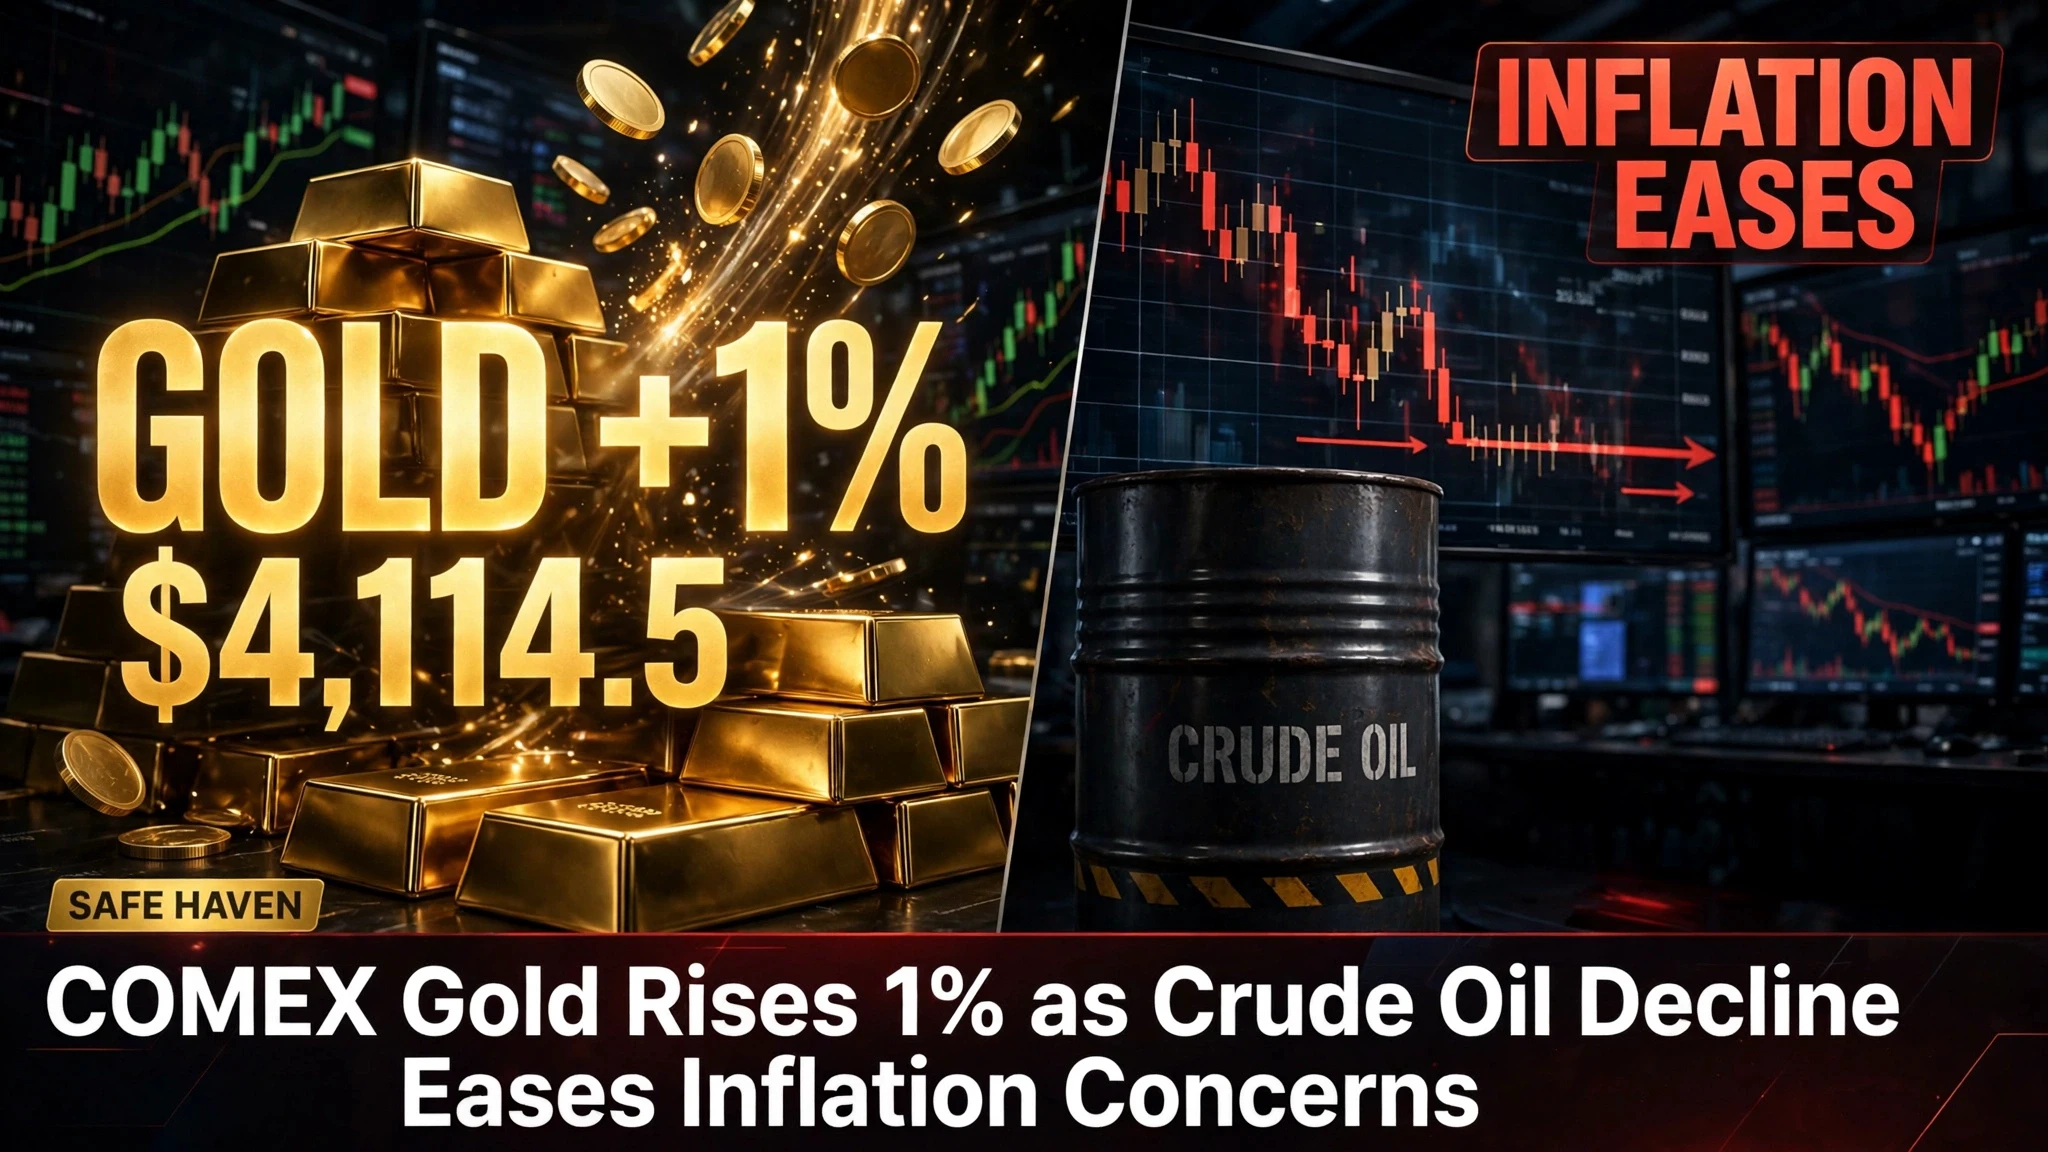
COMEX Gold Rises 1% as Crude Oil Decline Eases Inflation Concerns

COMEX Gold rose 1% to $4,114.5 on November 9, driven by an easing in the decline of crude oil prices, which helped alleviate inflation concerns.

This headline captures the complex interplay between commodities and macroeconomic sentiment. Gold is traditionally viewed as a safe-haven asset and a hedge against inflation. When crude oil prices decline, it generally reduces inflationary pressures because energy is a major component of the Consumer Price Index (CPI).

However, the phrasing "as crude oil decline eases" suggests that
post-image
XAU+0.38%
TSM+3.52%
MU+6.42%
🚀 SUI/USDT Deep Dive: Testing Crucial Support – Reversal or Further Consolidation? 📊

Hey Gate.io family! Let's take a comprehensive look at SUI/USDT as it navigates a fascinating price zone. SUI is currently trading around $0.8415, showing a +2.13% recovery over the last 24 hours.

Here is a complete technical breakdown across multiple timeframes to help you map out your next trade!

📈 Market Snapshot & Key Metrics
Current Price: ~$0.8415 (+2.13%)

24h High / Low: $0.8697 / $0.8188

24h Volume: 11.93M SUI

24h Turnover: 10.10M USDT

Sector: Layer 1 🌐

🔍 Technical Analysis & Price Action
SUI-1.01%
  • 1
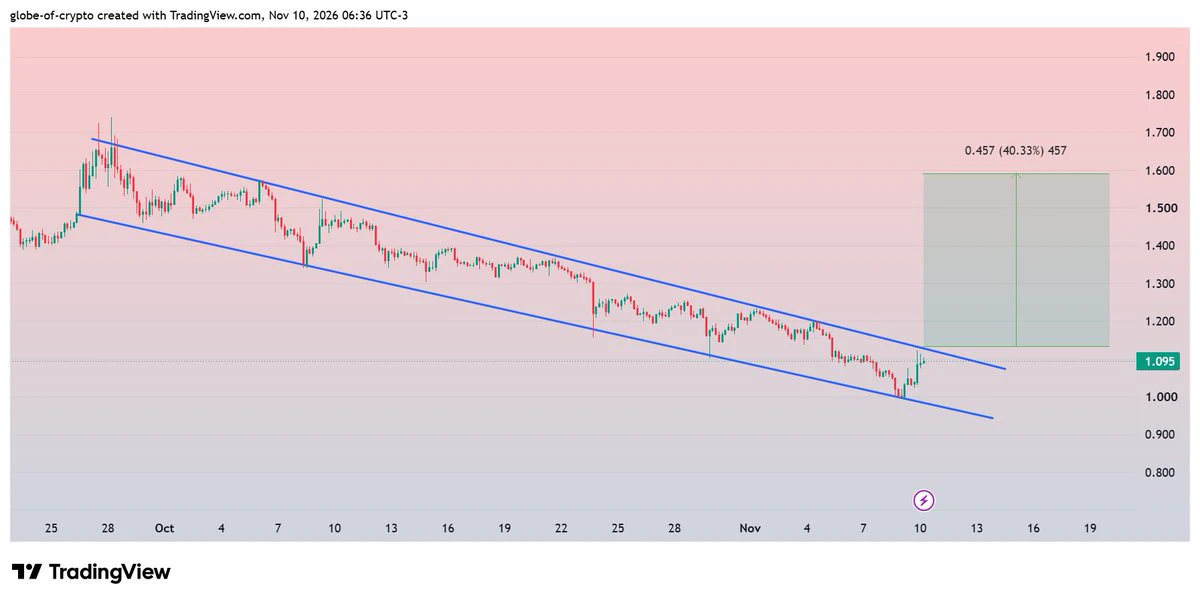
$GRAM #GRAM
Preparing for breakout of Descending Channel.
Successful breakout could provide 40-45% rise during coming days✍️
post-image
GRAM-0.97%
The entire internet caught Mr. Huang cheating
His wife walked away with $500 billion of the family fortune
His mistress was taken away by the FBI for questioning
Mr. Huang was brutally impeached by the board

In a late-night diner, Mr. Huang took the last of his flour, water, and oil
And quietly hand-pulled noodles by the door to support his family

Even the tallest tower starts from the ground; glory is built through your own efforts
post-image
🚨 High-energy alert! Just 1 hour until a major cognitive breakthrough!
Tonight at 20:00, this is more than just a meeting—it’s a showcase of “core value competitiveness” for Pai Life!
Sister Hong’s “Five Tiger Generals and 19 Arhats” and Ning Manxi’s “Phoenixes Drawn to the Wutong Tree”—miss tonight and you’ll definitely regret it!
⚠️ Take these final two steps now:
1️⃣ Follow the official Twitter account @PiLifeCTO!
2️⃣ Right now, immediately, this very minute! Scan the poster’s QR code to join the DeBox group! Tonight at 8, the battle begins on time!⚔️
BOX-3.36%
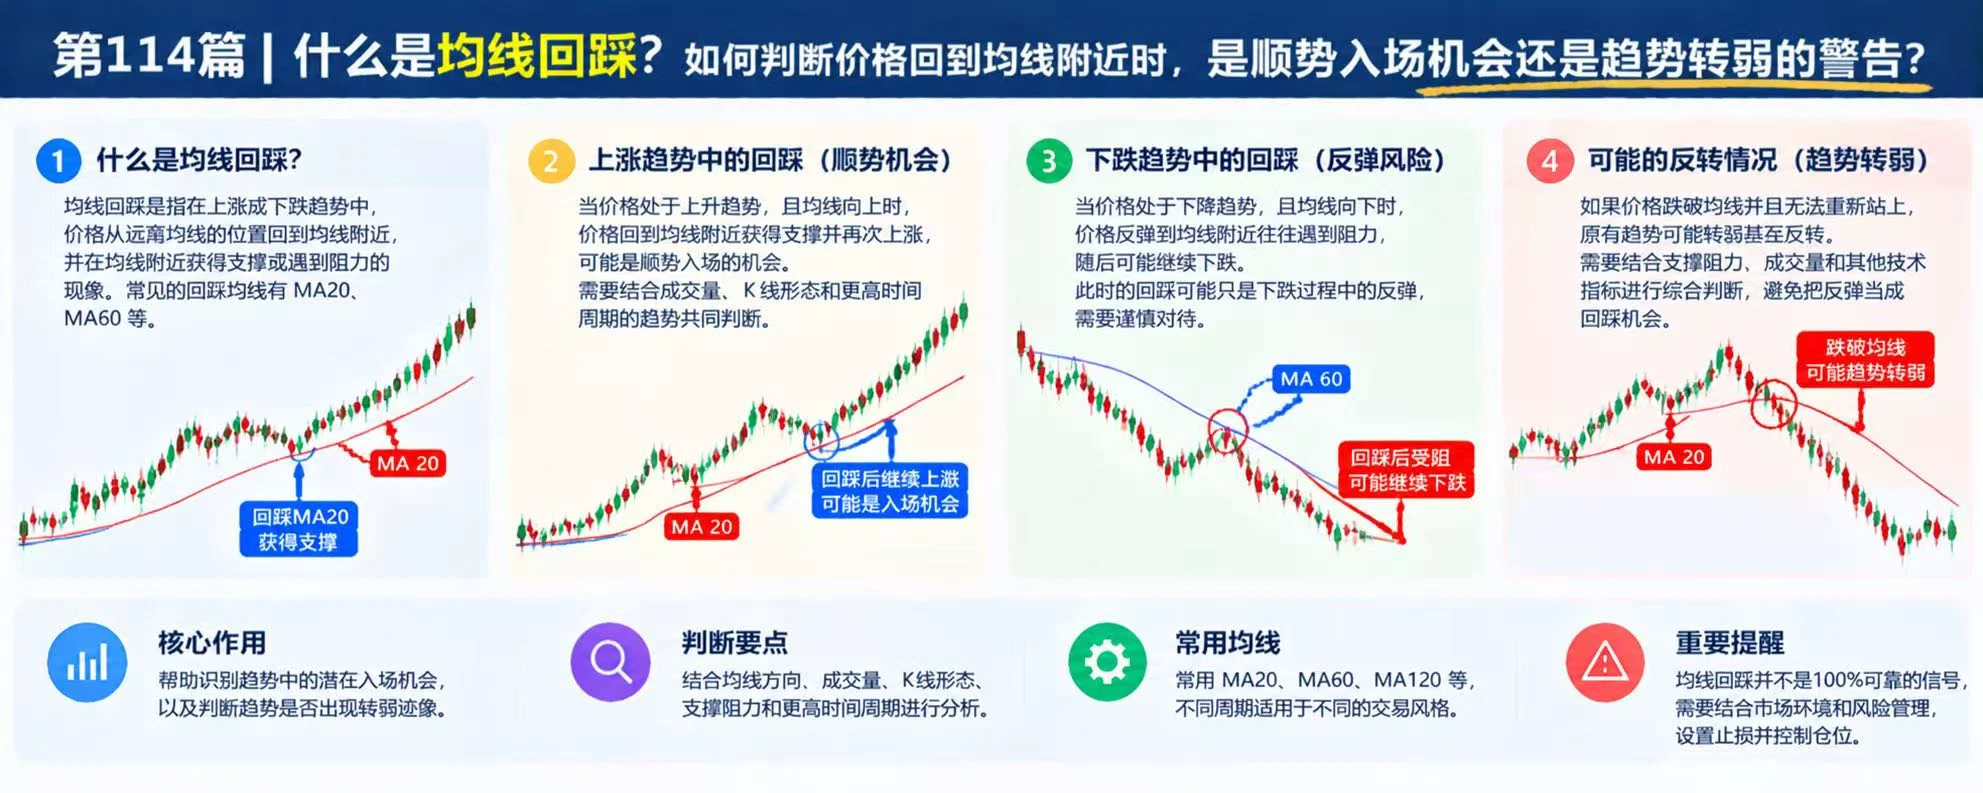
What Is a Moving Average Retest? How Can You Tell Whether Price Returning to a Moving Average Is a Trend-Following Entry Opportunity or a Warning That the Trend Is Weakening?

In cryptocurrency trading, after BTC rises steadily, its price sometimes pulls back to around the MA20 or MA60 before rising again. This phenomenon is called a moving average retest. It may offer an opportunity to watch for trend-following trades, but it can also signal weakening trend momentum. The key is to assess the market conditions when the retest occurs.

First, what is a moving average retest?

A moving average r
post-image
BTC-0.67%
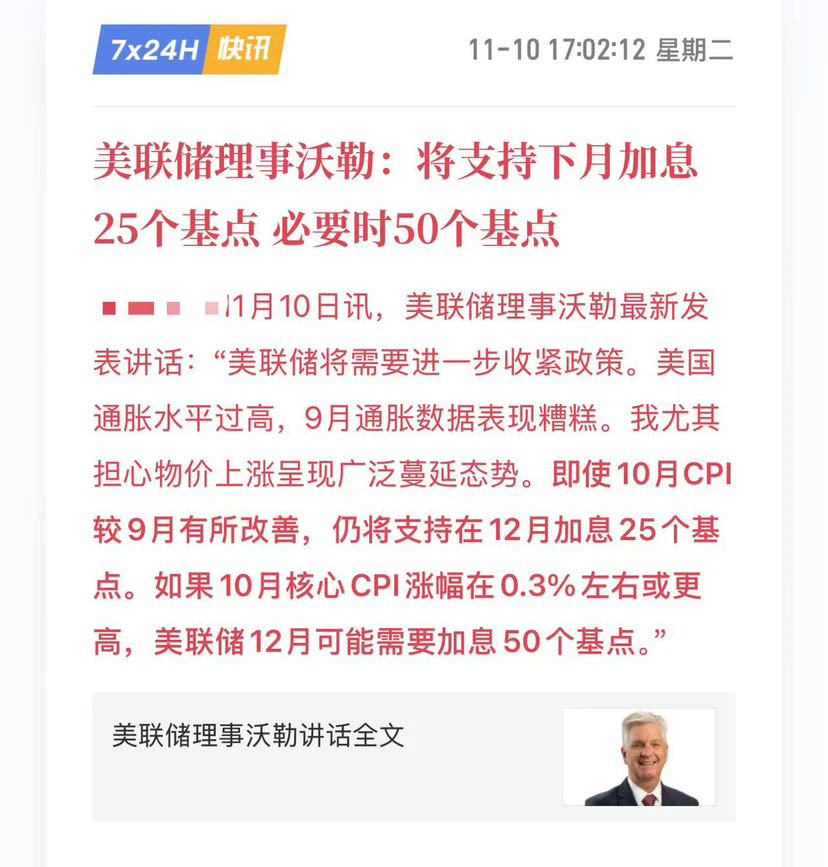
Maintains view of a 99% chance of a rate hike in December! #美国10月CPI即将公布
post-image
XiuHu_charts
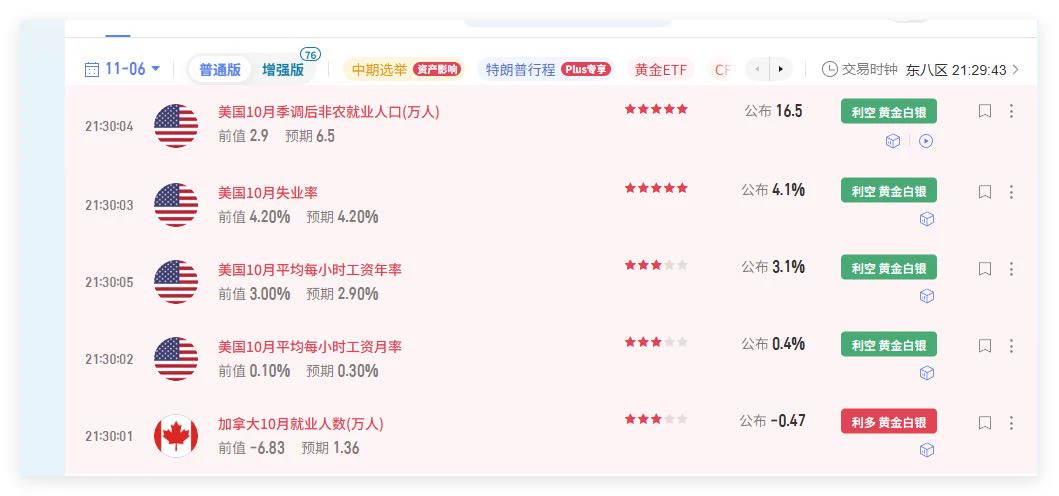
Based on today's nonfarm payrolls and unemployment rate, a rate hike in December is almost 99% certain!

Never mind that nonfarm payrolls far exceeded expectations; the drop in the unemployment rate looks bad on its own. Only a meaningful rise in unemployment can open the door to rate cuts.

Good luck to those trying to catch the bottom. I’m maintaining my bearish outlook. #10月非农数据聚焦
repost-content-media
What Is an RSI and MACD Combination Strategy? How Can Different Indicators Validate Each Other to Reduce Misjudgments from a Single Signal?

In cryptocurrency trading, using a single technical indicator can leave you vulnerable to interference from sideways markets or short-term volatility. RSI mainly reflects recent price momentum, while MACD helps track trend direction and changes in momentum. Combining the two lets you analyze the market from different angles, but it does not mean the signals will necessarily be more accurate.

First, what does each indicator show?

RSI is commonly used to
post-image
The battlefield is in Donbas; the bluster is on TV. The louder the threats, the weaker the hand. As the war drags on into a war of attrition, whoever can’t hold out will blink first. Who do you think will back down first this round? Follow along if you’re keeping an eye on it.
post-image
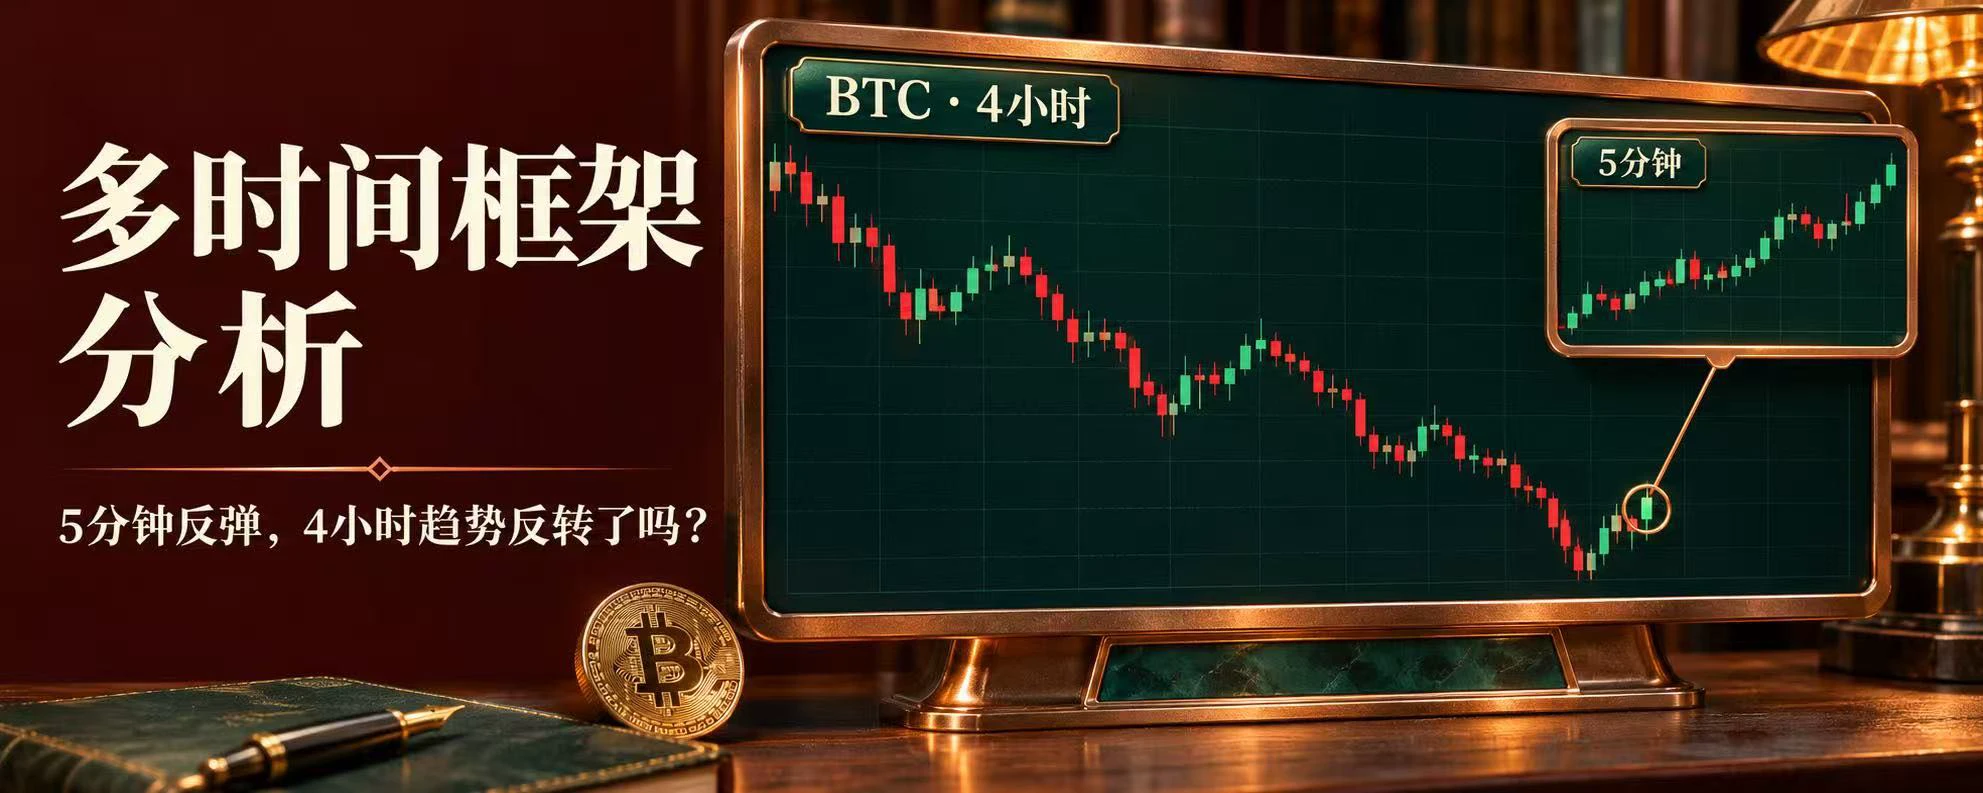
What Is Multi-Timeframe Analysis? How Can You Combine Short and Long Timeframes to Avoid Making Poor Decisions Based Only on Local Price Action?

In crypto trading, BTC may be rising on the 5-minute chart while still being in a clear downtrend on the 4-hour chart. If traders only watch short timeframes, they may mistake a bounce for a trend reversal. Multi-timeframe analysis involves examining price structures across different timeframes to help traders understand the relationship between local fluctuations and the broader trend.

First, what is multi-timeframe analysis?

It means observing se
post-image
BTC-0.67%
🔹Goldman Sachs CEO Remains Bullish on Computing Infrastructure! Data Center Demand Continues to Sur
live-cover
LIVE2,587
$Hana the real pump will be multiple xs like $Jct
HANA-3.22%
JCT-3.26%
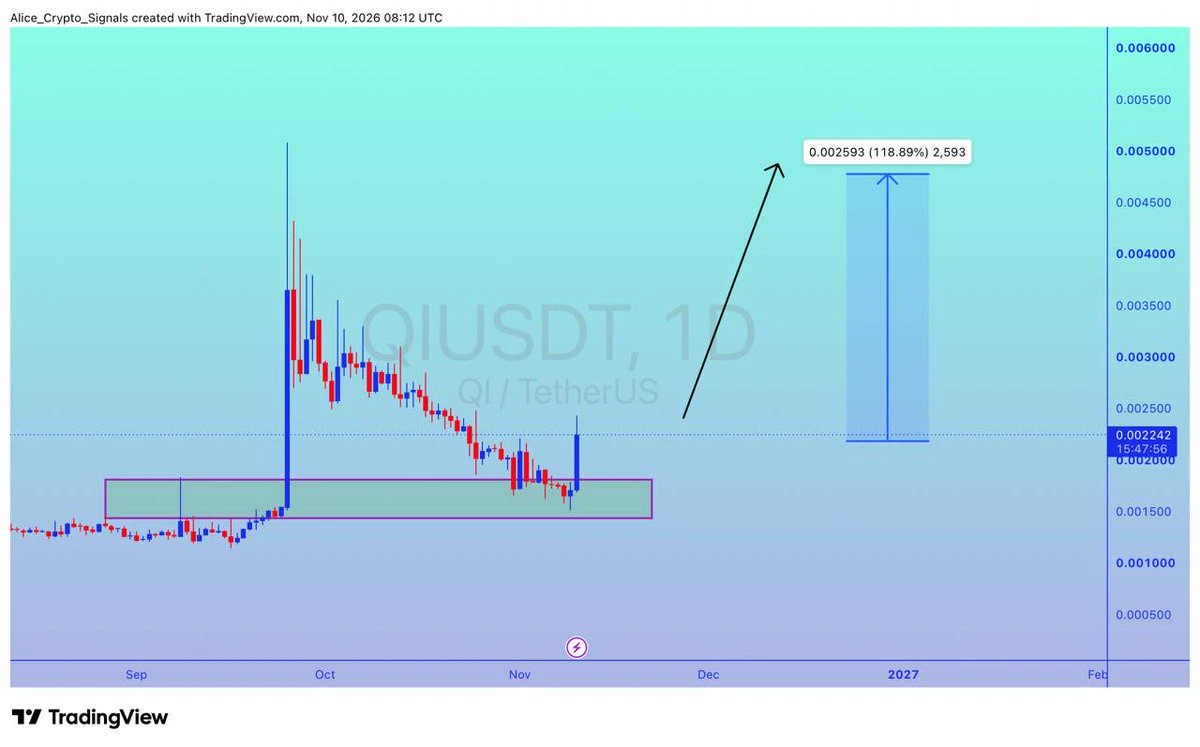
$QI
UPDATE
#QI is getting a good support here. In this move we can 100%+ gain here ✍🏻
#QIUSDT #QIBTC #BTC #Bitcoin #Crypto #NFTs
post-image
BTC-0.67%
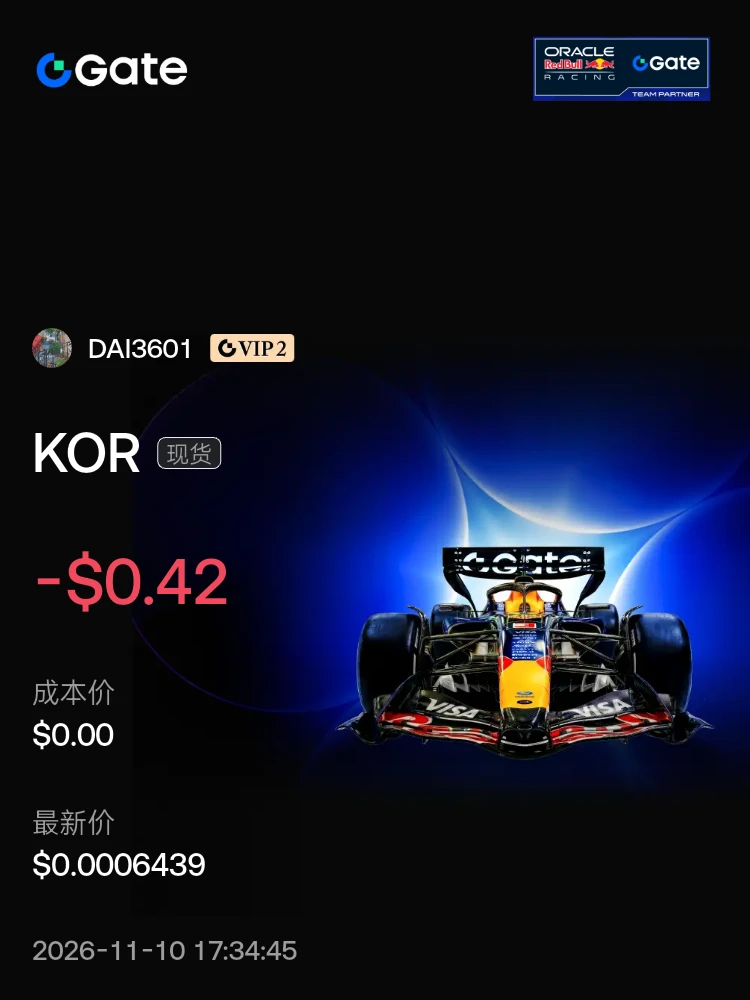
This is ridiculous! It launched and immediately tanked hard, dropping two zeros—now it’s down three zeros. I feel like it’s going to lose another zero. What was even the point of launching it? Sigh, who would still dare to buy in? Everyone’s just holding the bag now. My heart is ice-cold.
post-image
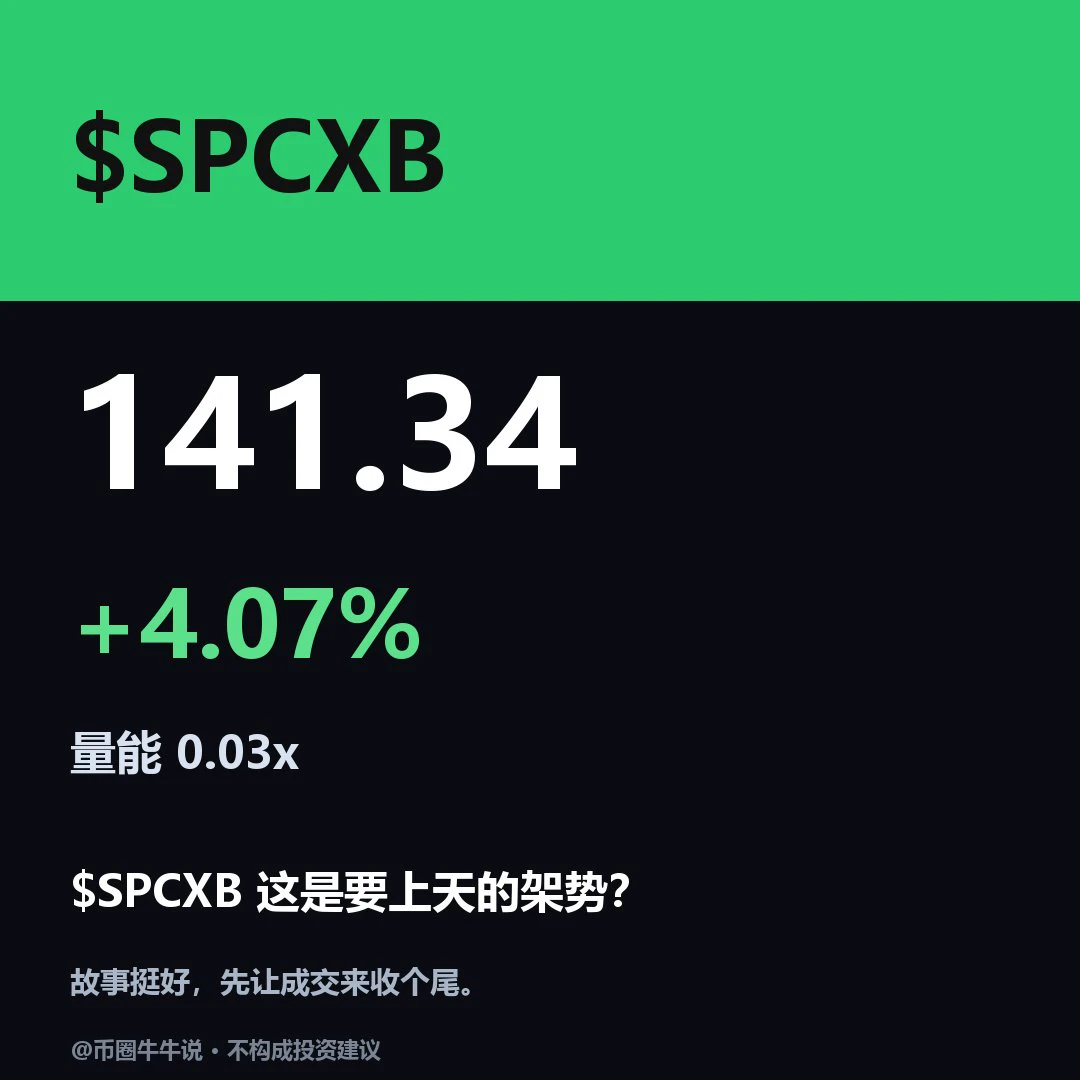
$SPCXB Currently trading at 141.34, up 4.07% over 24H. The 1H trend is slightly bullish, with EMA20 at 141.26 and RSI at 41; support is at 135.55 and resistance at 143.33. The 4H trend is slightly bullish, with EMA20 at 137.88 and RSI at 64; support is at 128.71, with resistance also at 143.33. Volume is only 0.03x the average, so a single move above resistance needs volume confirmation. The key level to watch is whether price can hold above 143.33; if it breaks below 135.55 and fails to reclaim it, the bullish structure will be invalidated. The market is volatile; for observation only.
post-image
crypto market update
live-cover
LIVE1,890
Load More

Join 40 M users in our growing community

⚡️ Join 40 M users in the crypto craze discussion

💬 Engage with your favorite top creators

👍 See what interests you

Trending Topics

GateGlobalComplianceExpansion

167 Views201 Discussing

Gate continues to expand its global compliance footprint, now covering 81 regulated jurisdictions across Europe, North America, Asia, and Oceania. From MiCA and U.S. state-level MTLs to Japan’s FSA, Dubai, and Australia-related regulatory approvals, global exchanges are entering a new stage of compliance competition. Do you think regulatory strength will become as important as products and liquidity for exchanges in the future?

USCPIDataIncoming

55.02k Views2.29k Discussing

USIranTalksShowNewProgress

10.06k Views1.29k Discussing

View More