

Share your thoughts
placeholder
Article
What is your view on this year’s super El Niño?
post-image
An established privacy coin is surging, with ZEC continuing to hit new highs!
ZEC's price action in this move has been very impressive, starting from around 751 and rising sharply on heavy volume to a high of 1223, with the current price at 1183.
On the 4-hour timeframe, the Bollinger Bands have fully opened upward, with the price running along the upper band. The EMA7 and EMA30 are in a bullish alignment, making the bullish trend structure very clear.
The SKDJ indicator is currently in the high range. Although it has not yet formed a clear death cross, its readings are already in the overboug
post-image
ZEC+17.29%
This wave was purely driven by good market sentiment—I casually tossed out some coins, and one just happened to land on my head. When I opened the chart this morning, I saw $HYPE still grinding around 83.212. Support had held, and volume had not deteriorated. I judged this to be the entry point and called for a long position.

And the result? The current price has already reached 87.632, and my account directly spit out a juicy +375.11% gain. The brothers on board should have woken up laughing. It was truly sluggish at first, but the breakout feels just as good.

The market is won by waitin
post-image
HYPE+3.83%
SOL+4.19%
DOGE+4.79%
“Can only talk to God once every five hours”
post-image
When it pumps, you call for 100x; when it dumps, you call for zero?
post-image
MARSCOIN market cap surpassed $265 million, setting a new all-ti
live-cover
LIVE1,797
ARB at $0.19—would you dare chase it?
Look at the surface first: a barrage of bullish news, doubling in two days, and late buyers getting trapped.
At the end of August, it was still languishing at 0.08-0.09. Everyone was calling ARB a “garbage governance token,” but from yesterday to today it surged straight to 0.20+, gaining over 100%. Countless people FOMOed in, then the price crashed from 0.206 to 0.19, leaving all the late buyers trapped at the top.
The daily RSI is severely overbought, and the upper Bollinger Band was violently broken through. It’s too hot and needs to cool down.
First: R
post-image
ETH+1.98%
HOOD+3.62%
ARB+45.58%
A few days ago, I was still calculating whether I had enough money for instant noodles this month; this morning, I was already wondering whether to add sausage. All I can say is, $PEPE is really considerate. A few days ago, I took one look before bed: the bottom had been moving sideways for so long, and volume kept shrinking without moving. Based on experience, this kind of level is about building momentum; only a breakdown counts as admitting defeat, and lying low without moving before that is the best move. And what happened? It really got up on its own. Nobody said a word while it was grind
post-image
PEPE+3.24%
ADA+3.53%
ZEC+17.29%
I just casually tapped refresh, and it went up on its own, leaving me in a very passive position. A few nights ago before bed, I glanced at $UNI ’s UNI. The bottom had moved sideways like concrete, the key level held, and funds were quietly flowing back in. If you don’t get on board at a time like this, once it ignites, all you can do is watch others count their money.
Sure enough, it gave us the answer. Entered at 6.051, now at 7.034, with 80% secured as profit—feeling great, guys. 🙌
Here’s the position management: take profit on 80% first and put the bulk in your pocket; protect the remainin
post-image
UNI+12.01%
DOGE+4.79%
ZEC+17.29%
$7 UNI: are you chasing the rally or sitting it out?
Look at the surface first: it has gone parabolic, but is starting to pull back.
From the $2.3-$3 lows in early June, UNI has produced a steep primary uptrend. It has risen 30-50% over the past week and more than 70% over the past month, touching an intraday high of $7.48 today before falling back to around $7. The weekly chart has just broken above and confirmed the upper boundary of the 4.90 mid-term range, and the mid-term target of 7.56 has already been reached. Daily RSI has surged to around 80, while MACD momentum is slowing—the trend i
post-image
BTC+0.39%
ETH+1.98%
UNI+11.99%
ethereum:native looks bullish consolidation
post-image
ETH+1.98%
🚨 DON'T MISS THIS: Why is nobody talking about this $NBIS breakout on X?
Bull flag break, can clear 231 to target the local highs near 280.
post-image
NBIS+7.51%
My hand trembled slightly when I set the stop-loss a few days ago; this morning, I realized that extra precaution had been unnecessary. Before the market had fully kicked into gear, I saw constant selling pressure on $TRUMP /TRUMP during the rebound, and the volume looked off too—classic low-volume rebound. Veteran traders know that this kind of rebound is a paper tiger, collapsing at the slightest poke.
The last thing I saw before bed was 2.36 starting to move downward, and the short position opened at 2.566 played out perfectly. It felt great—the high-level resistance trade was executed with
post-image
TRUMP-1.79%
BNB+0.71%
LAB-2.48%
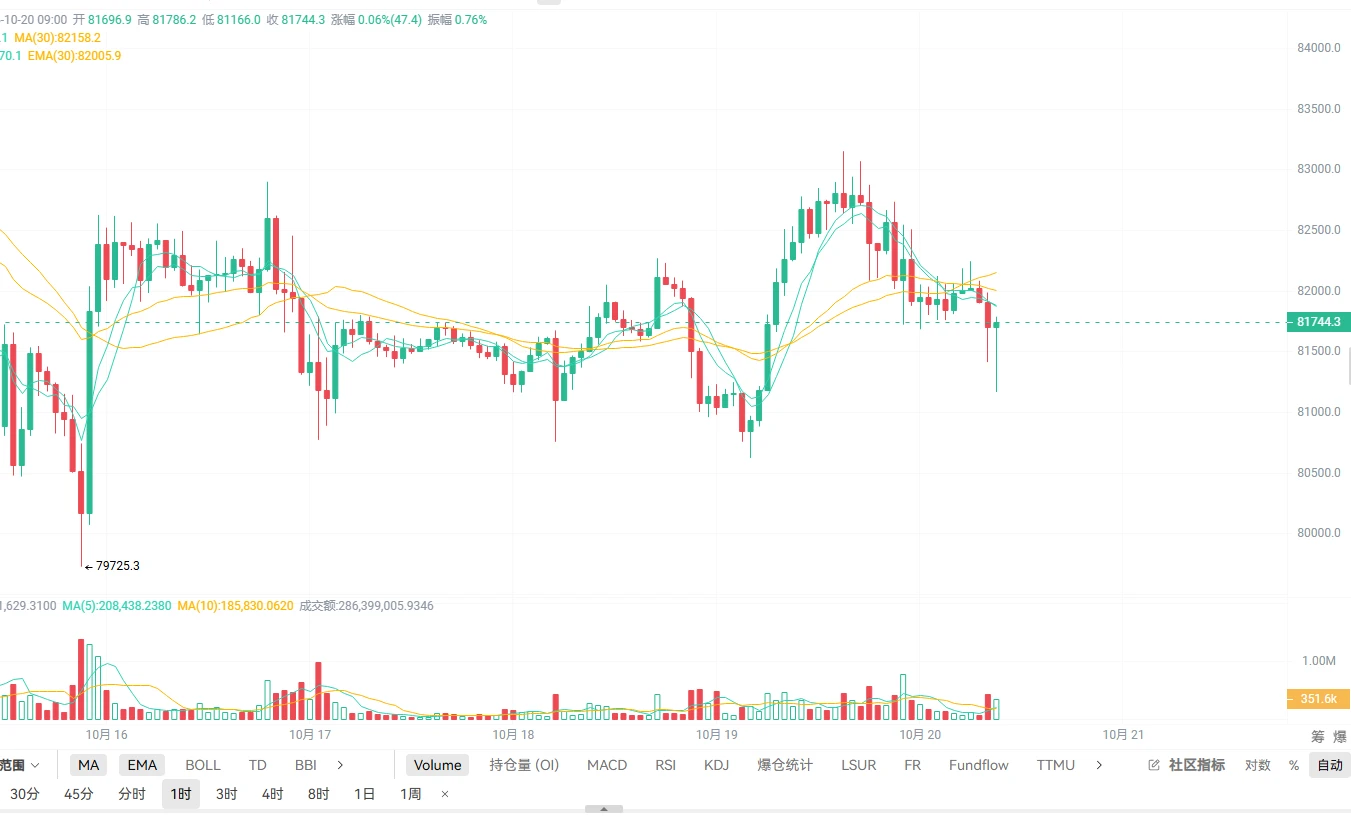
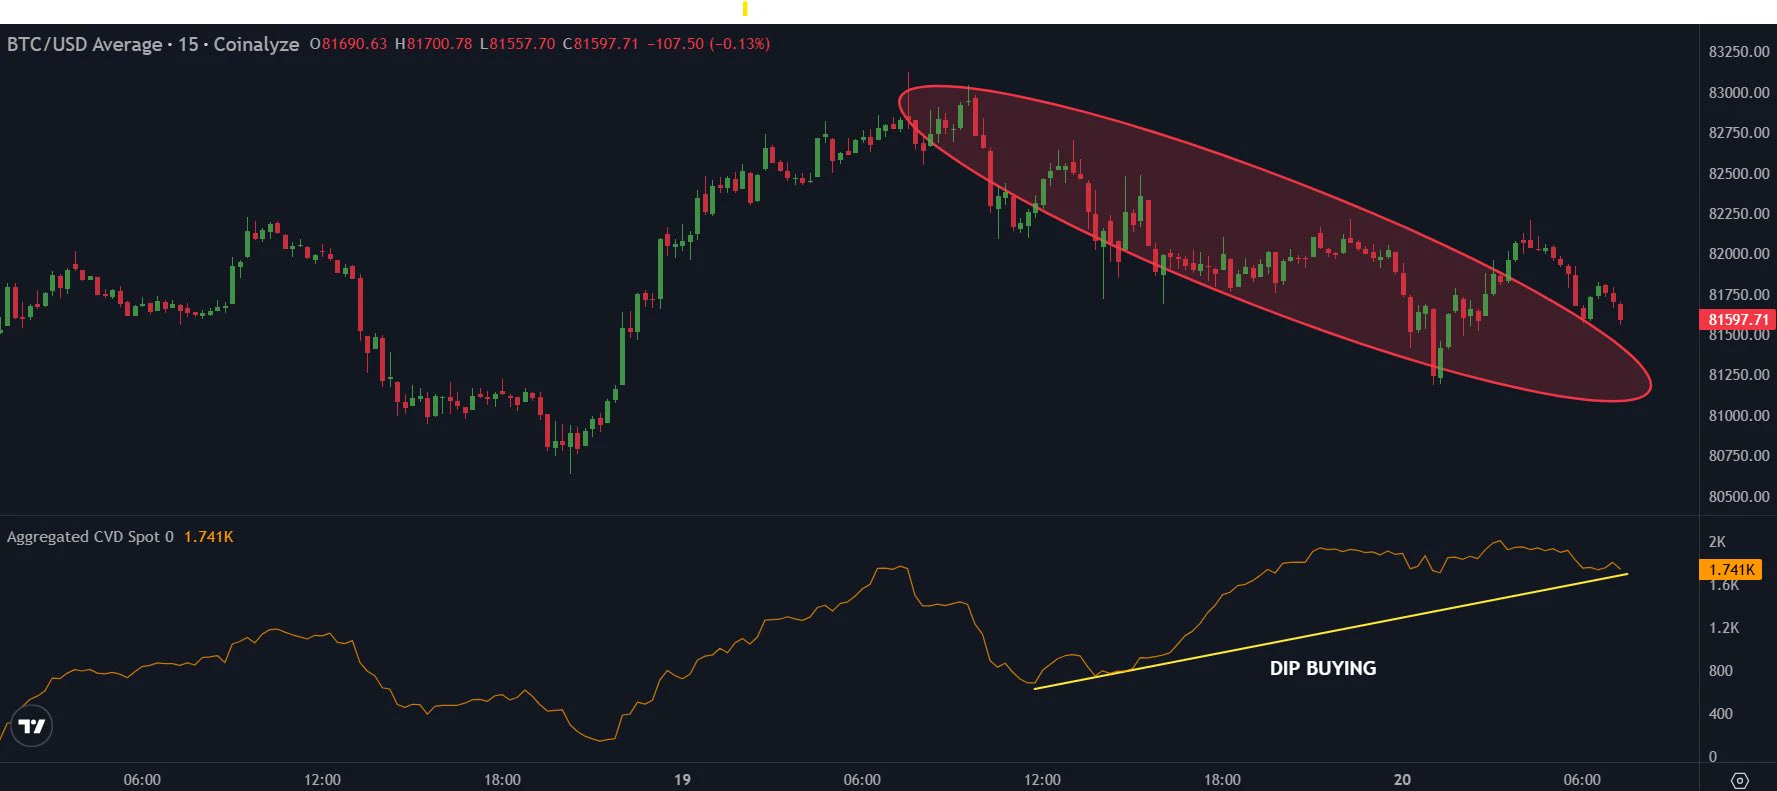
BITCOIN IS BACK AROUND $80,000
post-image
BTC+0.39%
$APT Signal】1H pullback on declining volume, 4H bullish expansion—go long
$APT Current price 0.6236, after rising to 0.6331 in 1H, it pulled back on declining volume and is hugging the 4H EMA20. The 4H MACD histogram is expanding upward, and the upper Bollinger Band at 0.6305 has opened. The order book bid depth ratio is 1.10, with aggressive sell orders being quickly absorbed. RSI is 66 on 4H and 59 on 1H, with the bullish side not overheated.
🎯Direction: Long
⚡Entry/limit order: 0.621729 - 0.623600
🛑Stop-loss: 0.617364
🚀Target 1: 0.632954
🚀Target 2: 0.637631
🛡️Trade management:
- After
post-image
APT+4.25%
BTC+0.39%
ETH+1.98%
SOL+4.16%
Guys, rest assured
I haven't done anything productive or made any money
I haven't gone to work either
I'm out here having fun while in debt hahaha
Everyone’s watching 54.25 on LTC—but the real trap is the 55.57 ceiling they’re not seeing.

$LTC /USDT - SHORT

Trade Plan:
Entry: 54.11 – 54.39
SL: 55.57
TP1: 53.26
TP2: 52.60
TP3: 51.62

Why this setup?
- 4H bias is SHORT with 55% confidence, yet 1D trend is *range*—that’s a coiled spring, not a crash.
- RSI 15m at 48.9 = no momentum, just chop. The 1H ATR (0.548) says moves are tiny—so why force it?
- Entry at 54.25 is armed, but TP1 at 53.26 is only 1.8% away. If we break 55.57 (SL), the alt targets flip to 55.90+ instantly.
- Why now? Because a range-bound asset with a weak SHOR
LTC+2.61%
No sense of scale, can’t hold on—the profits on this trade are paper-thin, but I’m absolutely loving it.
When the screen was glowing green, I set my sights on $WLD . The price repeatedly retested 0.3669 but managed to hold, and this kind of resilience in a weak market looked more like a signal light. While everyone else was running, I went long with a small position instead. Unexpectedly, the market really came through, climbing all the way to 0.4022, for a return of +681.22%.
Sideways movement at the bottom is an accumulation of strength, while holding firm after a retest shows confidence. Wea
post-image
WLD+3.43%
LAB-2.48%
SNDK+1.58%
Load More

Join 40 M users in our growing community

⚡️ Join 40 M users in the crypto craze discussion

💬 Engage with your favorite top creators

👍 See what interests you

View More