Square
Following
Hot
News
Profile
Share your thoughts
placeholder
Article
Conclusion first: Short-term bias is bearish, but it has entered the oversold rebound zone. The risk-reward of chasing shorts is low; wait for a rebound toward the moving averages before shorting, or try a rebound with a small position.
From a capital-flow perspective, KORUB plunged 23.73% over 24h, with only 21.2M USDT in trading volume, indicating a decline on shrinking volume. This suggests that longs have not capitulated on a large scale, and the selling pressure mainly came from leveraged longs being liquidated. RSI at 30.5 is approaching oversold, while the MACD histogram has turned pos
post-image
KORUB
KORUBSouth Korea Bull
Four.meme
MC:$3.67KHolders:1
0%
PLUME-9.16%
SOL-3.17%
#SolanaMajorUpgradeScheduled #ShareWeekly $SOL
On October 21 at around 14:50 UTC, Solana swaps out its consensus mechanism for the first time since genesis. Alpenglow replaces TowerBFT, and the headline is finality dropping from about 12.8 seconds to a target of roughly 150 milliseconds. Here’s what I think is solid and what’s still a promise.
1. What actually happens that day
Activation is set for epoch 1064, around 15:00 UTC. TowerBFT is scheduled to keep running for about 18 minutes (5,000 slots) after the feature switches on, then Alpenglow takes over. The network’s own guidance says wall
post-image
SOL-3.17%
The market weakened in the afternoon session; going long secured 30 points of profit! Getting in means making money! $XAUT
post-image
XAUT+1.26%
📉 CPI bearish catalyst fully priced in, BTC breaks below $82,000, leaving longs in a tough spot
Just a few days ago, people were discussing 90K, and now BTC has returned to around 81K.
U.S. September CPI rose 3.7% year-on-year, while core CPI reached 2.6%, both above market expectations. Inflationary pressure has heated up again, BTC has broken below $82,000, and long liquidations have increased.
This wave of decline may test not market judgment, but trading discipline.
Some are looking for opportunities during the pullback, some are reducing positions to manage risk, while others would rathe
post-image
BTC-2.45%
$CGPT CGPTUSDT READY TO FLY?
The price is moving within a descending channel on the 1-hour timeframe. It has reached the lower boundary and appears set for a rebound; a retest of this boundary is expected, which should support an upward move.
The Relative Strength Index (RSI) indicates a bearish trend, but given the "oversold" condition on the 1-hour timeframe, there is a high probability of an upward breakout from this downtrend.
An orange trend line is present, providing support for an upward rebound.
There is an initial support level at 0.02022, which acts as a primary support zone for the
post-image
CGPT-8.23%
US stocks came out on top again today
Treat myself to a chicken leg🍗
post-image
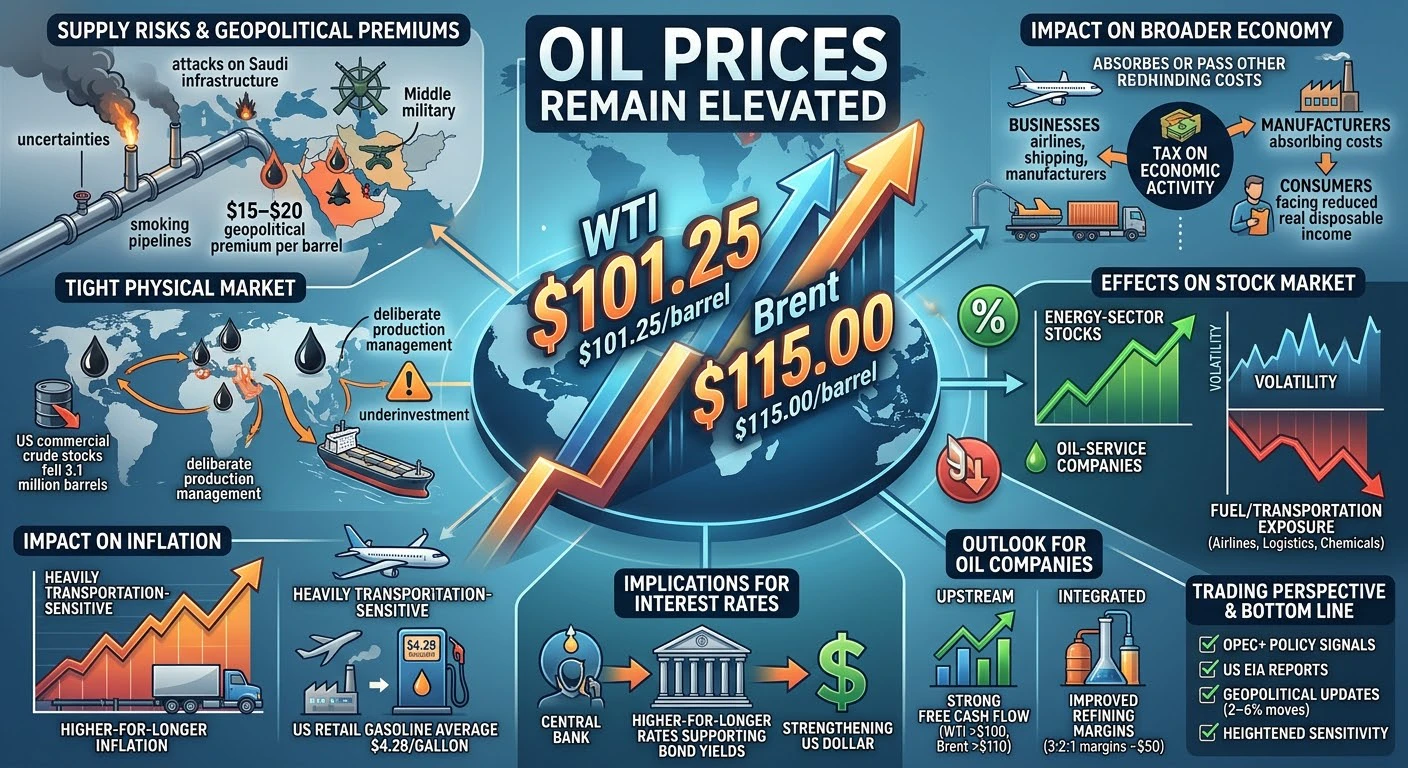
10/15 Gold trade #4: gained 12.1 points, 10,890 oil!
New partner: 12,000 oil; has now reached 104,500 oil!
GLDX+1.46%
PAXG+1.14%
XAU+1.38%
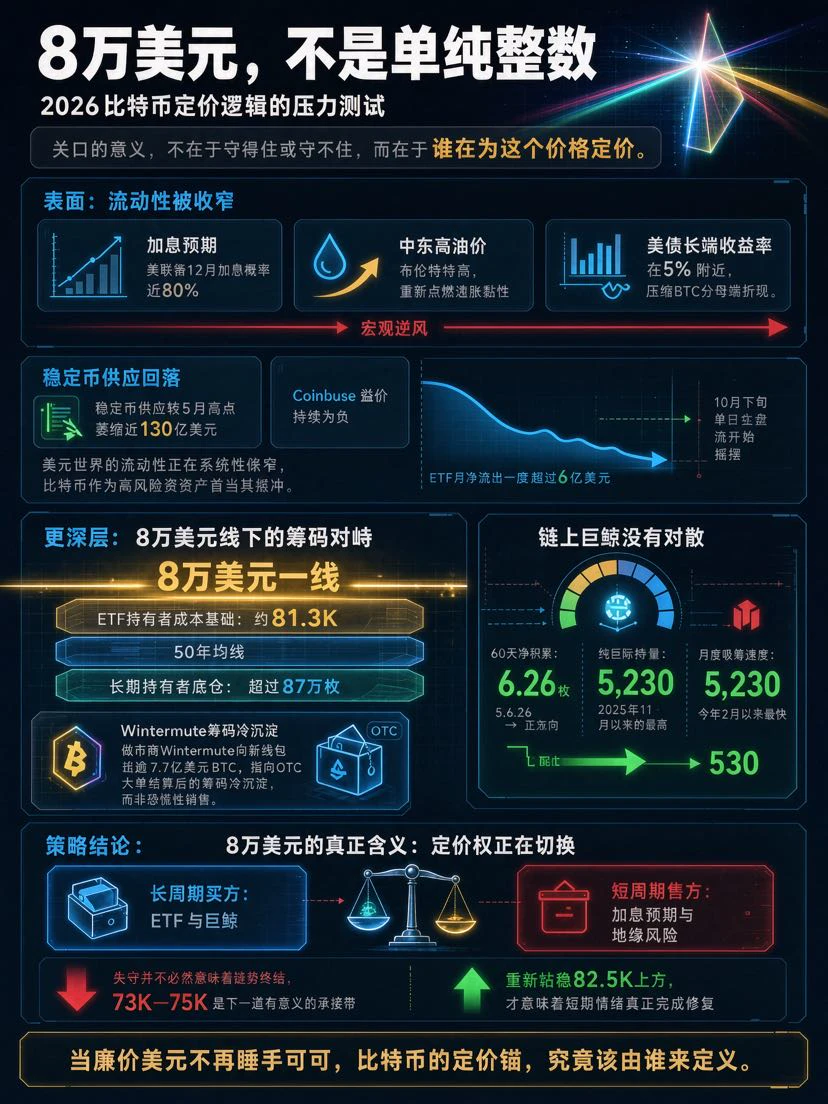
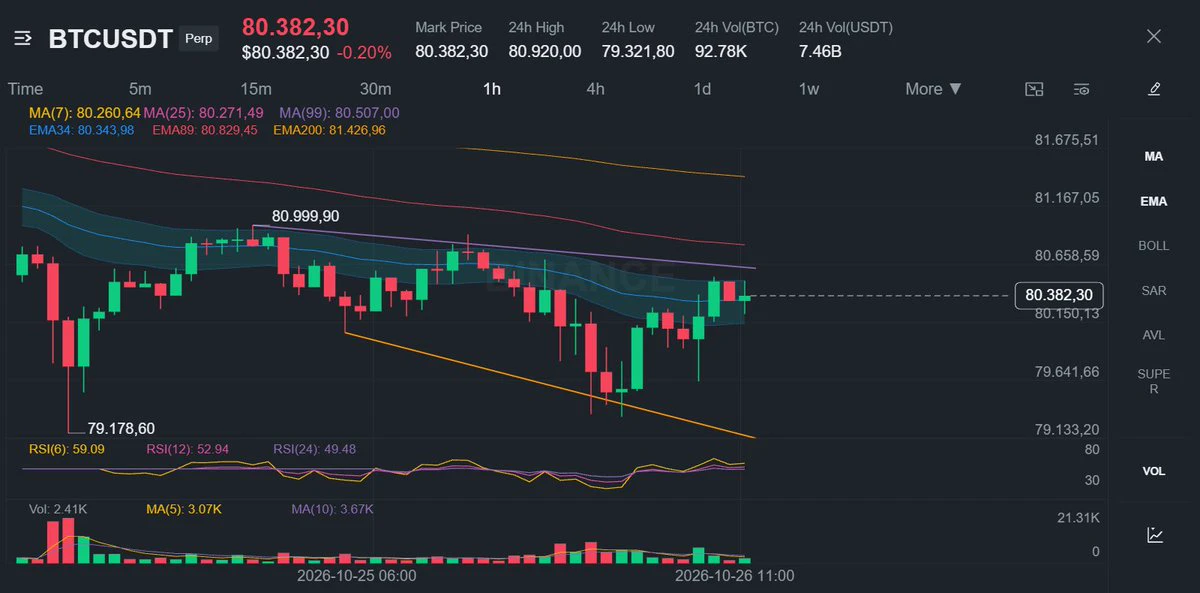
81,000 is BTC's line in the sand—will the PPI keep it there or break it?

After last night's hotter-than-expected CPI, BTC fell from 83,900 to 81,850. The price is now hovering between 81,800 and 82,000.

Why is 81,000 important? Because that is where the 400-day moving average sits. In technical analysis, the 400-day moving average is viewed as the dividing line for the long-term trend. Above it, the long-term trend is bullish; below it, the long-term trend could turn bearish. Historically, every time BTC has retraced to around the 400-day moving average, it has seen a relatively strong reb
BTC-2.45%
Dinner is better than lunch
Two meat dishes and one vegetable dish
Everyone, remember to eat well too!
post-image
The Night PPI Went Off the Charts—When a 6.3% Year-on-Year Surge Tears Open the Illusion That “Inflation Is Dead”
The most dangerous moment for markets is not when bad news is released, but when everyone believes bad news will never come again. The October 15 PPI data delivered exactly that kind of blow.
At 20:30 Beijing time on October 15, the U.S. Bureau of Labor Statistics released the September Producer Price Index. I stared at the numbers on my screen for several seconds—the year-on-year increase was 6.3%. The forecast was 5.3%, and the previous reading was 5.6%. This was not a “slight up
NVDA-3.35%
#每周来晒 #USSeptemberPPIDataRelease
US September PPI data will be released at 20:30 Beijing time tonight (8:30 a.m. ET). This is one of the final major inflation readings before the next Federal Reserve decision window. Below I directly answer the two official questions of this Weekly Share edition and then provide full supporting analysis with as many percentages and data points as possible.
Question 1: Will September PPI exceed or fall short of expectations? Is inflationary pressure on the production side strong?
My clear answer:
I expect September PPI to exceed the consensus slightly or lan
BTC-2.45%
If I could leave $SOXLB just one comment today, it would be: don’t let -19.65% make the decision for you.
What’s really worth discussing is that $SOXLB is oversold, but a confirmed bottom still requires a stabilization. $SOXLB is currently at 100.98, down -19.65% over 24 hours. The 1-hour support is 99.12, resistance is 121.19, and current volume is 0.17 times the average volume of the past 20 candles.
The 1-hour trend is weak, with RSI at 34; the 4-hour trend is weak, with RSI at 24. This combination makes me temporarily accept the following interpretation: I treat oversold conditions only a
post-image
🚨 MARKET UPDATE, INFLATION JUST CHANGED THE GAME.
Today’s U.S. data delivered a clear message: inflation is running hotter than expected while consumer demand remains surprisingly strong.
📊 THE NUMBERS
🔥 Core PPI: +0.7%
Forecast: +0.3% | Previous: +0.2%
🔥 Headline PPI: +1.3%
Forecast: +0.6% | Previous: +0.5%
🛍️ Core Retail Sales: +0.9%
Forecast: +0.6%
🛍️ Retail Sales: +0.8%
Forecast: +0.3%
👷 Unemployment Claims: 199K
Forecast: 199K
🏭 Empire State Manufacturing: 25.5 Forecast: 12.1
🏭 Philly Fed Manufacturing: 20.9 Forecast: 28.2
The takeaway is simple:
Inflation is hot, consumers are s
post-image
XAU+1.38%
BTC-2.45%
ETH-4.48%
BSP unit price surges past $52! The US stock-linked BSP soars 37%—a gap-up in the underlying stock or the contract going solo?
The high-priced BSP jumped 37.90% in a single day to $52.54 (it was only $34.38 on 10/7).
This is a typical tokenized US stock-linked asset. No independent financial-report event was found today. The 38% one-day gain may have resulted from a gap-up in the underlying US stock at the open, or may have been driven by the on-chain perpetual contract’s own order book.
Conclusion: Before trading, be sure to check the underlying US stock’s candlestick chart. If the contract s
post-image
BSP+10.28%
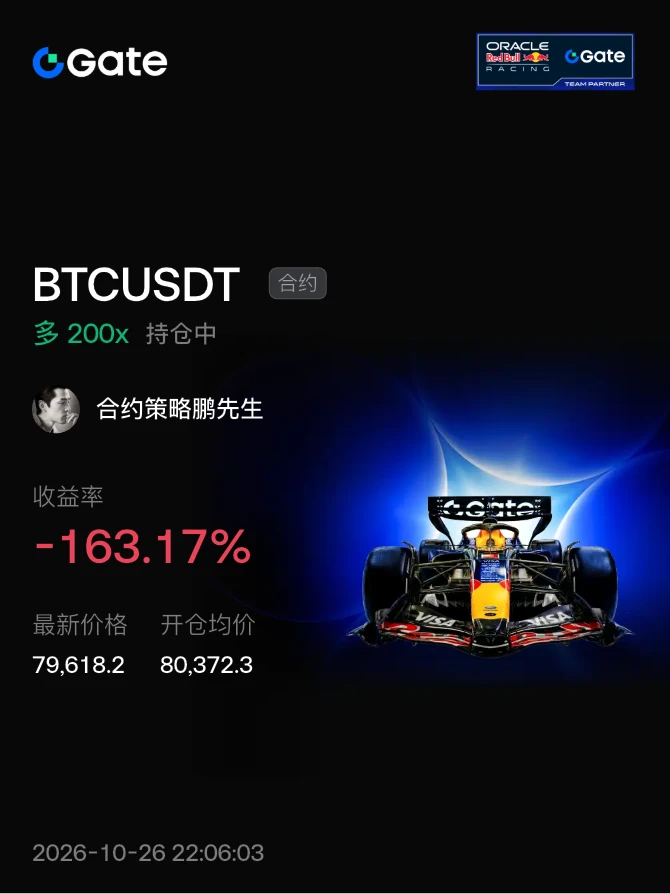
#晒出我的持仓收益 Anyone following me? I’ll take you all to liquidation
post-image
Spending time with your child before bed is most important; lock all accounts.
After posting this, I’m going offline for a day. The global market has been “exciting” enough today, and my heart can barely take it.
Watching your child is better than watching the market; if you really can’t resist, watch a short drama.
When you log back in next week, maybe everything will be fine. Yes, definitely.😊
post-image
🔹Panic Selling Hits South Korean Stocks! KOSPI plunges 7 and SK Hynix crashes 10. Is the global AI
live-cover
LIVE2,437
PPI data - tonight. BTC / ETH Market Updates
live-cover
LIVE3,144
$TRUMP : FROM -98% CRASH TO A POTENTIAL MASSIVE REVERSAL?
I WAS BEARISH SINCE JAN 2025. I called the $60–$70 EXIT zone. After reaching $79, #TRUMP crashed 98.29%. I NEVER told you to buy.
NOW, my SMC analysis shows a bullish flip + CHoCH!
Accumulation Zone: $1.80–$1.46
Targets: $5 → $10 → $20 → $45
SL: HTF close below $1.35
I'm DCAing small quantities gradually. Bullish bias activated!
Leverage: Accordingly | NFA & DYOR
post-image
TRUMP-3.63%
  • 1
U.S. September PPI Data Released
PPI blew out, and not by a little—not just broadly and significantly, but far beyond expectations.
At 20:30 Beijing time on October 15, the U.S. Bureau of Labor Statistics released the September Producer Price Index (PPI) final demand data. The result can be summed up in four words: completely out of control. It rose 6.3% year over year, versus expectations of 5.3% and a previous reading of 5.6%; it rose 1.3% month over month, versus expectations of just 0.5%, marking the largest monthly increase since the Russia-Ukraine conflict broke out in March 2022. Core P
MU-4.83%
Load More

Join 40 M users in our growing community

⚡️ Join 40 M users in the crypto craze discussion

💬 Engage with your favorite top creators

👍 See what interests you

Trending Topics

USSeptemberPPIBeatsExpectations

91.35k Views1.84k Discussing

US September PPI came in at 6.3% YoY, well above the 5.3% market expectation, pointing to renewed producer-side inflation pressure. Weekly jobless claims were 199K, broadly in line with forecasts. Could hotter inflation further reduce room for rate cuts, and what does it mean for $BTC, US stocks, and gold?

DrLinHanSpeaksAtOxfordUnion

135.63k Views1.86k Discussing

JapanAndKoreaStocksPlunge

47.27k Views1.75k Discussing

View More