

Share crypto content and earn up to 60% commissions through content mining.
placeholder
gatefun
On August 25, 2026, $PRL reached a key unlock date. That day, the market faced the concentrated release of nearly 10 million tokens (1% of the total supply), and the enormous selling pressure directly breached market confidence.
From the price action, the price was rapidly pushed to a high of 0.45009 during the opening phase, which is typically an opportunity for the project team or early miners to sell. Subsequently, the massive supply pressure triggered panic selling, sending the price plunging to 0.21862.
With the amplifying effect of 20x leverage, this over 50% actual price drop directly
PRL-3.73%
BTC2.70%
ETH0.81%
View Original
post-image
  • Reward
  • Comment
  • Repost
  • Share
What was said on August 21—that it would reach 80881 as long as it didn't fall below 75028—has already happened. Continue sharing $BTC
BTC2.70%
View Original
post-image
post-image
WaveTheoryStudyWinter
The most important verbal signal from the CFTC advisory meeting: CFTC Chair Selig said he is primarily hoping Congress will pass the CLARITY Act. If the bill remains stalled in the Senate, he has instructed the internal team to begin drafting regulatory rules for the crypto market based on the agency’s existing statutory authority, covering exchanges, leveraged trading, and on-chain protocols, using an administrative rulemaking path to fill regulatory gaps. The Senate vote on the CLARITY Act in mid-September remains a key milestone. $BTC
repost-content-media
  • Reward
  • Comment
  • Repost
  • Share
Both longs and shorts have a chance! A downward wick came in, and I got forced out during this pullback—the chance to enter a long at lower levels is here! $BTC #五大联赛赛前预测官
BTC2.75%
View Original
post-image
post-image
  • Reward
  • Comment
  • Repost
  • Share
The profit is thin, but it grew on its own—I didn’t touch it at all.

During the repeated intraday swings, every time $PRL pushed higher, it was slammed back down, with clear resistance above and heavy selling pressure. I flagged a short entry, got in at 0.33936, and just checked to see it at 0.21859, showing +700.88% unrealized profit. The wait was worth it. This market specializes in humbling all kinds of overconfidence, especially those who think they’re the smartest.

I’ve taken profit on 80% first, leaving 20% to protect the cost and letting it run on its own. Don’t let profits inflate,
PRL-3.73%
BTC2.70%
SOL5.89%
View Original
post-image
  • Reward
  • Comment
  • Repost
  • Share
$INJ DOWN ~95% FROM ATH — WHAT’S NEXT?
$INJ is trading inside a HTF FVG after a ~95% correction, putting price in a key accumulation zone.
Technical view:
✅ Multi-year resistance compression
✅ HTF FVG acting as demand
✅ Rounded base developing
✅ Volatility contraction could precede expansion
Our previous accumulation zone delivered ~170% profit.
If $INJ returns to $5–$3, it could offer another long-term accumulation opportunity.
📈 Macro targets: $80 → $200
⚠️ Invalidation: HTF close below $1.10
2023–24 saw ~46x expansion. History doesn’t repeat perfectly, but the structure is worth watching.
INJ9.52%
  • Reward
  • Comment
  • Repost
  • Share
Layout for Bitcoin, Ethereum, and Dogecoin
gate liveLIVE
1,214
  • Reward
  • 3
  • Repost
  • Share
TalkingAboutMemeAsTheCoinMakes:
Bull market, come back soon 🐂
View More
I love crypto bros😁
post-image
  • Reward
  • Comment
  • Repost
  • Share
The market rewards patience, not panic. 🧠📊
One thing I'm learning from trading is that you don't need to catch every move.
Sometimes the best trade is the one you don't take.
I'm watching market structure, volume and confirmation before entering my next setup. No FOMO. No revenge trading. Just patience and risk management. 🎯
What are you watching this week? 👀👇
#GateSquare #Crypto #Trading #Web3
$ZEC
ZEC2.24%
post-image
  • Reward
  • Comment
  • Repost
  • Share
#ETHBreaks$2500
$ETH has broken above the $2,500 psychological level, and this is more than just another round number. After a powerful recovery, Ethereum is now entering a zone where momentum, profit-taking and breakout confirmation will all compete for control.
Today’s structure is especially important because ETH has already moved aggressively higher. The market is showing strong buyer confidence, but after such a fast rally, I expect the next phase to be more volatile. My focus is therefore on whether ETH can hold the breakout rather than simply how high the next green candle goes.
Curren
post-image
Yusfirah
#ETHBreaks$2500
$ETH has broken above the $2,500 psychological level, and this is more than just another round number. After a powerful recovery, Ethereum is now entering a zone where momentum, profit-taking and breakout confirmation will all compete for control.
Today’s structure is especially important because ETH has already moved aggressively higher. The market is showing strong buyer confidence, but after such a fast rally, I expect the next phase to be more volatile. My focus is therefore on whether ETH can hold the breakout rather than simply how high the next green candle goes.
Current ETH zone: $2,500+
Today’s trading range: approximately $2,425–$2,530
7D performance: approximately +32%
Breakout level: $2,500
Immediate resistance: $2,530–$2,550
Next resistance: $2,650–$2,700
Major resistance: $2,750–$2,800
Psychological target: $3,000
The move from the recent $1,900 area toward $2,500 has changed the short-term market structure significantly. Buyers have repeatedly stepped in at higher prices, while sellers have struggled to create a meaningful reversal. That is a bullish signal, but it also means the market is becoming increasingly sensitive to profit-taking.
My Thoughts
For me, the most important part of this breakout is the $2,500 retest.
A strong market does not necessarily continue straight upward. Sometimes the healthiest move is a breakout, a pullback toward the breakout level, a successful retest and then another expansion higher.
That is exactly what I want to see from ETH.
If $2,500 becomes support, I would expect buyers to challenge $2,530–$2,550 first. A clean break above that area would strengthen the continuation structure and put $2,650 into focus.
Above $2,650, the next major battle would be $2,700. If ETH can hold above $2,700, the $2,750–$2,800 area becomes the next important profit-taking zone.
A sustained breakout above $2,800 would be much more significant because it would bring the psychological $3,000 level into view.
My Trading Plan
I would not chase ETH simply because it has broken $2,500.
My first setup would be a controlled retest around $2,480–$2,500. If buyers defend this zone and ETH starts producing higher lows, I would consider a smaller entry.
The second entry zone I would watch is $2,400–$2,450. A deeper pullback into this area could provide a better risk-to-reward opportunity if the broader bullish structure remains intact.
The momentum setup would be a confirmed break above $2,530–$2,550. If ETH closes strongly above this resistance and then successfully retests it, I would become more confident in continuation toward $2,650–$2,700.
I prefer splitting the position into several entries instead of using the entire allocation at one level. That gives me flexibility if ETH experiences a sudden correction.
I would also avoid excessive leverage because a 5%–8% move against a highly leveraged position can damage the trade even when the overall market eventually moves in the expected direction.
My Targets
$2,500 → breakout support
$2,550 → first continuation confirmation
$2,650 → first major target
$2,700 → major resistance
$2,750–$2,800 → strong profit-taking zone
$3,000 → extended psychological target
At $2,650, I would consider taking partial profits.
Around $2,700, I would protect a larger portion of the position.
Between $2,750 and $2,800, I would become much more aggressive with profit-taking because this area could attract significant selling pressure.
If ETH breaks $2,800 with strong volume and holds above it, I would leave a smaller runner for a potential move toward $3,000.
This approach allows me to participate in the upside without depending on one perfect exit price.
Bullish Scenario
The strongest bullish sequence for me is:
$2,500 holds → $2,550 breaks → $2,650 reaches → $2,700 breaks → $2,750–$2,800 tested → $3,000 becomes the extended target.
The key confirmation would be higher lows after every pullback.
If ETH breaks $2,550 and immediately falls back below it, I would not consider the breakout fully confirmed.
If ETH breaks $2,650 and turns that level into support, the structure becomes much stronger.
A sustained move above $2,700 would make me significantly more confident that the market is preparing for another major upside leg.
Above $2,800, the psychology changes again because traders who were waiting for a deeper pullback may start chasing the momentum.
Bearish Scenario
The biggest risk is a false breakout above $2,500.
If ETH fails to hold $2,500 and drops back below $2,450, I would become cautious.
A move below $2,400 would increase the probability of a deeper correction toward $2,300–$2,350.
If $2,300 fails, I would watch $2,200–$2,250 as the next major support region.
I would not automatically treat every correction as a buying opportunity. The size and speed of the decline matter.
A controlled pullback with declining selling volume can be healthy.
A breakdown supported by heavy volume and repeated lower highs is a completely different situation.
Coming Days Outlook
My expectation for the coming days remains bullish, but I expect the market to become less smooth after such a strong rally.
The first important zone is $2,500–$2,550.
If ETH holds above $2,500 and breaks $2,550, the next upside area I would watch is $2,650.
A move through $2,650 could push the market toward $2,700.
Above $2,700, the $2,750–$2,800 zone becomes increasingly important.
If ETH establishes strong support above $2,800, I would start looking toward $3,000 as the next major psychological target.
However, I would not be surprised by a short-term pullback before these levels are reached. ETH has already produced a very strong weekly move, and traders who bought lower have a clear reason to secure profits.
That does not automatically make the market bearish.
Sometimes profit-taking is exactly what allows a strong market to build the next support level.
My Opinion
I remain bullish on ETH while the market holds the $2,450–$2,500 region.
My bias becomes stronger above $2,550.
Above $2,650, the continuation structure becomes more convincing.
Above $2,700, I would expect the market to challenge $2,750–$2,800.
Above $2,800, $3,000 becomes a realistic extended objective.
Below $2,450, I would become cautious.
Below $2,400, I would expect a deeper correction.
Below $2,300, I would reassess the entire short-term bullish structure.
The most important thing for me is that I do not want to confuse momentum with certainty.
ETH can be extremely bullish and still experience a sudden 4%–7% pullback.
That is why my strategy is based on levels rather than emotions.
If ETH gives a $2,500 retest and buyers defend it, I want to participate.
If ETH breaks $2,550 and confirms the breakout, I want to participate.
If ETH reaches $2,650–$2,700, I want to start securing profits.
If ETH approaches $2,750–$2,800, I want to protect a significant portion of the position.
If ETH breaks $2,800 strongly, I want a smaller position available for the potential $3,000 move.
The market does not need to move perfectly for this plan to work.
My biggest focus is risk-to-reward.
Buying directly after a vertical move gives me less room for error.
Waiting for confirmation or a retest gives me a clearer invalidation level.
That difference matters.
ETH has now entered a major decision zone. The $2,500 breakout has opened the door, but buyers still need to prove that they can defend this level.
If they succeed, the progression toward $2,550 → $2,650 → $2,700 becomes increasingly attractive.
If momentum continues beyond $2,700, $2,750–$2,800 becomes the next major battlefield.
And if ETH can finally establish support above $2,800, the psychological $3,000 target will become much harder for the market to ignore.
My final view is bullish, but disciplined.
I am not chasing the candle.
I am watching the retest.
I am protecting profits into resistance.
I am adding only when the market confirms strength.
And I am keeping capital available in case ETH gives the pullback that everyone is waiting for.
$2,500 is the breakout.
$2,550 is the confirmation.
$2,650 is the next target.
$2,700 is the major battle.
$2,750–$2,800 is the profit zone.
$3,000 is the extended objective.
The next few sessions will tell us whether $2,500 becomes the foundation for Ethereum’s next major move or simply another level that sellers manage to reject.
repost-content-media
  • Reward
  • 3
  • Repost
  • Share
ybaser:
LFG 🔥
View More
Tether has abandoned an estimated $120 million Bitcoin mining project in Uruguay after a dispute with state utility UTE over electricity usage brought the operation to a halt.
The conflict centered on power limits. Microfin reportedly viewed the agreed electricity level as a minimum that could increase, while UTE treated it as a fixed cap. After electricity bills went unpaid in 2025, UTE disconnected both mining sites on July 25.
Tether later told authorities it would shut down the operations and lay off most staff.
The setback is notable because Uruguay was reportedly planned as the first ste
BTC2.75%
ETH0.82%
SOL5.90%
post-image
  • Reward
  • Comment
  • Repost
  • Share
Only after starting work did I realize that normal people are a minority.
If I’m lucky enough to earn enough to retire, I’ll definitely be kind to everyone, smile at everyone I meet, and be generous.
View Original
post-image
  • Reward
  • Comment
  • Repost
  • Share
Stablecoin issuer Circle minted 250 million USDC twice on the Solana blockchain just now, at 17:28 and 17:39, respectively, for a total of 500 million USDC.
USDC0.00%
View Original
post-image
  • Reward
  • Comment
  • Repost
  • Share
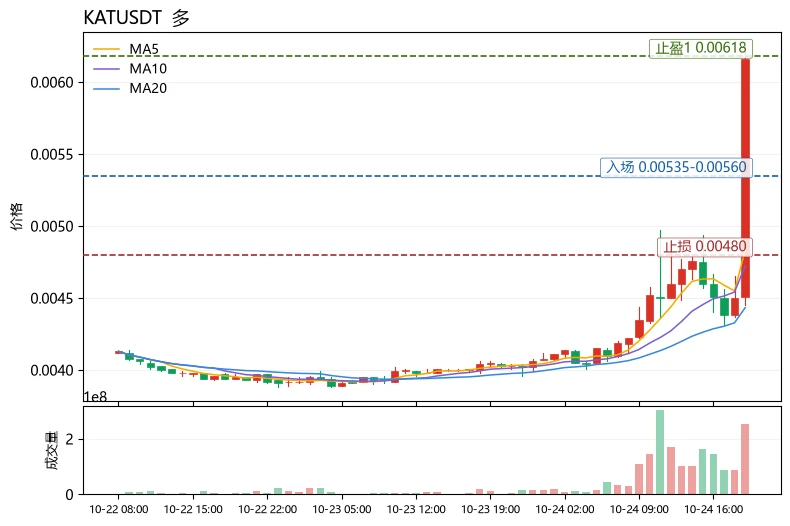
$TAC Signal】Long + 4H MACD expansion + buy-side depth dominance
$TAC Current price 0.00237, the 4H MACD histogram is widening, buy-side depth imbalance is 2.48%, and bids below are strong. Funding rate is 0.039%, OI is stable, and the 1H RSI at 58 is not overbought. 0.0023463 is the long/short dividing line.
🎯Direction: Long
⚡Entry/Limit order: 0.0023629 - 0.0023700
🛑Stop-loss: 0.0023463
🚀Target 1: 0.0024056
🚀Target 2: 0.0024233
🛡️Trade management: Reduce the position by 50% at Target 1 and move the stop-loss up to breakeven. Exit if the price falls back to the entry level.
Depth rational
TAC40.62%
BTC2.75%
ETH0.82%
SOL5.90%
ALIGN-5.48%
View Original
post-image
  • Reward
  • Comment
  • Repost
  • Share
#ETHBreaks$2500 Ethereum has reclaimed the critical two thousand five hundred dollar level with decisive force. On this Tuesday in late August 2026 the second largest cryptocurrency by market capitalization is trading firmly above the psychological barrier, with intraday highs stretching toward two thousand five hundred thirty dollars. This marks a powerful recovery after weeks of consolidation below two thousand dollars and represents one of the strongest weekly advances Ethereum has delivered in 2026.
The scale of the move is striking. Just seven days earlier Ethereum was hovering near one t
ETH0.82%
BTC2.75%
post-image
  • Reward
  • 2
  • Repost
  • Share
LittleGodOfWealthPlutus:
Wishing you prosperity and good fortune! 😘
View More
Is STX about to make a move tonight? I’ve been watching the 0.2698 level for three days. In 24 hours, it surged straight from 0.2216 to 0.2893, a 16% swing, with 87M in trading volume—all real money driving the move. This isn’t an ordinary rebound; funds are scrambling to build positions.
I’m not going to talk technicals with you. I’ll ask just one thing: if BTC holds steady tonight, how will a closely correlated coin like STX move? I’m betting it goes straight to 0.30. The 0.2893 high just now wasn’t the top—it was a test. Look at how buyers stepped in when it pulled back to 0.2698. Such heal
STX12.31%
BTC2.75%
View Original
post-image
post-image
post-image
  • Reward
  • Comment
  • Repost
  • Share
Live trading - Analysis crypto market
gate liveLIVE
2,753
live-coin
  • Reward
  • Comment
  • Repost
  • Share
$DGAI Exploding on Launch Momentum 🚀
DGAI is trading around $0.72 – $0.74, after spiking as high as $0.84 – $2.08 in the last 24 hours on heavy volume.
Technical Snapshot:
• Support: $0.60 – $0.65
• Stronger support: $0.45 – $0.50
• Resistance: $0.80 – $0.85
• Momentum: Extremely strong after the vertical post-TGE move
The Setup:
DGrid AI (DGAI) is a newly launched decentralized AI inference token that has delivered one of the strongest debut pumps of the week. Price rocketed from the $0.05–$0.10 zone to multi-dollar highs at points before consolidating. The AI narrative + fresh listing + cro
DGAI182.75%
post-image
post-image
  • Reward
  • Comment
  • Repost
  • Share
2016-2026 Ten years 😂
At 185 cm, I must have weighed only a little over 60 kg back then; now I weigh 82 kg.
View Original
post-image
post-image
  • Reward
  • Comment
  • Repost
  • Share
【$STAR Signal】Go long on 1H Bollinger Band breakout + elevated funding rate
$STAR The 1H Bollinger Bands are widening, with the price touching the upper band at 0.1537 and RSI at 74.66, approaching overbought territory. The MACD histograms on both timeframes are expanding synchronously, and 4H momentum is still being released. The order book buy/sell depth ratio is 0.82, with sell orders slightly heavier. The funding rate is elevated at 0.1012%, indicating crowded leveraged longs. After touching 0.15884, the price pulled back, with support emerging around 0.15011.
🎯 Direction: Long
⚡ Entry/
BTC2.75%
ETH0.82%
SOL5.90%
ALIGN-5.48%
View Original
post-image
  • Reward
  • Comment
  • Repost
  • Share
Load More

Join 40 M users in our growing community

⚡️ Join 40 M users in the crypto craze discussion
💬 Engage with your favorite top creators
👍 See what interests you
  • Pinned