Share your thoughts
placeholder
Article
Everyone’s cheering SOL at 103.75, but the 4h tape just whispered a secret—are you listening?

$SOL /USDT - SHORT

Trade Plan:
Entry: 103.61 – 103.89
SL: 105.14
TP1: 102.71
TP2: 102.01
TP3: 100.97

Why this setup?
Why now?
- RSI on the 15m is overheated at 66.31 while price hugs resistance—classic exhaustion fuel for a short.
- ATR (0.58) is tight, but TP2 at 102.01 offers a 1.6% drop before the daily range floor.
- Trend is *range*, not bull—mean reversion is the edge, not breakout chasing.
- Confidence 55 is low, but the invalidation at 102.34 keeps risk defined: 1.3% to stop vs 1
SOL+2.84%
Why is everyone ignoring LINK/USDT’s 95% confidence squeeze right now?

LINK/USDT - LONG

Trade Plan:
Entry: 11.894 – 11.936
SL: 11.711
TP1: 12.068
TP2: 12.171
TP3: 12.324

Why this setup?
- 4h bias LONG (95%) + 1D trend bullish = stacked timeframe alignment.
- RSI 15m at 62.45—momentum hot, not overbought—room to run.
- Entry at 11.915, TP1 12.068, TP2 12.171. ATR 1h (0.085) shows tight risk: SL 11.711 is only ~1.7% away.
- Why now? The “Armed” status means the trigger is set—waiting for a 1h close above 11.936 to ignite the move.

Debate:
Are you fading this 95% long or loading bef
$XAN is surging rapidly and beginning to move away from the main force's cost basis. Everyone follow the momentum and enter long positions—it’s about to take off.
post-image
XAN+18.37%
  • 1
$FLOCK Long Signal】Negative Funding Short Squeeze + Order Book Bid Support
$FLOCK Negative funding remains at -0.0616%, with short position costs continuing to accumulate. The 1H MACD histogram narrowed to -0.0001, while the 4H MACD bullish histogram remains at 0.0012. The order book bid depth ratio is 1.21, with a depth imbalance of 9.61%; selling pressure is continuously absorbed. The current price of 0.05565 is close to the 1H Bollinger upper band at 0.0569.
🎯Direction: Long
⚡Entry/Limit Order: The current price of 0.05565 is within the recommended range of 0.0554830 - 0.0556500; enter di
post-image
FLOCK-9.55%
BTC update
live-cover
LIVE1,827
MARKET ALERT - PONS/USDT
5-minute and 15-minute analysis & trading opportunities.
​15-Minute Timeframe Analysis
The medium-term trend structure is very solid. After reaching a peak of 0,9636, the price corrected to around 0,9080 and bounced back up (rebounded) just above the EMA 20 (0,9046). This formed a higher low, indicating that buying momentum remains strong.
​5-Minute Timeframe Analysis
On the 5-minute chart, price movement confirms a recovery phase (momentum scalping). The price has just broken above the EMA 20 (0,9222) and is moving up toward the nearest resistance at 0,9636.
​Trading
PONS+29.11%
BTC+0.83%
ETH+1.36%
  • 4
  • 1
MARKET ALERT - DOGE/USDT
analysis and trading opportunities
The DOGE/USDT trend structure on both timeframes currently shows fairly strong bullish momentum, as the price is above the EMA 20, EMA 50, and EMA 200 lines.
​15-Minute Timeframe Analysis
The short-term trend is in a strong uptrend phase. The price is moving consistently above EMA 20 (0,08738) and has just broken through the local resistance area at 0,08852. The EMA arrangement (EMA20 > EMA50 > EMA200) confirms that buying pressure remains dominant.
​1-Hour Timeframe Analysis
The price is attempting to form a recovery after the previo
DOGE+6.86%
BTC+0.83%
ETH+1.36%
  • 5
  • 2
.@world_xyz airdrop?!?!?!?!?
post-image
AIRDROP-3.86%
#Gate60MillionUsers
My first Gate trade still makes me laugh 😂
I remember staring at the chart like I had everything figured out. I saw a move, got excited, and entered without giving much thought to risk.
For a few minutes, everything looked perfect.
Then the market moved against me.
I kept staring at the screen thinking, “It’ll come back.”
Spoiler: it didn’t. 😂
That tiny trade taught me something I still remember today: the market doesn’t care how confident you feel.
Looking back, losing that trade wasn’t the worst part. The funny part was how seriously I thought I knew what I was doing.
post-image
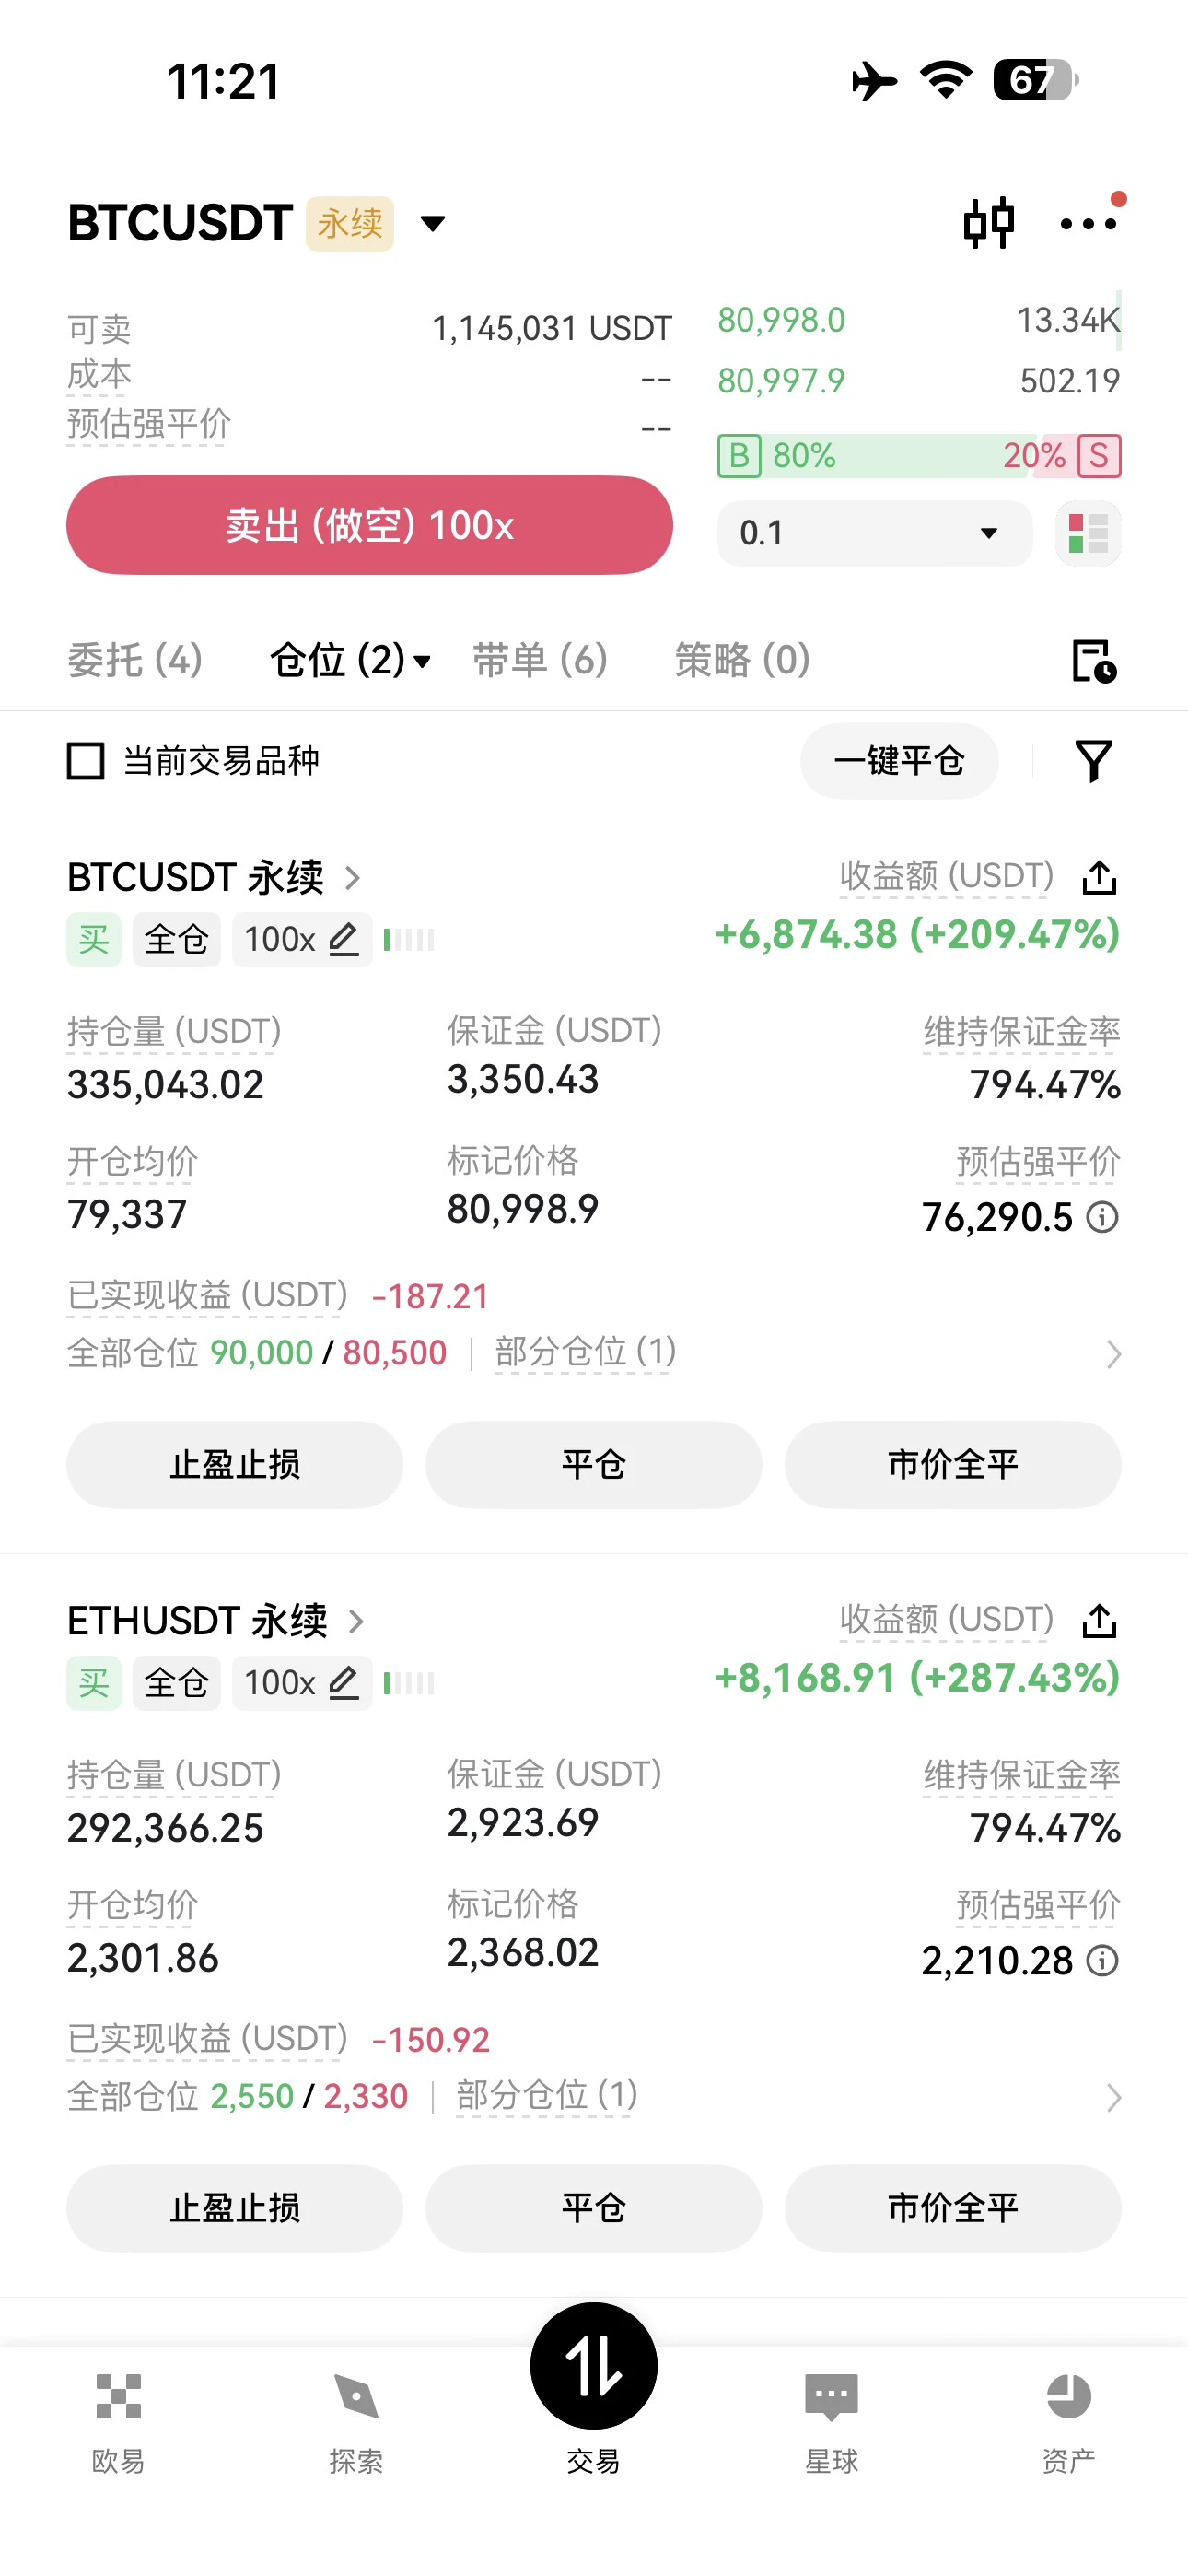
Reduce the position at 80; target 2,500. A breakout would be enough.
post-image
I didn’t even expect to break even, but it directly put me in profit. This service is seriously on point.

When the screen was glowing green, $USELESS was actually the one I wanted to watch most: it was building a base without breaking down, while funds were still trickling in. Details like that don’t lie. The long position around 0.06822 was opened then.

Now 0.3116 has already broken out, with an unrealized profit of +17209.38%. Nailing the timing feels so damn good.

Still, I’m taking 80% off the table first and protecting the remaining 20% at the entry price. I’ll hold as long as the t
post-image
USELESS+20.79%
BTC+0.83%
SNDK+2.91%
$USDT anyone saw like this chart 1.7 for usdt price today?
#usdt
post-image
USDT0.00%
czs-dog:native breaking out like $4
Cz related BNB chain meme
Yesterday gave $4 up 190%
Next $Broccoli714
Buy low and have patience ❤️
post-image
BNB+8.46%
MEME+6.03%
$PI Gate.io, fuck your mother, I’m not satisfied with the comments section. It should allow everyone to speak freely!?
post-image
PI+1.42%
The privacy sector all moved today, but it has shifted from broad-based gains to divergence.
ZEC 1,027 (weekly +23.98%, MACD above the zero line, trend phase)
DASH 68.16 (+9.02%, volume 11.2x average)
LTC 54.70 (+7.7%, following the rally)
ZEN 7.085 (−0.7%, the only one to close down)
DASH touched a high of 74.63 before falling back to 68.16, with the upper wick accounting for half of the day's range. 11x volume combined with a long upper wick = high-level turnover, not a breakout.
$ZEC $DASH
post-image
ZEC+3.21%
DASH+21.40%
LTC+9.08%
ZEN0.00%
What position will #4 get? I have no idea.
post-image
#Gate事件合约晒单挑战
PONS IS MAKING NOISE
Pons is suddenly one of the most watched launchpad stories on Robinhood Chain. The latest GateNews data shows Pons generated $1.84M in 24-hour revenue, surpassing Pump.fun’s $1.18M. That is a major signal because revenue reflects actual activity flowing through the platform rather than price movement alone.
THE NUMBERS MATTER
Pons generated roughly $660K more revenue than Pump.fun during the reported 24-hour period, meaning Pons was ahead by about 56% on that comparison. This puts the focus directly on activity, users and transaction flow around Robinhood Ch
post-image
PONS+29.37%
PUMP-4.58%
Everyone’s long XRP at 1.42, but the 15-minute RSI just screamed 72—who’s the exit liquidity?

$XRP /USDT - SHORT

Trade Plan:
Entry: 1.4192 – 1.4238
SL: 1.4432
TP1: 1.4052
TP2: 1.3944
TP3: 1.3781

Why this setup?
XRP is stalling inside a 1D range, and the 4h signal flips SHORT at 1.4215.
- RSI (15m) at 72.61 = overheated, ripe for a snap-back.
- ATR (1h) is razor-thin (0.009) → volatility is coiling; the first push often fails.
- Entry zone 1.4192–1.4238 is a magnet, but TP1 at 1.4052 offers a 1.1% scalp *before* the daily trend decides.
Why now? The clock says 18:14 UTC—liquidity
XRP+2.09%
[Nre Streamer] Market Prediction
live-cover
LIVE1,806
JUST IN: Anthropic's Claude produced the first computer-checked formalization of Fermat's Last Theorem in Lean, closing a problem that stood for 350 years.
  • 2
Load More

Join 40 M users in our growing community

⚡️ Join 40 M users in the crypto craze discussion

💬 Engage with your favorite top creators

👍 See what interests you

View More