Square
Following
Hot
News
Profile
Share your thoughts
placeholder
Article
$TRX TRX at End of Multi-Year Correction, Could go to $55+
TRX has spent months in an extremely tight range within what I’m counting as wave-e of E. My volatility-compression indicator is showing extreme, persistent readings, with the current stretch approaching its historical duration record.
I’ve labeled the potential 2018–2026 correction as a triangle, although other interpretations remain possible. The more immediate focus is the contracting structure developing from the 2024 high. If this triangle is completing, the count favors an upward thrust.
The bigger question is what that triangle
post-image
TRX+1.37%
#USSeptemberPPIBeatsExpectations Wholesale Inflation Surges, and Energy Is the Main Driver
Producer prices in the United States rose far more than analysts expected in September 2026, and the report is drawing attention from traders, businesses and policymakers.
The headline numbers
The Producer Price Index (PPI) rose 1.3% month over month, more than double the roughly 0.6% increase economists anticipated. The Bureau of Labor Statistics said this was the largest monthly advance since March 2022. The prior months were smaller: 0.5% in August and 0.2% in July.
On an annual basis, the index rose
Falcon_Official
#每周来晒 #USSeptemberPPIReleased
#ShareWeekly Producer Inflation Meets a $80K Bitcoin Test: Can the Fed Afford to Ease?
Bitcoin is entering September’s U.S. Producer Price Index release with a difficult macroeconomic backdrop. The key question is whether wholesale inflation confirms the price pressures already visible in consumer data or offers the Federal Reserve some room to reconsider its policy path.
Economists are forecasting a 0.6% monthly increase in headline PPI for September, compared with 0.4% in August. Core PPI, excluding food and energy, is expected to rise 0.3%, up from 0.2%. The annual headline rate is forecast at 5.5%, compared with 5.4% previously. These are expectations, not confirmed results; the actual figures must determine whether producer inflation has surprised markets.
The starting point is already uncomfortable for policymakers. September CPI rose 0.6% month-on-month and 3.7% year-on-year, while core CPI increased 0.3% monthly and 2.6% annually. Gasoline prices climbed 9.1% during the month, adding to headline inflation pressure. If producer prices also exceed expectations, markets may worry that higher business costs could feed into consumer prices and make a near-term shift toward easier monetary policy more difficult.
The composition of PPI will matter as much as the headline. A surge concentrated in energy or goods could signal a different inflation problem from persistent increases in services. Investors should watch final-demand goods and services, energy-related components, transportation and trade services, alongside any revisions to earlier readings. A softer headline accompanied by stubborn core services would not necessarily deliver a clean bullish signal.
Bitcoin’s sensitivity to interest-rate expectations is already visible in the current market backdrop. On October 15, Barron's reported BTC at $80,743, down 1.2%, after an overnight low of $80,247, as hotter consumer inflation strengthened rate-hike concerns. These are reported market levels, not a verified PPI-release reaction.
Three scenarios now matter. If headline and core PPI both come in below forecasts, Treasury yields and the dollar could face downward pressure, potentially improving conditions for BTC and other risk assets. If both exceed expectations, renewed rate-hike concerns could strengthen the dollar and weigh on crypto. A mixed report may leave markets focused on core services, revisions and whether the increase is broad-based.
The confirmation test is the cross-market response: BTC’s price and volume after publication, the U.S. dollar index, Treasury yields and Nasdaq futures. A brief Bitcoin bounce alone would not establish a lasting trend; sustained movement alongside rates and the dollar would provide stronger evidence of a macro-driven repricing.
The central issue is not whether one inflation report automatically makes Bitcoin bullish or bearish. It is whether producer-price pressure changes the expected path of monetary policy and whether traders have already priced that risk into BTC.
Will September PPI reinforce the case for tighter U.S. monetary policy, or give Bitcoin room to recover? The actual release and the market’s reaction not the forecast alone will decide which signal carries more weight.
repost-content-media
GAS+3.37%
FUEL-2.89%
EURUSD-0.49%
  • 2
Every $SNEK counts 🐍
post-image
SNEK-0.21%
Brothers with longs opened above 1320, I’ve learned my liquidation lesson—now it’s your turn to get out at breakeven!
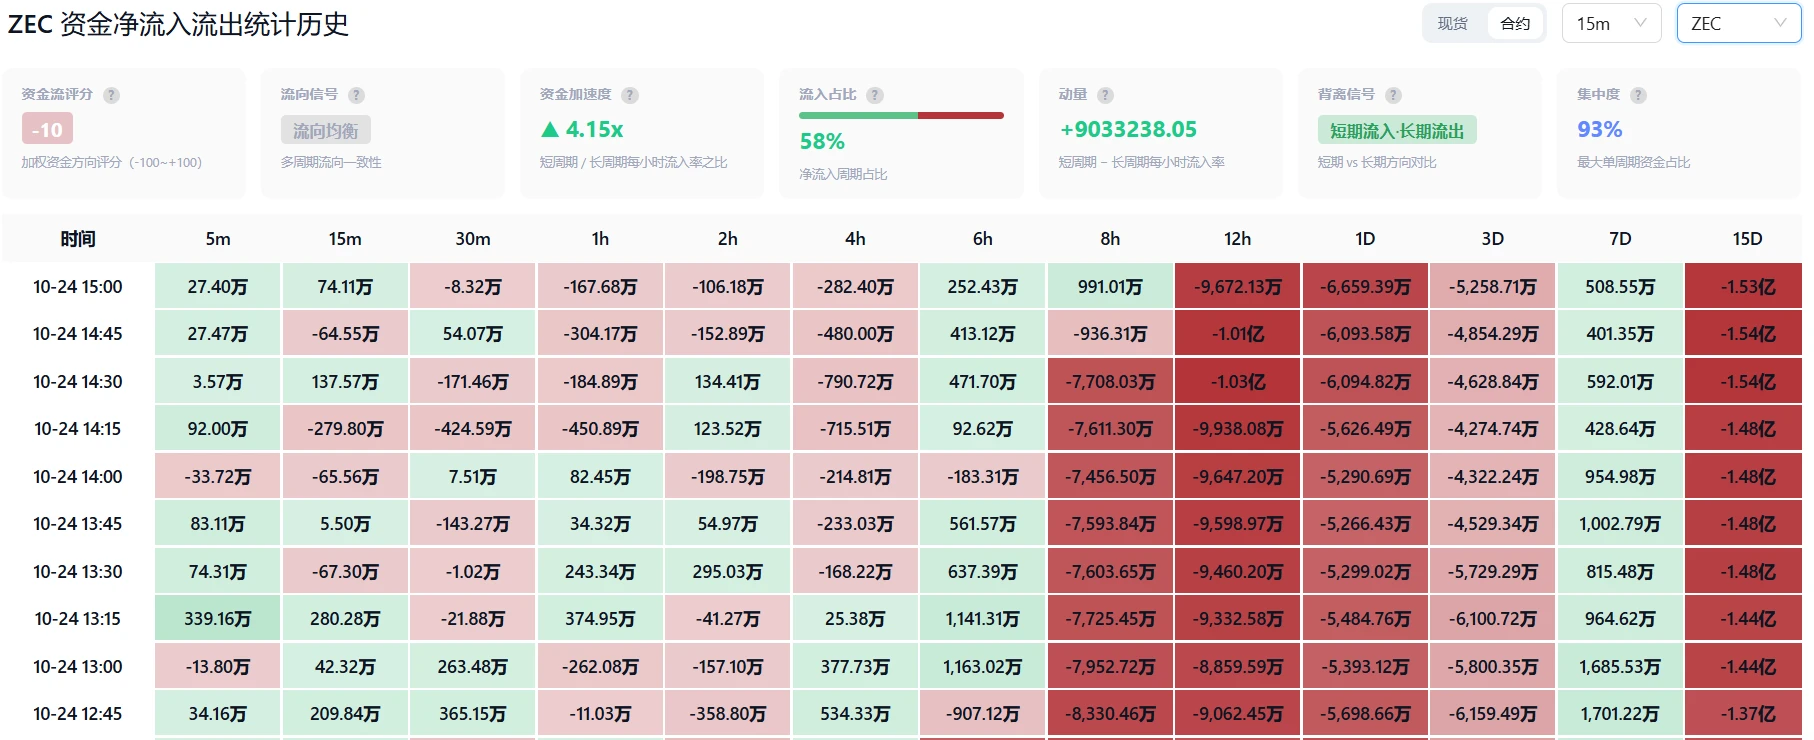
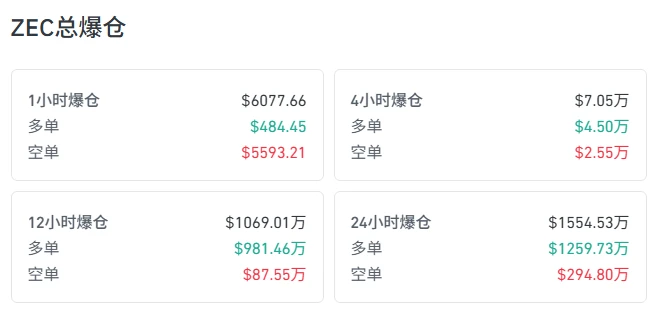
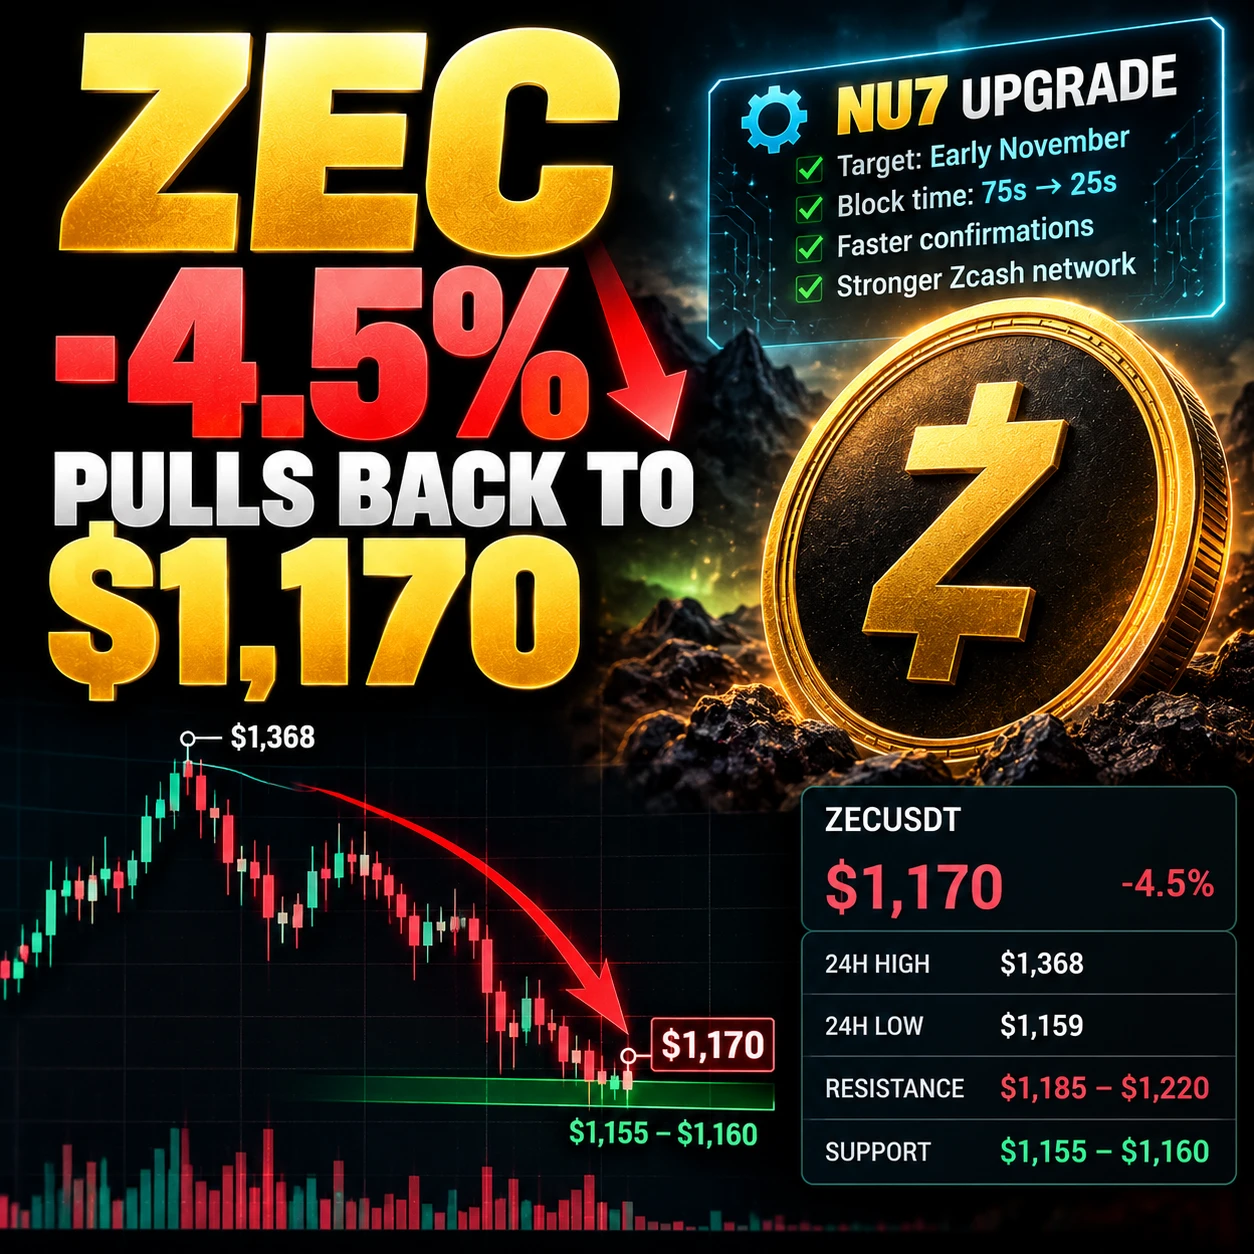
Last night, ZEC plunged from 1348 to 1070, with over $20 million liquidated across the market, 88% of it from opening long positions. Even more outrageous, the ZEC spot ETF saw a net outflow of $14.76 million that day. This wasn’t a shakeout—it was a “people washout.” Why the crash? Not because of the NU7 upgrade, and certainly not because the fundamentals collapsed. The real reason is that it had risen too much—from $197 in March to $1,700 by the end of September, nearly an 8x
post-image
ZEC+10.24%
$XRP XRPUSDT: Price Downside within Channel, Bears Strong
XRP remains locked inside a clear descending channel, and the broader structure still favors sellers. Price is trading around 1.33, below both H4 EMAs near 1.36 and 1.41, which means the recent bounce has not yet changed the trend.
The Setup
The main resistance area is roughly 1.35–1.40. This zone combines previous structure, the fast EMA and the upper half of the descending channel.
If XRP rebounds into this area but fails to establish acceptance above it, I would treat the move as a corrective retest rather than a real reversal. Anoth
post-image
XRP+2.14%
[New Streamer] Market Prediction
live-cover
LIVE1,878
Today's gold: KPI two deals completed, making money is as easy as drinking water! ✊🏻✊🏻✊🏻
GLDX+0.43%
PAXG+0.46%
$AAVE
Grinding down from 159, with holdings reduced by 5% over the week. Longs are capitulating in a long squeeze, and the funding rate is still negative. 😏 159.9 is capping it; any rebound is an opportunity to escape. Don’t wait until it crashes through 157 to run, or it’ll be too late.
post-image
AAVE+5.27%
solana:6sEf597zqUxoJeW1znjtx8MUPsXFFF7zjjH2KSG8zF9y
6sEf597zqUxoJeW1znjtx8MUPsXFFF7zjjH2KSG8zF9y
Potential to go 80%
#crypto $sol
SOL+2.86%
market updates on today $BTC & $XAU
live-cover
LIVE1,759
#美国9月PPI大超预期
The overall market is in a state of inching upward today. Yesterday’s wick scared quite a few people into a cold sweat, with Bitcoin at one point crashing below $80,000. Thankfully, everyone managed to buy it back up, and it is now hovering around $82,000. It has risen, but it still feels somewhat shaky.
The macro hand is still gripping the market by the throat. CPI and PPI both came in above expectations in succession. Although the probability of a rate hike has fallen from 49%, the market is still on edge. $929 million in leveraged positions were liquidated, including $777 mill
post-image
BTC+1.15%
  • 8
They sleep while you build wealth
post-image
$MU Last night’s pullback was not too deep. If it moves up again, watch the 4-hour OB955 for a pullback; shorts can be considered here. The 875–882 area below can be used for a rebound. The current 15-minute chart is converging, so just see which direction the convergence chooses during the day. If you don’t know how to identify stop-loss levels, watch Section Chief’s ICT Tutorial Episode 03: Market Structure!
post-image
MU+1.93%
Not only does it fly, this car goes from 0 to 96 km/h in 0.81 seconds 🤯
This morning’s ETH outlook
Operation:
Short around 2450-2470
First target: 2430-2400
Second target: 2380-2350
Set a stop-loss
After a sharp drop, ETH has rebounded slightly and is currently fluctuating below the middle band. The MACD has formed a death cross, but the green bars are beginning to shorten, showing signs of weakening bearish momentum. The RSI has returned to the neutral zone. Overall, the market remains range-bound, so there is no need to stubbornly stick to one direction—adjust flexibly. ETH’s rebound is weak and it cannot even reach the middle band. ETH is more volatile, and whe
post-image
ETH+2.95%
#韩股大跌你会抄底吗
South Korean Stocks Are Plunging — Would You Buy the Dip?
The South Korean stock market is facing renewed selling pressure, raising an important question for investors: Is this the right time to buy the dip, or is it better to wait for more stability?
Why Is the Market Falling?
A sharp decline in South Korean equities can reflect several factors, including global economic uncertainty, changing interest-rate expectations, profit-taking, and weakness in technology and semiconductor stocks. Since South Korea's market has significant exposure to global technology demand, movements in
post-image
Starlink | October 16, 2026 ETH Outlook
Direction: Short-term rebound recovery; prioritize waiting for a pullback to go long, and do not chase highs.
Entry to watch: 240–240
First target: 2460
Second target: 2480–2500
Defensive reference: Below 2380
ETH remained relatively weak over the past few days, with the lows continuously moving lower. After a clear rebound near 2313, it finally staged a strong rally last night.
However, after rebounding to around 2460, the price began to pull back again.
Therefore, today we cannot simply chase longs just because of last night's strong rally.
Next, focus
post-image
ETH+3.29%
BTC+1.15%
SOL+2.86%
I’ve turned off the gainers and losers ranking for $ZRO for now, and what remains on the chart is actually just one question: $ZRO’s strength is still intact, but the crowding is already plain to see.
$ZRO is currently at 2.177, up 14.28% in 24 hours. The 1-hour support is 1.8, resistance is 2.208, and current volume is 0.72 times the average volume of the past 20 candles.
My view for now is this: I acknowledge that the trend is strong, but what matters next is not how much higher it can surge, but whether buyers step in during the first pullback. To the upside, merely touching 2.208 does not
post-image
ZRO+16.17%
Nice, nice—the BSC one is starting to take off too.
$FTR #特斯拉能飞
post-image
TSLAG+3.06%
TSLAON+3.10%
TSLAX+3.22%
October 16 market analysis, strategy sharing, main theme
Large funds: dollar-cost averaging, medium- to long-term, bullish
Small funds: sell high and buy low
Long the ETH/BTC exchange rate
Chart-based strategy is a personal recommendation for reference only#美国9月PPI大超预期
ETH+3.29%
BTC+1.15%
Load More

Join 40 M users in our growing community

⚡️ Join 40 M users in the crypto craze discussion

💬 Engage with your favorite top creators

👍 See what interests you

Trending Topics

USSeptemberPPIBeatsExpectations

91.35k Views1.9k Discussing

US September PPI came in at 6.3% YoY, well above the 5.3% market expectation, pointing to renewed producer-side inflation pressure. Weekly jobless claims were 199K, broadly in line with forecasts. Could hotter inflation further reduce room for rate cuts, and what does it mean for $BTC, US stocks, and gold?

GateWCTCS9GlobalTradingCompetition

37.87k Views6.41k Discussing

WarshIMFSpeech

62.4k Views748 Discussing

View More