Share your thoughts
placeholder
Article
10x Leverage vs Spot - Best for Beginners
live-cover
LIVE14
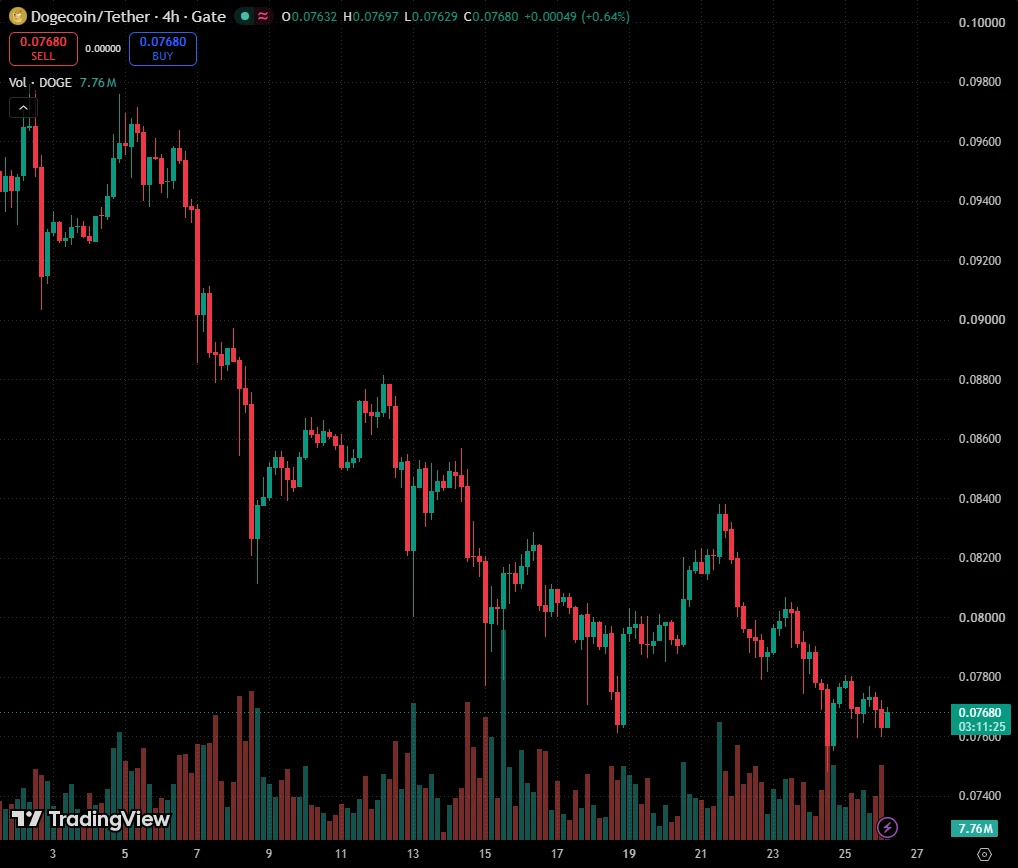
Everyone chasing the bounce while DOGE quietly sets up for another drop.

$DOGE /USDT - SHORT

Trade Plan:
Entry: 0.08426 – 0.08484
SL: 0.08730
TP1: 0.08249
TP2: 0.08111
TP3: 0.07904

Why this setup?
Why now? The 1h price sits at 0.08455 inside a tight range, and the 15m RSI reading of 47.86 shows balanced but slightly bearish momentum that favors sellers. The 1h ATR of 0.001147 tells us volatility is compressed, so a break from the entry zone between 0.08426 and 0.08484 could accelerate fast. With the daily trend stuck in a range, the first target sits at 0.08249 and the second lies at 0.0
DOGE-0.06%
🚨 JUST IN: Citi now expects Fed Chair Kevin Warsh and the Federal Reserve to raise interest rates next week.
⚡24-Hour Market Snapshot | Four Coins Soaring: Long/Short Ideas
$BTC 77373, +1.09%, with the CPI bearish impact priced in ahead of time, it bottomed at 76400 before rebounding amid consolidation, shedding its short-term weakness.
Long: Buy the dip at 76600‑76800, stop-loss at 76100, targets 78300‑79000
Short: Try shorting if it surges but fails to break 79000, stop-loss at 79500, target 77200
$ETH 2535.9, +4.05%, showing significantly greater elasticity than Bitcoin, with a short-term high-volume rebound breaking the narrow-range consolidation pattern.
Long: Buy on a pullback to 2490‑2500, s
BTC-0.04%
ETH+2.50%
ZEC+2.30%
LAB+79.33%
$BTC Signal】1H middle band under pressure; short-sell accumulation zone
$BTC Order book buy orders have piled up to 5.59x, while the price is stuck at 77400, grinding sideways. The 4H MACD histogram at 0.87 has just turned positive, while the 1H histogram at -12.6 is deepening in the opposite direction, with momentum across the two timeframes pulling against each other.
The 1H RSI at 48.77 remains below the midpoint, while the 4H RSI at 43.17 is weaker. The Bollinger middle band at 77871 is capping the upside, while the 4H lower band at 76347 remains exposed below. The funding rate is 0.0013%
post-image
BTC-0.04%
Range-bound ONDO is about to break DOWN and catch shorts napping.

$ONDO /USDT - SHORT

Trade Plan:
Entry: 0.3519 – 0.3547
SL: 0.3671
TP1: 0.3429
TP2: 0.3360
TP3: 0.3257

Why this setup?
Why now? The daily trend remains a range, but the 1h price sits at 0.3533, already pressing against the top of the 15m RSI at 47.69, which shows the pair is losing bullish steam rather than surging higher. With the 1h ATR at just 0.005754, volatility is compressed, so a clean move lower toward TP1 at 0.3429 and TP2 at 0.3360 could unfold rapidly from the 0.3519 to 0.3547 entry zone. Everything points to a s
post-image
ONDO+0.20%
I would expect something liken this for $ETH .
Everyone losing their minds over inflation, hikes, OIL, war, clarity...
It doesn't matter bros.
The chart is telling you how all of that news is being interpreted.
Crypto is back in a bull market, that's it.
We're gonna get chop, we're gonna get swings...
But the regime has changed and higher is now the play.
Don't get shaken out.
post-image
ETH+2.51%
I wasn’t watching the market or using my brain—it was jumping around on its own, like it was working overtime for me.

During the repeated intraday fluctuations, $SKYAI I pointed out around 0.06198 that buying support was insufficient, and any move up would just be handing tokens to others.

It really did come down afterward. It’s at 0.05205 now, +392.47%. Feels good.

First close 80%; protect the remaining position at the cost basis, currently +392.20%. If it keeps dropping, let the profits run; even if it rebounds, don’t give the profits back.

The market is waited out, and profits are
post-image
SKYAI-0.31%
SOL+2.05%
BNB+1.19%
I just hit refresh, and it shot up, like I had scared it.

When the screen was glowing green, everyone else was running. $TAG faced obvious overhead resistance, with sell orders stacked layer upon layer. I said to wait for a rebound before adding.

Entered at 0.0010303, now at 0.0006729, +683.78%. The timing was right, and this bite of meat tastes great.

Take profits first: close 80%, and move the remaining 20% to the entry price for protection. Don’t get greedy for the last bite.

Hold as long as the trend remains intact; run if it breaks down. Don’t fall in love with the market. This i
post-image
TAG+12.32%
SNDK-3.45%
LAB+79.33%
Most traders will ignore this setup while SYMBOL quietly stacks gains.

$SOL /USDT - LONG

Trade Plan:
Entry: 101.83 – 102.49
SL: 98.99
TP1: 104.53
TP2: 106.12
TP3: 108.49

Why this setup?
Why now? The daily trend is bullish and the 4h bias is LONG with 95% confidence, which means the higher-timeframe structure is already aligned for upside. The 1h ATR of 1.319205 shows that volatility is steady enough to fuel a clean move rather than a chop. The 15m RSI at 50.11 indicates the short-term momentum is neutral to slightly bullish, leaving room for acceleration without being overextended. With
SOL+2.05%
This return makes me nervous, and I’m worried the market will come to its senses tomorrow and blacklist me. During the repeated intraday swings, $XAU /XAU hit a wall every time it tried to push higher. The resistance above was obvious—there was simply no one buying up there, and volume kept shrinking. I deliberately waited for two candlesticks to confirm it couldn’t break through before trying a short position around 4510.00.
Now it’s at 4357.68, with floating profit at +313.79%. It feels great—after grinding for so long, these few candlesticks made it all back.
I’ve taken the profit first and
post-image
XAU+0.76%
DOGE-0.06%
SNDK-3.45%
#GateMeme
The Market Has Its Own Sense of Humor 😂
Crypto has a special way of reminding us that the market does not always follow the plan we made five minutes ago.
You open Gate with a simple idea: check the market, look at the charts, understand what is moving, and maybe discover something interesting.
Then BTC starts moving up. 📈
You get excited.
You check your favorite coin.
It starts moving down. 📉
You refresh the chart.
Still down.
You check again.
Somehow, another coin is pumping instead. 😂
That is crypto in one picture.
The funny part is that every trader and crypto enthusiast has
Everyone is about to watch $H /USDT get crushed below the daily trend.

$H /USDT - SHORT

Trade Plan:
Entry: 0.08303 – 0.08393
SL: 0.08782
TP1: 0.08022
TP2: 0.07805
TP3: 0.07479

Why this setup?
Why now? The 1h price is hovering at 0.08353 inside a bearish 1D trend, the 15m RSI is stuck at 59.43 showing weak momentum, and the 1h ATR of 0.00181 tells us volatility is compressed before a move. The entry zone sits between 0.08303 and 0.08393, giving a precise trigger near 0.08348. If momentum turns, TP1 is 0.08022 and TP2 is 0.07805, while the invalidation level at 0.08109 is the line in the s
H+3.67%
I didn't expect it to survive, but it took me straight back to breakeven—excellent service.

When I opened the charts this morning, $GRVT fell just short every time it pushed higher, and volume failed to follow. I judged the bull-trap signals to be strong; nobody was taking it at the highs.

From 0.2933 to 0.1734, +805.58% secured—those sleepless nights paid off.

Bank the bulk first: close 80%, protect the remaining 20% at the entry price, and let it run if the sell-off continues.

The market exists to teach everyone a lesson, especially those who think they're the smartest. If you haven
post-image
GRVT+0.99%
ZEC+2.30%
DOGE-0.06%
Most traders are about to get blindsided by $SOXL /USDT.

$SOXL /USDT - SHORT

Trade Plan:
Entry: 121.38 – 122.36
SL: 126.55
TP1: 118.36
TP2: 116.02
TP3: 112.51

Why this setup?


Debate:
Are we cleanly hitting TP2 or is the range about to trap the shorts?

⚠️ Personal market analysis only. NFA — manage risk and DYOR.
Educational content, not investment advice or a recommendation to buy, sell, deposit, or withdraw any asset. No paid promotion or referral/affiliate links.
SOXL+5.28%
Everyone is sleeping on BNB but the 1h ATR just widened to 6.62942 and the setup is armed.

$BNB /USDT - LONG

Trade Plan:
Entry: 724.9 – 728.3
SL: 710.7
TP1: 738.5
TP2: 746.5
TP3: 758.4

Why this setup?
Why now? The 1D trend is bullish and the 1h price sits at 726.6, right inside the entry zone of 724.9 to 728.3. The 15m RSI at 50.93 shows neutral momentum, meaning the next move could be explosive in either direction. With the 1h ATR at 6.62942, the recent volatility is just enough to fuel a clean push toward TP1 at 738.5 and then TP2 at 746.5. The invalidation level is 721.1, which is the
BNB+1.19%
today live markets informations
live-cover
LIVE454
🔥 ZECUSDT FUTURES — TRADE UPDATE 🔥
Sometimes the market rewards patience and discipline. 📈
My ZECUSDT Long delivered a +17.44% ROI, with an entry around 1,064.89 and an average exit around 1,075.45.
The lesson? Don’t chase the market—read it, manage your risk, and let the setup come to you. 🎯
What do you think—is ZEC still bullish from here, or are we due for a pullback? 👀
For me is still bullish and right now is pumping so go make some little cash 😄
$ZEC
#Mrworldwide #CryptoCommunity
ZEC+2.30%
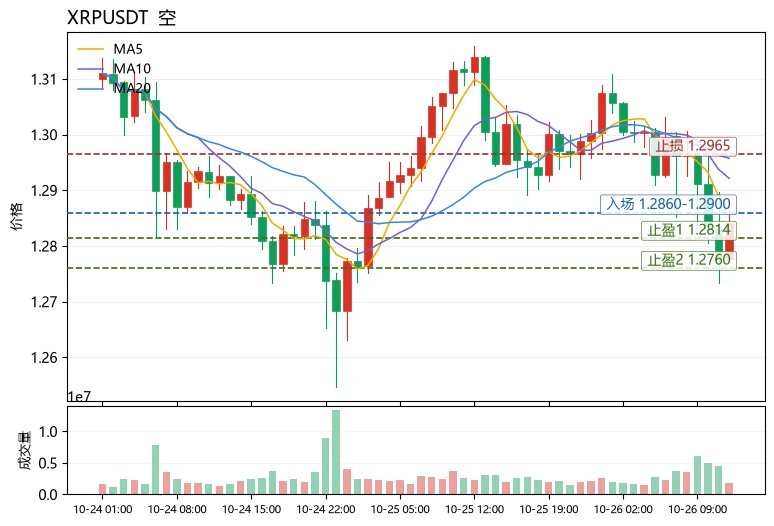
I originally wanted to cut my losses and sacrifice them to the heavens, but the ritual failed—the meat roasted itself instead. This is none other than the $XRP short position I opened a few days ago.

While everyone was still waiting and watching, I had already entered around 1.3836. Why the rush? Because before the market had fully started moving, I saw clear resistance above, with selling pressure getting heavier each round, and rebounds unable to hold at all. With this structure, if you don't go short, are you really going to wait for it to drop before buying in?

When I checked the mark
post-image
XRP+0.06%
LAB+79.33%
BNB+1.19%
News of the stock perpetual contracts going live flooded the screens, yet $LIT ground from 4.471 to 4.44: the hype failed to carry through
Ridiculous—the news of regulators opening the gate flooded the screens, but the market acted dead. Early this morning, the US laid a regulatory pathway for stock perpetuals; $LIT ±30 minutes moved only +0.2%, while the price ground from 4.471 to 4.44. I’m bullish: buy the dip at 4.2944, and cut losses if it breaks below 4.282.
The event is real—INJ’s equity volume last year was $4.5 billion, and its institutional division is an SEC-registered transfer agent
LIT-5.74%
Load More

Join 40 M users in our growing community

⚡️ Join 40 M users in the crypto craze discussion

💬 Engage with your favorite top creators

👍 See what interests you

View More