Square
Following
Hot
News
Notifications
Profile
Share your thoughts
placeholder
Article
How can you tell whether a trading strategy truly has a statistical edge rather than making money by chance?

In trading, one of the easiest mistakes to make is treating profits as evidence that a strategy works.

A run of profitable trades could mean the strategy has an edge, or it could simply mean it happened to encounter favorable market conditions.

So how can you tell the difference?

The key is not how much a few trades made, but whether the strategy has a repeatable positive expected return after costs under sufficiently reasonable testing conditions.

1. First, understand what a real
post-image
Jensen Huang hit by sudden controversy! Nvidia falls 2.2% after hours—is the AI chip leader in trouble this time?

Nvidia has recently been at the center of global tech news, but this time not because it launched a new chip. Instead, CEO Jensen Huang has become embroiled in controversy related to personal relationships and potential foreign intelligence activities, and the company's board has announced an independent investigation. After the news broke, Nvidia shares fell as much as about 2.2% after hours. Investors may be too preoccupied with this to even look at graphics cards.
Why is the ma
SPCX+8.74%
Trenches
ZIG
Z
bade
b
ZIG
0x8c...1145
Market Cap
$.
Change
.
24h Vol
$.
Holders
.
BTC
B
bade
b
BTC
C5xp...pump
Market Cap
$.
Change
.
24h Vol
$.
Holders
.
STONK
S
bade
b
STONK
6GmA...UNgx
Market Cap
$.
Change
.
24h Vol
$.
Holders
.
ANSEM
A
bade
b
ANSEM
9cRC...pump
Market Cap
$.
Change
.
24h Vol
$.
Holders
.
MAGGIE
M
bade
b
MAGGIE
8rHo...PmZV
Market Cap
$.
Change
.
24h Vol
$.
Holders
.
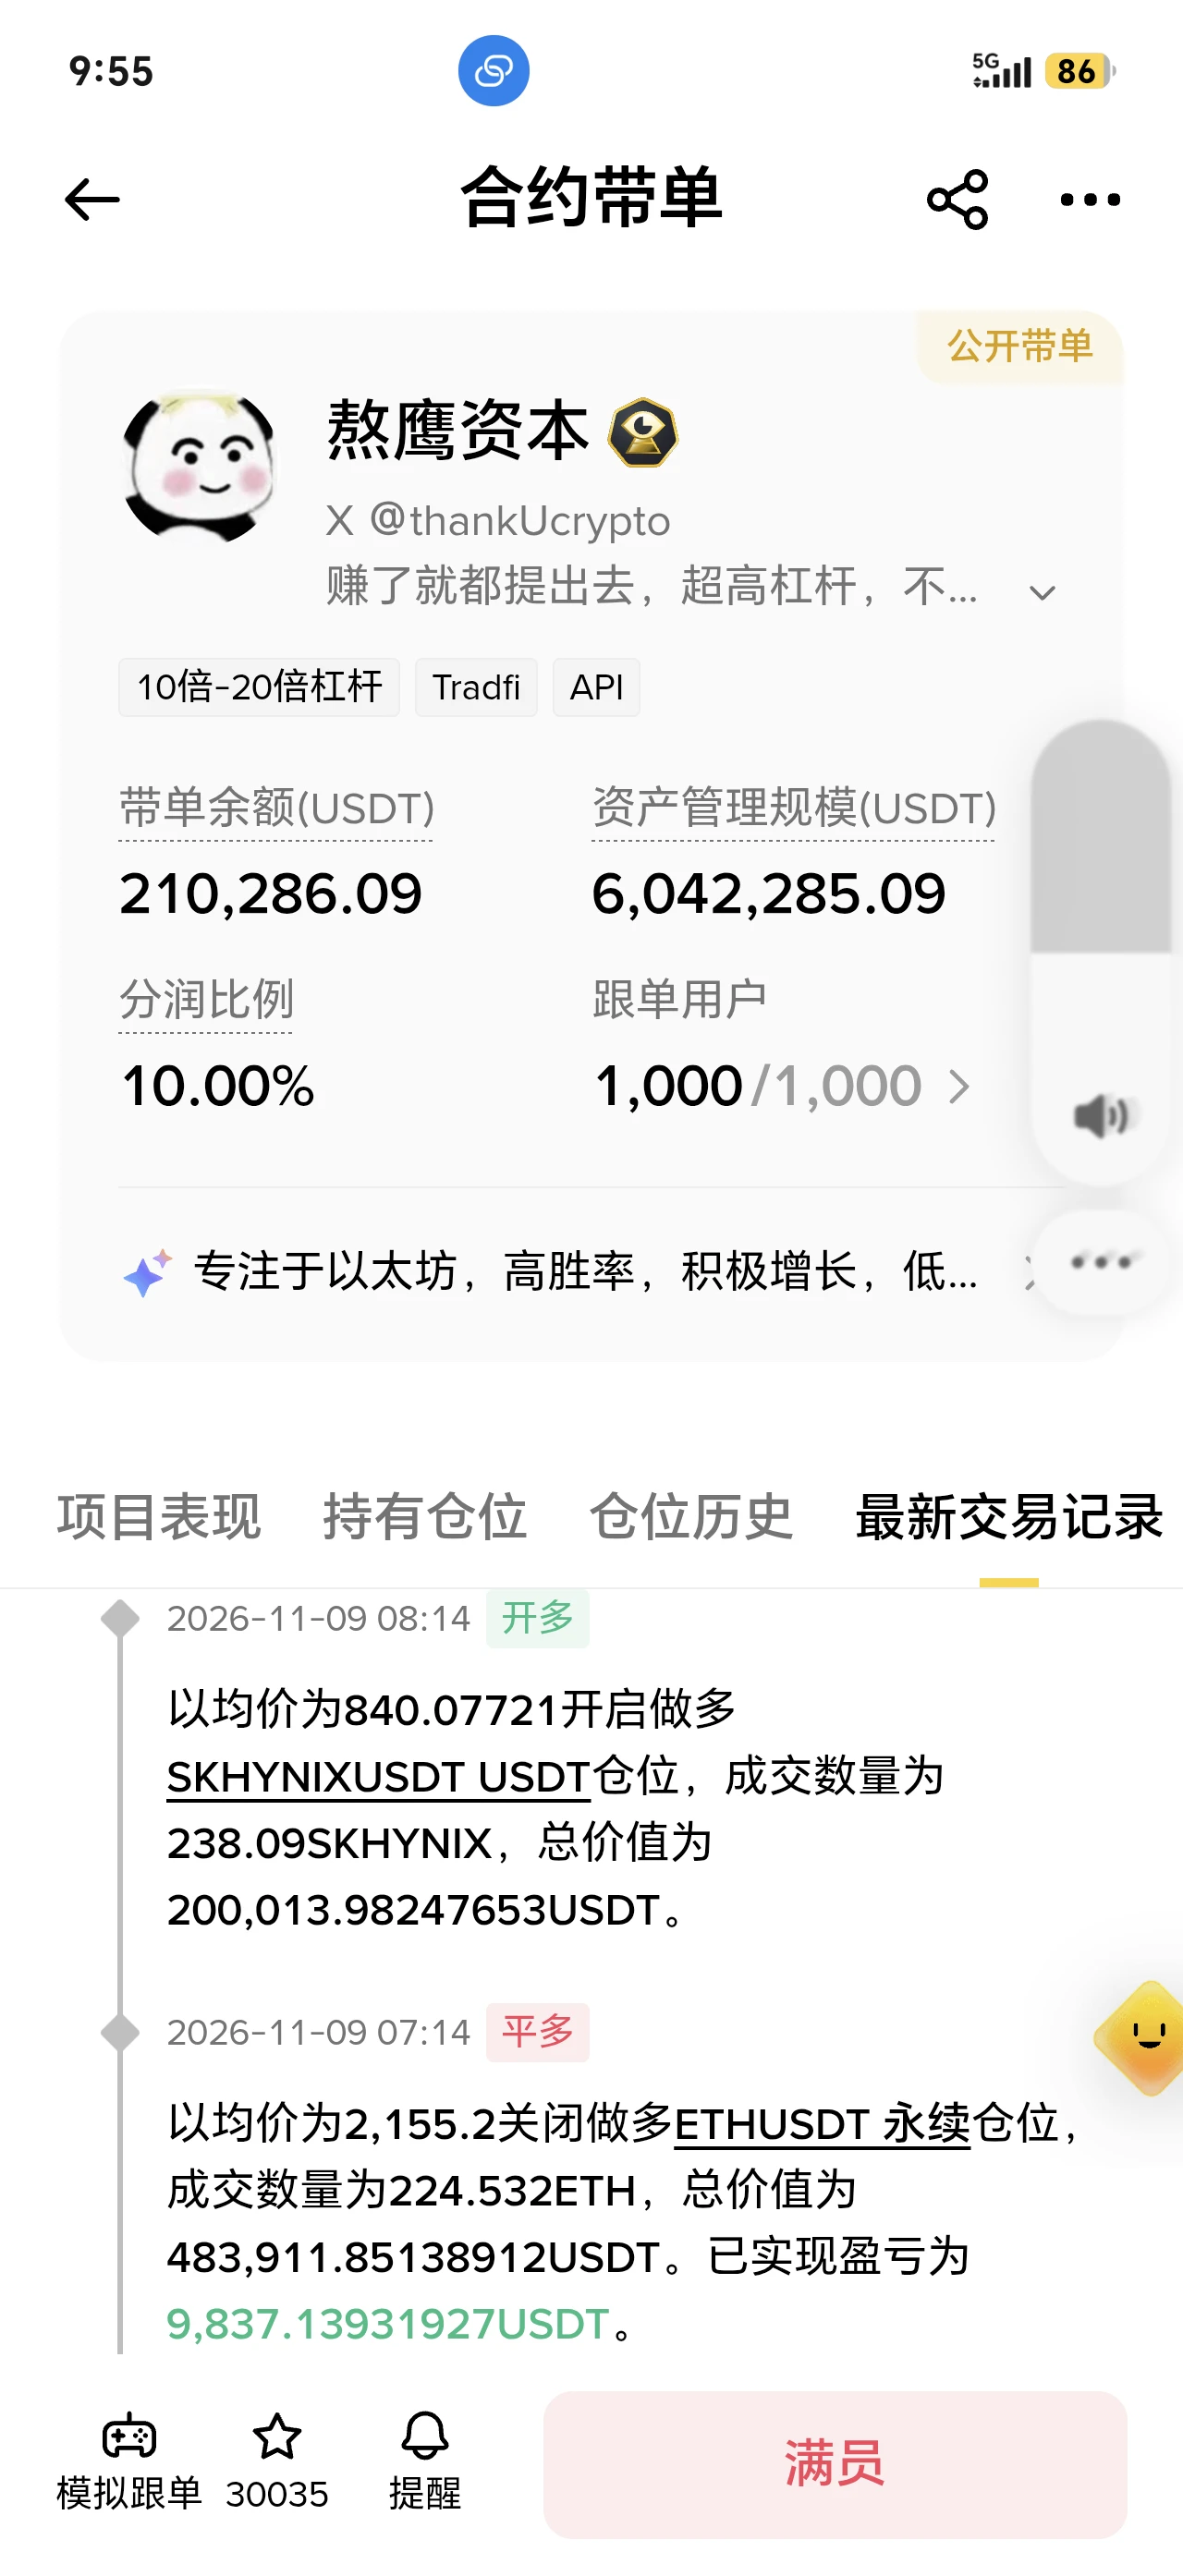
Aoying’s latest move: went long 284 Hynix tokens at $840 each, with a total position value of 200k U. $SKHYNIX
post-image
SKHYNIX+1.41%
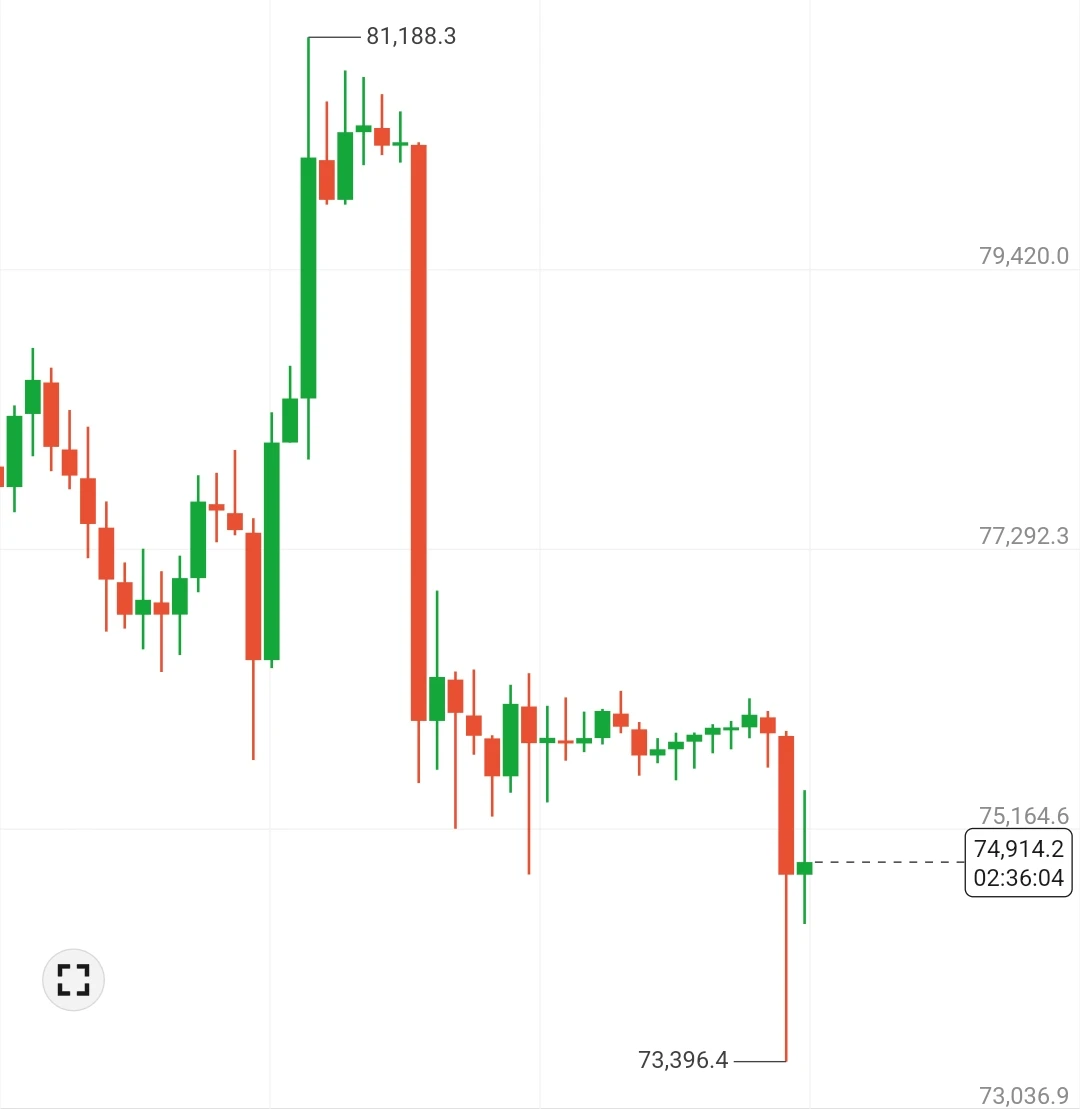
HUGE REVERSAL 💀$BTC dumping $2,000 and liquidating $1 BILLION in 10 minutes, $BTC is back at pre-dump levels.WHAT IS THIS PRICE ACTION??
post-image
BTC-0.65%
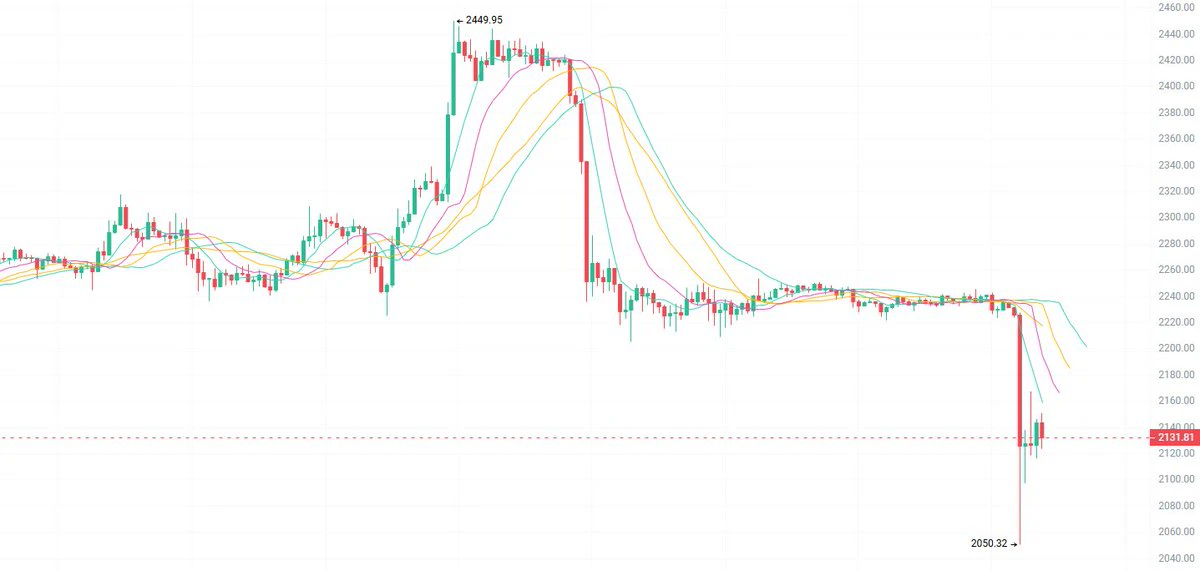
11.9 ETH: The rebound near 2150 is meeting resistance; consider a light short, targeting 2080/2050.
For those looking to go long, wait for support to hold near 2050 before entering. Stop at 2010; targets are 2120/2160.
On the 1H chart, price has plunged from the high of 2449, with a wick down to 2050. It briefly rebounded to around 2130, but the moving averages are fully aligned bearishly and diverging. The 2100 support level is being contested repeatedly, while 2160/2200 are resistance overhead. Bears still have the upper hand for now $ETH #ETH
post-image
ETH-1.26%
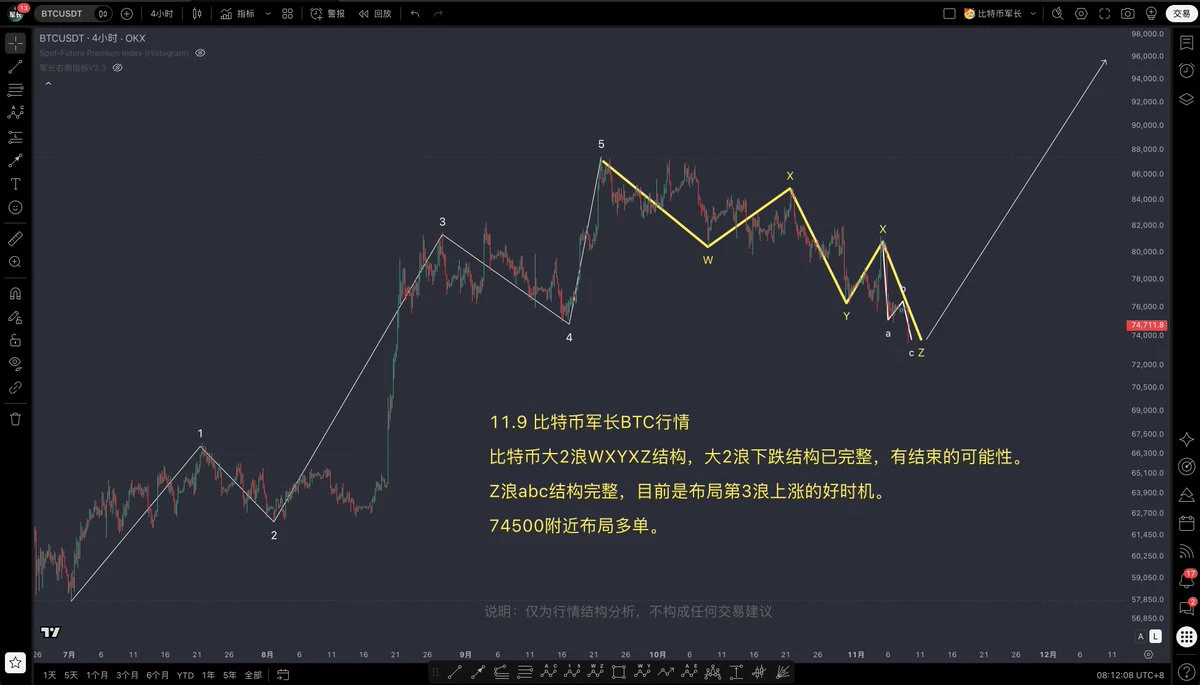
$BTC 11.9 Bitcoin Price Trend Analysis
Bitcoin’s major Wave 2 has a WXYXZ structure. The Wave 2 decline is complete and may be ending.
The Z wave’s abc structure is complete. Now is a good time to position for a Wave 3 rise.
Consider entering long positions around 74500.
Risk warning: This is only an analysis of market structure and does not constitute any trading advice.
#比特币走势分析
post-image
BTC-0.67%
  • 1
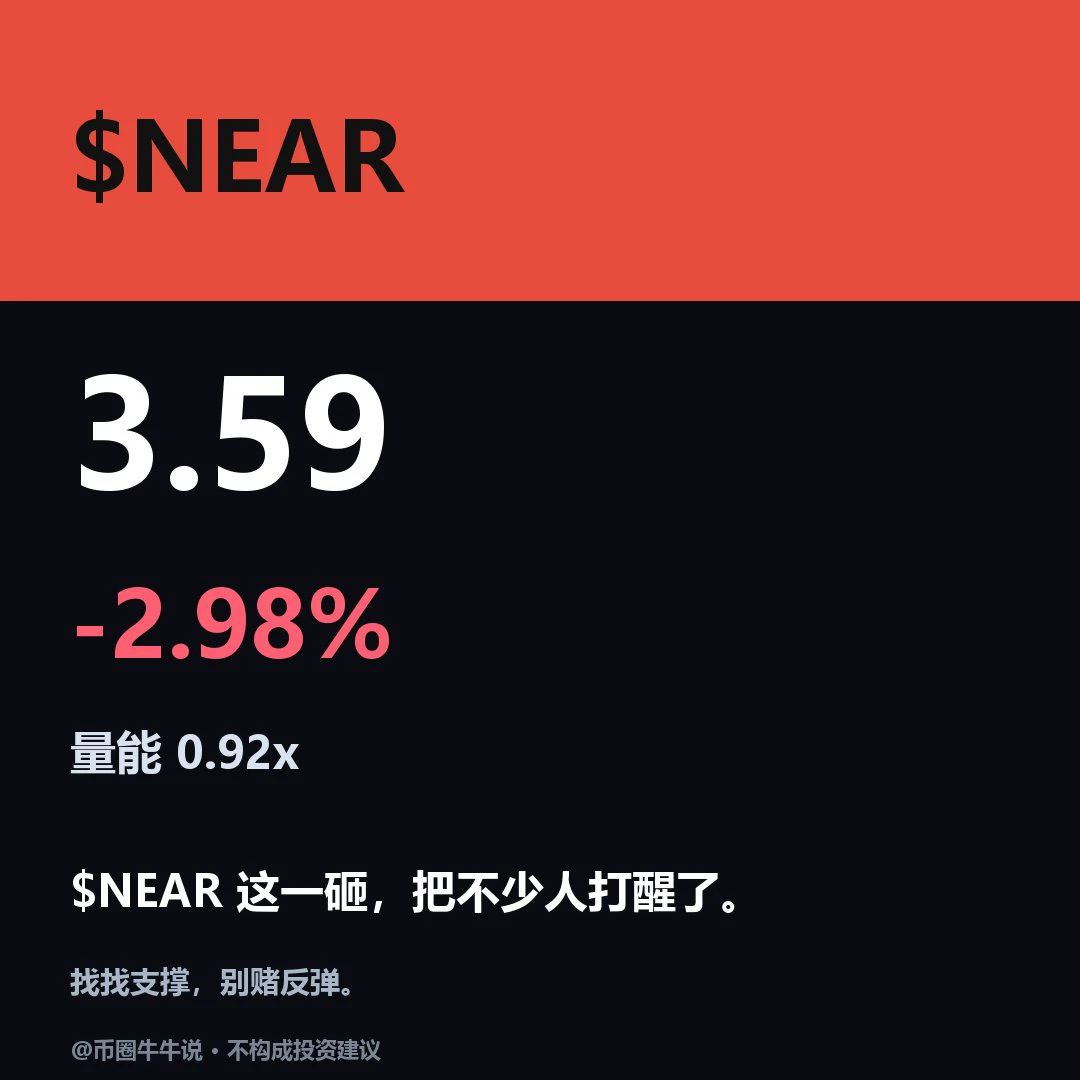
$NEAR Current price: 3.586, down 2.98% over 24H. 1H is weak: RSI 37.4/EMA20 3.635, support at 3.446/resistance at 3.746; 4H is weak: RSI 32.3/EMA20 3.716, support at 3.446/resistance at 4.063. For an upside move, price needs to establish itself above the 3.746 resistance; on the downside, watch for a break below the 3.446 support. Review whether price can hold above 3.746 and whether it can reclaim 3.446 after losing it; the setup is invalidated if price breaks below 3.446 and fails to reclaim it. The market is volatile; for observation only.
post-image
11.9$BTC Analysis
It quietly plunged in the early hours. The current decline is not the result of a single event, but a concentrated eruption of macro, regulatory, institutional, and endogenous risks. News assessment: This is not a single bearish catalyst, but a compound pullback driven by “tighter regulatory expectations, institutional retreat, and leveraged liquidations.” In the short term, bulls lack a fresh narrative to latch onto, and any rebound is likely to encounter holders looking to break even and new short sellers entering. MACD bearish crossover: DIF (-574.1) and DEA (-551.5) are
BTC-0.67%
Today's gold, KPI done in half an hour! Too bad there's no gold to trade on weekends—I got wrecked by Ether again!! Let's start at $40!!!
post-image
GLDX-0.40%
PAXG+0.37%
ETH-1.23%
$AIO Up 24% in 24 hours—I strongly advise you not to touch it right now.
Don't rush to accuse me of blocking your path to profits. Look at the data first: current price 0.0531, 24h high 0.0538, low 0.0381, price range over 40%, trading volume 20.7M. With this much volume behind the price move, tokens are changing hands extremely quickly, and short-term profits have piled up at the peak. If you jump in now, you're providing exit liquidity to those who got in early this morning.
Fundamentally, this AIO rally has no significant on-chain lockups backing it; it's a classic emotion-driven surge. The
AIO-3.19%
Even copy traders using foolproof mode are making profits,
post-image
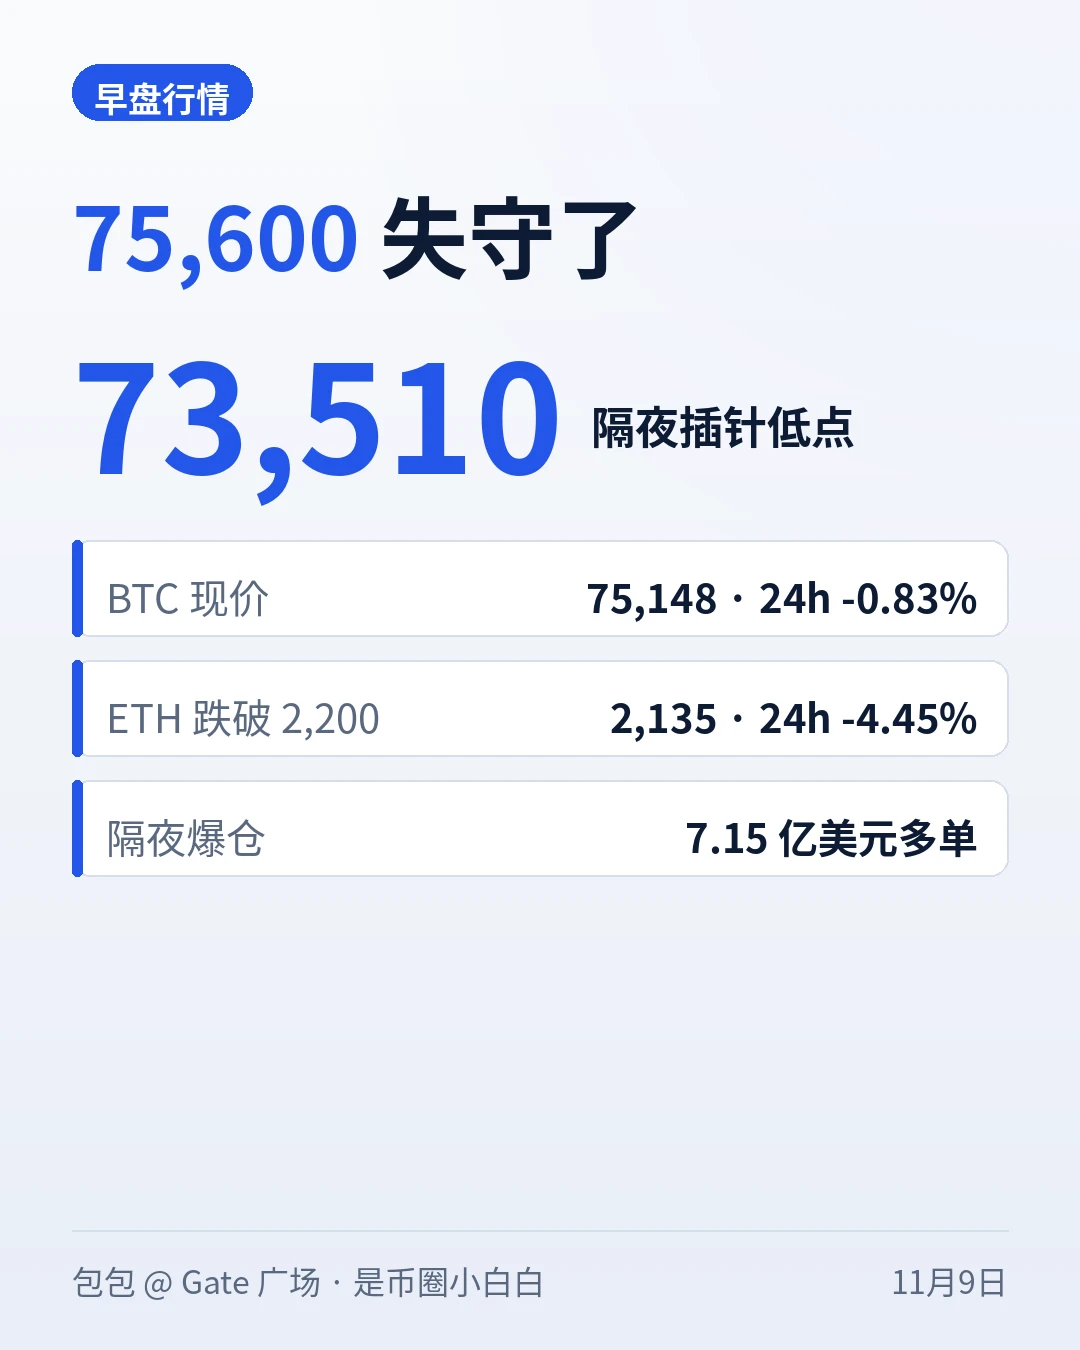
Sudden flash crash before BTC’s weekly close! A wick down to $73,510, with $715 million in long
live-cover
LIVE1,913
75,600 held for three days, but still broke. Overnight, BTC plunged to 73,510 on a single wick, liquidating $715 million in long positions in one hour. It’s back to 75,148 this morning—the first day after the breakdown, the key thing to watch isn’t how high the rebound goes, but whether 73,500, the wick’s low, holds. #70%山寨币跌破200日均线
First, the numbers (around 09:00 on November 9, 2026, sources: Finnhub / CoinGecko): BTC at $75,148, down 0.83% in 24 hours, trading in a range of 73,510–76,200; Friday’s close was 75,773, which means the 75,600 level held for three days over the weekend before gi
post-image
BTC-0.67%
ETH-1.26%
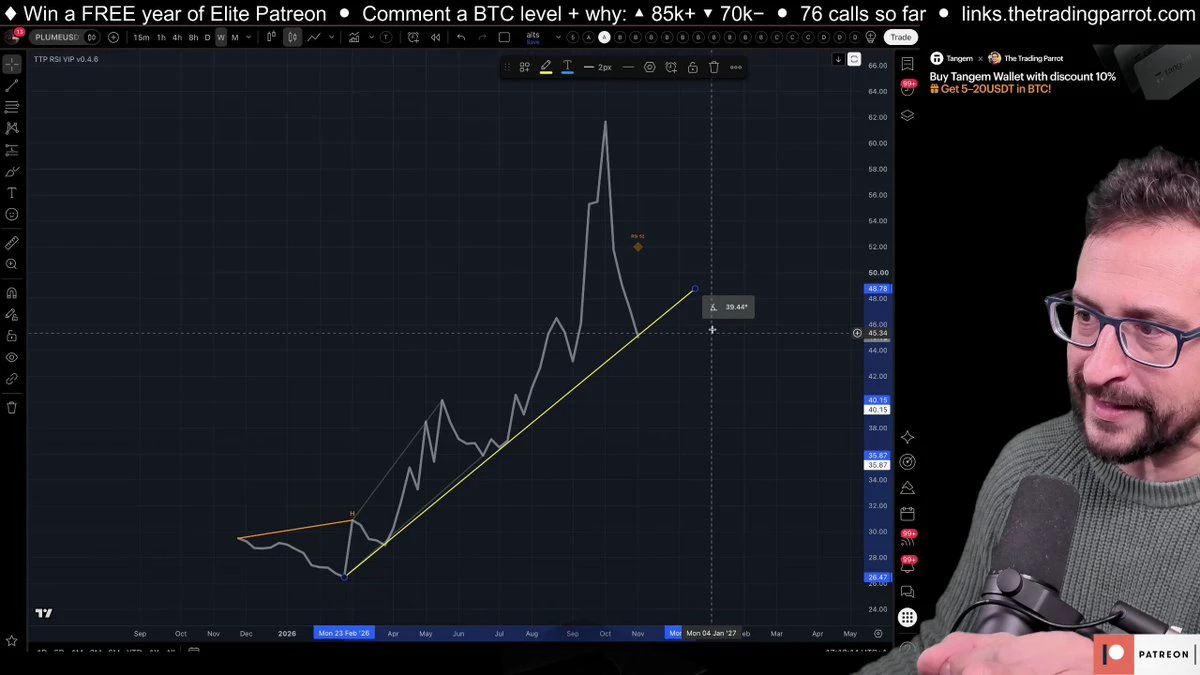
Plume: on the weekly, the RSI looks like a clean retest of its support, while the daily chart is losing the level. Mariano covers the RSI at 62, longs vs shorts at 65, and what a reclaim of support would mean. At 8:07 in the video.
#Plume #Crypto #Altcoins #TechnicalAnalysis
post-image
PLUME+3.05%
11.8 Morning Bitcoin Market Analysis$BTC

Bitcoin saw a deep correction today, dipping to around 73,300, down more than 2,400 points. The sharp drop was triggered by a steep sell-off in U.S. tech stocks combined with differences over Fed rate hikes. Liquidations across the network exceeded $1 billion in 24 hours, with leveraged long liquidations amplifying the decline. The market is currently in a recovery window following the sharp drop.

Technically, the 74,000–75,000 range has held steady for now after repeated tests. The four-hour MACD red bars are contracting, and the DIF appears poised
post-image
BTC-0.65%
If Leather Jacket Huang cheated, it would bring the tech sector crashing down. AI is already fragile, and with Nvidia valued so high, if they got divorced—damn, I can’t even imagine.
post-image
NVDA+2.80%
  • 5
  • 1
Backtest profits, live trading losses: How can you tell whether it’s an execution problem or the strategy has stopped working?

A strategy performs well on historical data. Why are the results completely different once real capital is put to work?

After suffering losses, many traders’ first reaction is to adjust parameters, add indicators, or even scrap the entire strategy.

But the problem could lie at different stages. Making changes blindly without identifying the cause may only make the strategy increasingly complex.

I. Step 1: Compare key backtest and live-trading metrics

First, put th
post-image
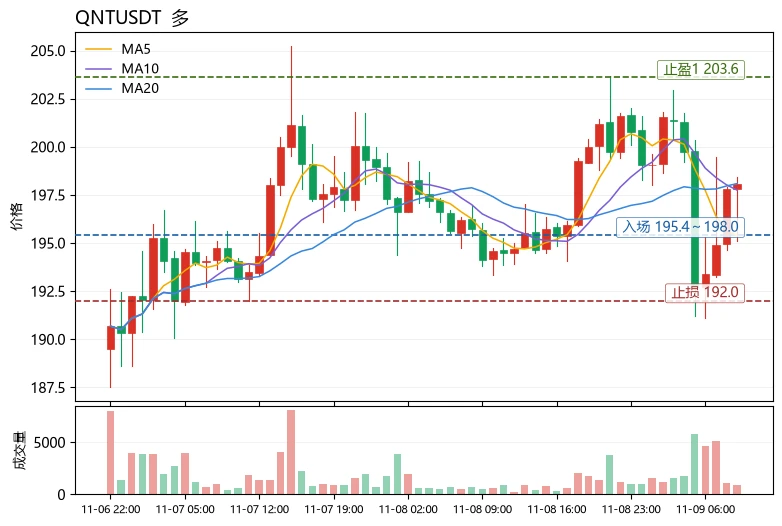
Why is $QNT more worth watching than $BTC in the same sector? The answer lies in relative strength: QNT is up 1.78% over 24h while BTC is down 0.79%. With the Fear & Greed Index at just 29, QNT closed higher against the trend. Its funding rate of +0.0100% is almost in line with BTC’s +0.0098%, indicating that longs have not paid an overheated premium—a healthy recovery rather than an emotionally driven chase.
Technically, QNT is currently at 198.04, just below MA20=198.088. MA5=195.362 remains below MA20, so the moving averages have yet to form a golden cross. However, RSI=51.5 is in neutral
post-image
QNT+4.79%
BTC-0.67%
RSR-1.93%
Crypto Market update
live-cover
LIVE1,510
$ROBO
#ROBO
😎
I now believe that it will go up / enter an uptrend.

​This is absolutely not financial advice!
I’m simply sharing my personal opinion and my own trades. You should do your own analysis and make your own decisions!
ROBO-2.79%
Load More

Join 40 M users in our growing community

⚡️ Join 40 M users in the crypto craze discussion

💬 Engage with your favorite top creators

👍 See what interests you

Trending Topics

BTCFlashCrash

11.44k Views65.98k Discussing

$BTC suffered a sharp flash crash, briefly falling to $73,510 within 15 minutes before rebounding. Around $745 million in crypto positions were liquidated within one hour, including roughly $715 million in long positions. Was this simply a leverage flush, or the start of another leg lower? The $73K–$75K area could become a key support zone to watch next.

USCPIDataIncoming

21.09k Views1.71k Discussing

USAIStocksHitHard

31.15k Views3.75k Discussing

View More