Share your thoughts
placeholder
Article
Nobody is talking about the quiet setup forming in SOXL right now.

$SOXL /USDT - SHORT

Trade Plan:
Entry: 119.44 – 120.18
SL: 124.44
TP1: 116.34
TP2: 114.02
TP3: 110.55

Why this setup?
Why now? The daily trend is range, but the 1h price at 119.81 is sitting right at the entry zone of 119.44 to 120.18, which is the trigger for the short bias. The 15m RSI at 62.96 shows momentum is not yet exhausted, allowing a clean move lower. The 1h ATR of 1.483647 tells us the average hourly volatility, so a push past 124.44 would break the trade invalidation. The first target sits at 116.34, the secon
SOXL+7.67%
Tong Ge’s 9.19 BTC outlook
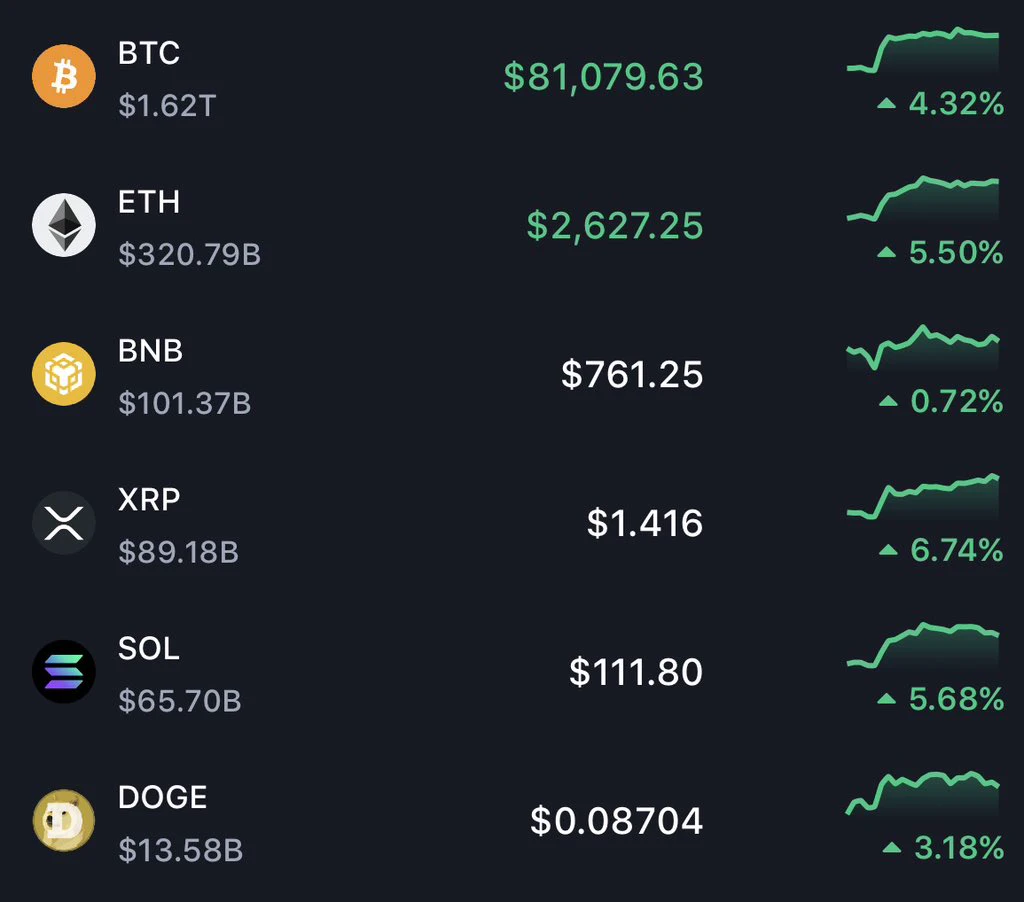
Enter shorts near $BTC 810-815, stop-loss at 820, target 800-795
If it pulls back to around 795-800, watch the buying support and take a small long position, stop-loss at 790, target 810-815.
Current price: 80922. BTC surged from 76210 all the way to 81242, directly reclaiming 80k.
This rally is indeed fierce, but the more rapid the pump, the less we should FOMO into longs.
Reclaiming 80k is a fact, but the 810-815 range above has also been a repeatedly contested area.
So don’t chase highs today; if it cannot break through, continue taking shorts.
If it truly holds a
post-image
BTC+5.99%
$CRCLB The most unusual point today is that the Fear and Greed Index has returned to the greed zone at 56, yet the broader market is moving hesitantly, while it has gained +7.34% in a single day with a trading volume of 23.5M USDT, clearly outperforming most assets. This structure—sentiment recovering while capital recognizes only a handful of strong performers—usually means sector rotation is shifting from broad-based gains toward the strong getting stronger.
Technically, MA5=91.246 has crossed above and is clinging to the current price of 91.24, while MA20=88.317 forms the first support belo
post-image
PEPE+5.79%
$G surging +61% Is Gravity consolidating post-spike above MA30 support for a secondary push toward $0.0088+? Here is my trade setup.
Pair: $G /USDT
BUY ZONE / ENTRY:
Entry Range: 0.006800 - 0.007550
TARGETS:
TP 1: 0.008800
TP 2: 0.010165
TP 3: 0.011500
STOP LOSS:
SL: 0.006100
📌 Found this market breakdown helpful? Follow for daily setups, technical analysis, and real-time trade signals
$G ‌
post-image
G+58.24%
  • 4
  • 2
$NEAR NEAR Rises to $3.48: Secret TVL Milestone and ETF Application
NEAR Protocol (NEAR) reached $3.48 on the morning of September 18, 2026, gaining 29.51% in the last 24 hours. Intraday trading ranged between $2,635 and $3,516, pushing market capitalization above $4.11 billion. This surge is driven by three key developments:
The Secret TVL Milestone and the NEAR@3.33 Program
NEAR’s privacy-focused cross-chain trading pipeline, Confidential Intents, reached a total locked value (TVL) of $70 million on September 15. This threshold triggered a snapshot under the NEAR@3.33 incentive program. Ac
post-image
#Gate广场中秋团圆局
#USAIConceptStocksRally The AI Trade Just Passed Its First Macro Test
The most important number from Thursday’s U.S. session was not Intel’s +7.7% or Arm’s +8.6%. It was the Nasdaq +1.69% move after the Federal Reserve delivered another 25-basis-point rate hike. The S&P 500 gained 1.14% and the Dow added 0.61%, but the stronger performance in technology and semiconductor names shows where risk appetite returned first. The question now is not whether AI stocks can rebound for one session; it is whether capital is beginning to rotate back into the AI infrastructure trade after the
post-image
9.19 Bitcoin analysis
Analysis: Go long on a pullback to around 79,500–80,000, with 79,000 as the defense level, first target 81,500, second target 82,500
On the 1H timeframe, a strong upward move began from the phase low of 76259.98, with the price breaking above the resistance from the moving averages across all timeframes on heavy volume and surging to a phase high of 81258.01. It is currently consolidating at a high level near the previous high. The overall bullish trend remains strong; short-term upward momentum has moderated somewhat, but the bullish structure remains intact. The moving-
post-image
BTC+6.02%
CPU Stocks Explode Higher! Intel jumps 10 and AMD gains over 7. Can chip stocks keep pushing higher?
live-cover
LIVE1,133
$TAO surging +10% Is Bittensor holding moving average support for a breakout past $253.2 toward $270+? Here is my trade setup.
Pair: $TAO /USDT
BUY ZONE / ENTRY:
Entry Range: 245.0 - 252.5
TARGETS:
TP 1: 253.2
TP 2: 270.0
TP 3: 295.0
STOP LOSS:
SL: 227.0
$TAO ‌#WeeklyTradeShare
post-image
TAO+8.98%
  • 5
Can we run the bull market back again?😭
post-image
The say the low windows didn't work..
Well you ignored the Monthly windows for Others..
Nailed BTC, ETH and Others...
post-image
BTC+6.02%
ETH+7.48%
Gm frens ☀️
My friends told me to bounce back hard
Me:
post-image
LDO pump pump big pump ath go
post-image
LDO+10.68%
[New streamer BTC]
live-cover
LIVE13
$MSTR is showing a strong increase of +14.92% at the 152.00 level; the recovery from the 81.81 low has pushed the price above the MA5, MA10, and MA30. However, the 193.00 peak is still far away on the chart, and a negative P/E ratio remains. The picture before the October 29 earnings report seems to say, "I'm strong, but cautious"; stay calm, observe the level. #MSTR 🤔
Not investment advice.
MSTR+16.35%
$81,000. WAGMI
post-image
  • 2
$INTC /USDT is about to break a hidden range that most traders are completely ignoring.

$INTC /USDT - SHORT

Trade Plan:
Entry: 106.39 – 106.91
SL: 109.13
TP1: 104.79
TP2: 103.56
TP3: 101.70

Why this setup?
Why now? The 1h price is sitting at 106.56, just below the entry zone of 106.39 to 106.91, which sets up a clean short setup. The 15m RSI has dropped to 28.48, signaling that the asset is deeply oversold and primed for further downside. The 1h ATR of 1.031356 shows that the average hourly move is large enough to reach the first target at 104.79 and push toward the second target at 103.
INTC0.00%
Guess what this means for your ripple:native
post-image
$DOGE bought a long 🟢
Current price: $0.087814-hour structure: After breaking out of the $0.0836 area, strong bullish momentum continues. 🔹 Entry: $0.0868–$0.0878🎯 Take-profit 1: $0.0897🎯 Take-profit 2: $0.0920🎯 Take-profit 3: $0.0940🛑 Stop-loss: $0.0848$DOGE bias: As long as it remains above $0.0850, the bias is still bullish. EMA + RSI: Momentum favors buyers, but after this sharp 4-hour move, a pullback toward the entry area is safer than chasing the rise. ⚠️ If the price breaks below $0.0848, the long setup will weaken. HKMAPlansWholesaleCBDCByYearEnd
post-image
DOGE+7.58%
Load More

Join 40 M users in our growing community

⚡️ Join 40 M users in the crypto craze discussion

💬 Engage with your favorite top creators

👍 See what interests you

Trending Topics

JapanRealEstatePowerChipStocksRise

58.62k Views3.54k Discussing

Japan's Nikkei extended gains on Sept 18, with real estate, power, and semiconductor sectors leading. Gate covers over 12,800 global stocks and ETFs, offering one-stop USDT trading across US, HK, Korean, and Japanese markets. [👉 Read more](https://www.odaily.news/en/newsflash/518749)

USAIConceptStocksRally

33.41k Views490 Discussing

GateTopsStockPerpetualCoverage

37.56k Views2.31k Discussing

View More