




Share your thoughts
placeholder
Article
Why is everyone suddenly looking to sell $ADA /USDT right now?

$ADA /USDT - SHORT

Trade Plan:
Entry: 0.2057 – 0.2075
SL: 0.2156
TP1: 0.1998
TP2: 0.1953
TP3: 0.1885

Why this setup?
Why now? The 4h trend is range-bound and the 1h RSI sits at 45.83, suggesting the bounce is fading just as the 1h ATR of 0.003765 shows volatility compressing. The entry zone between 0.2057 and 0.2075 aligns with the current 1h price of 0.2066, giving a clean short setup with defined targets at 0.1998 and 0.1953. The 1D range means the move is not yet confirmed as a breakdown, so the invalidation level of 0.215
ADA-0.91%
⚡24-Hour Market Snapshot | Four Coins Soaring: Long/Short Ideas
$BTC 77373, +1.09%, with the CPI bearish impact priced in ahead of time, it bottomed at 76400 before rebounding amid consolidation, shedding its short-term weakness.
Long: Buy the dip at 76600‑76800, stop-loss at 76100, targets 78300‑79000
Short: Try shorting if it surges but fails to break 79000, stop-loss at 79500, target 77200
$ETH 2535.9, +4.05%, showing significantly greater elasticity than Bitcoin, with a short-term high-volume rebound breaking the narrow-range consolidation pattern.
Long: Buy on a pullback to 2490‑2500, s
BTC+0.22%
ETH+3.23%
ZEC+5.01%
LAB+63.71%
I was just about to go rant on the forum, but then I saw my balance and thought, forget it—the market daddy is always right. When the early-session sell-off first hit, $ACE /ACE looked like it was about to fight back, but volume failed to follow through at all. Every push upward fell just short, and this kind of rebound is a classic case of insufficient support. I watched it reach around 0.1847, didn’t hesitate, and shorted according to plan, betting it couldn’t keep bouncing.

And it really did me a favor, sliding down from 0.1847 to 0.1576, with floating profit now at +361.12%. This move has
post-image
ACE-0.88%
BTC+0.22%
SNDK-3.65%
Why CL shorts are about to get wrecked if this range breaks up.

$CL /USDT - SHORT

Trade Plan:
Entry: 96.64 – 97.14
SL: 99.33
TP1: 95.06
TP2: 93.84
TP3: 92.02

Why this setup?
Why now? The daily trend is still a range, so the big move has not happened yet. The 15m RSI at 55.71 shows mild bullish momentum, which is exactly the kind of setup that traps late shorts. The 1h ATR of 1.015377 means each swing can easily cover TP1 at 95.06 and TP2 at 93.84 if sellers step in near the entry zone of 96.64 to 97.14. The trade invalidates hard at 94.46, that is the line in the sand.

Debate:
Are we h
CL-4.52%
Everyone's sleeping on this SHORT setup while SYMBOL sits trapped in a range.

$LTC /USDT - SHORT

Trade Plan:
Entry: 53.43 – 53.75
SL: 55.12
TP1: 52.45
TP2: 51.68
TP3: 50.54

Why this setup?


Debate:
Are we getting a clean move to TP2 or will the range trap the shorts first?

⚠️ Personal market analysis only. NFA — manage risk and DYOR.
Educational content, not investment advice or a recommendation to buy, sell, deposit, or withdraw any asset. No paid promotion or referral/affiliate links.
LTC+2.67%
I’ve recovered half of today’s ETH losses from Solana#8月核心CPI超预期 #ETH
post-image
ETH+3.21%
Everyone is sleeping on SYMBOL while the daily trend screams short.

$ESPORTS /USDT - SHORT

Trade Plan:
Entry: 0.01050 – 0.01062
SL: 0.01117
TP1: 0.01010
TP2: 0.00980
TP3: 0.00934

Why this setup?
Why now? The daily trend is firmly bearish, giving traders a clear directional edge that has been ignored by the crowded long side. The 15m RSI at 55.29 shows the short trade has room to run without being overbought yet, meaning you are not chasing exhaustion. The 1h ATR of 0.000254 confirms enough volatility exists to capture meaningful moves from the entry zone between 0.01050 and 0.01062. TP1
ESPORTS-0.92%
I had just switched the app to the background when it suddenly popped back up—are you playing hide-and-seek with me?

When I checked the chart after lunch, $SAFE was still spinning in place, with painfully light trading volume. But the sell orders were clearly thinning out; there was no volume to drive it down, while pushing it up was surprisingly easy. I've seen this rhythm far too many times—it’s not that it won’t move, the time just hasn’t come yet. My call at the time was simple: bullish, go long.

Then it took off. Entered at 0.08209, current price 0.09677, unrealized profit +177.49%. I
post-image
SAFE+1.41%
BNB+1.73%
ETH+3.23%
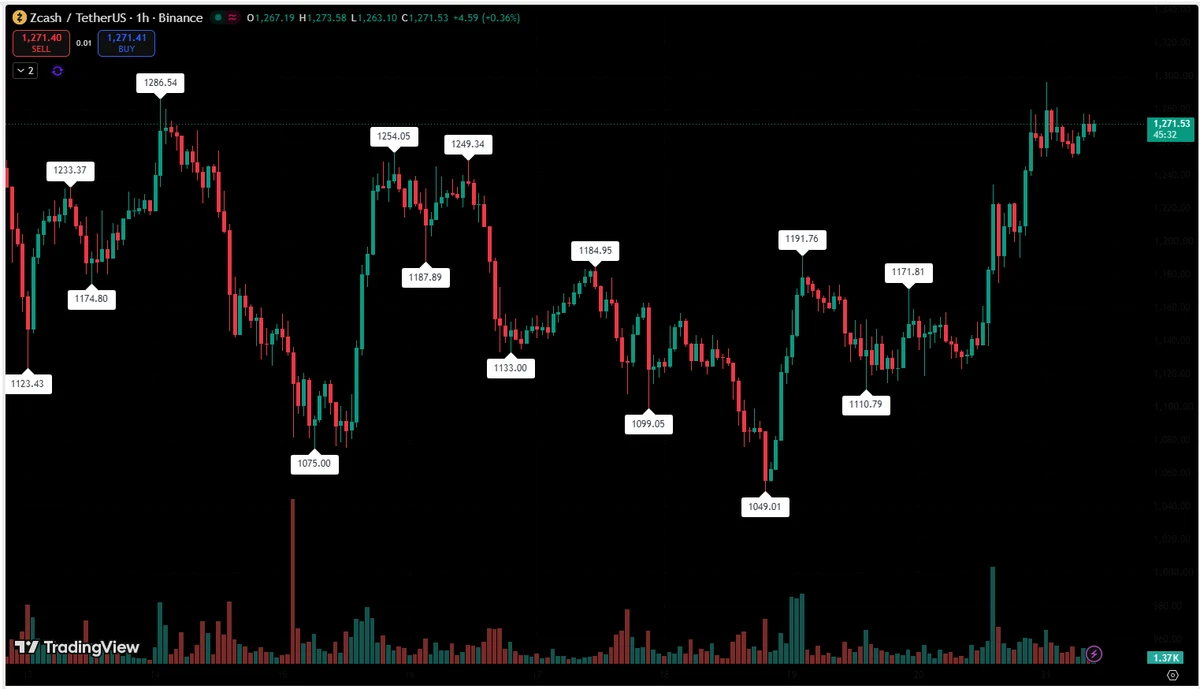
#$ZEC Fans trapped in ZEC, my sister-in-law helps Hongtao♥️ analyze the chart😏
Precise levels and direction—just say whether that’s badass
Am I just a hindsight strategist? The video is proof
#8月核心CPI超预期
ZEC+4.81%
today live markets informations
live-cover
LIVE367
[$Lobster Signal] Long + 4H high-level turnover on volume expansion
$Lobster high-level turnover, depth ratio 1.37, current price 0.050507. Sideways movement after a 4H huge-volume long bullish candle, with thick buy orders. The 4H MACD histogram turned positive, with a bullish cross below the zero line; RSI 48.92, momentum not overheated. EMA20 at 0.0488 provides support, while EMA50 at 0.0571 creates resistance. Funding rate 0.0394%, OI stable. Enter long in the current price range, risk-reward ratio 1.5, stop-loss distance relatively wide, reduce position size.
🎯Direction: Long
⚡Entry/limi
post-image
龙虾+70.35%
BTC+0.20%
ETH+3.21%
SOL+2.86%
A SOL fan asks: Sister-in-law, help analyze the chart😏
Give the exact levels and direction—just say whether it’s bullish or not.
Am I just a hindsight strategist? The video is proof.
$SOL
SOL+2.89%
1,000,000 united state dollars ya Allah wen?
post-image
This profit is making me feel uneasy, worried that the market will catch on tomorrow and blacklist me.
Just when I thought this move was completely over, I went back and took another look at $EVAA ’s chart. Each rebound was weaker than the last, and volume failed to follow, showing clear lack of support. I placed the short at 0.8304. My thinking at the time was simple: if no one is buying up there, then it goes down.
+373.48% quietly landed in my account just like that. Getting the timing right feels better than anything.
The prerequisite for compounding is staying alive; the shortcut to getti
post-image
EVAA+6.09%
LAB+63.71%
ETH+3.23%
Why is everyone missing the short setup forming right now in $XAU /USDT?

$XAU /USDT - SHORT

Trade Plan:
Entry: 4347.68 – 4358.58
SL: 4405.44
TP1: 4313.90
TP2: 4287.74
TP3: 4248.51

Why this setup?
Why now? The 1h price is sitting at 4353.13 inside a tight entry zone between 4347.68 and 4358.58, which gives us a precise trigger. The daily trend is range-bound, so we expect mean reversion rather than a breakout, and the 15m RSI at 42.2 shows bearish momentum without being oversold yet. The 1h ATR of 21.795978 tells us the average volatility, so a move beyond 4423.07 invalidates the entire s
post-image
XAU+0.63%
In a downtrend, many people get the direction right, but few actually hold on. This $ENA short was hit by two rebounds, so I set the protection level farther away to filter out normal fluctuations.
The first rebound erased most of the unrealized profit. I did not rush to act because the price had not reclaimed the key wick level, and the moving averages were still exerting downward pressure. As long as the key level was not reclaimed, the short structure remained intact, and the rebound was temporarily treated as a shakeout.
Later, the price accelerated after breaking below 0.15075. I first to
post-image
ENA-2.33%
ETH+3.23%
SNDK-3.65%
$IOST dropped from 0.0011 to 0.0009, and the little profit in my account evaporated by 40% in three days. Honestly, this feeling is all too familiar—the same “it won’t fall much further” illusion buried me last year.
But today I’m not talking about emotions, only the data. A 24h trading volume of 159.9M is unusual for an old coin whose market cap ranking has fallen outside the top 200. A normal gradual decline wouldn’t bring such heavy turnover, which means someone is buying—and buying aggressively. The 0.0009 level happens to be the neckline of the rally that started last November. Breaking
IOST-13.05%
I was just about to shut down my computer and go to sleep, but then it started putting on a nosedive, instantly jolting me awake.

A few days ago before bed, the rebound looked pretty aggressive, but the volume clearly failed to keep up, and every push higher was just short of breaking through. I opened a short directly around 0.008967, betting that this rebound was a bull trap—an upside move without conviction won’t go far.

When I opened the chart this morning, well, it gave me the answer outright. At 0.00686, the drop was even more decisive than I expected, and +462.65% in unrealized prof
post-image
ZEC+5.01%
BTC+0.22%
$DOGS Up 15% in one day, yet the 24h low is listed as 0.0000—this isn’t a pullback; it’s a test of going straight to zero.
Let’s start with an everyday analogy. Have you ever raised one of those stray dogs that eats like crazy but never gets any bigger? $DOGS This move is like it suddenly standing up and running fifteen steps. You think it’s about to become a police dog, but when you look down, it’s still running in place in the yard. The current price is 0.0001, and the 24h high is also 0.0001, while the low is 0.0000. In plain English: it really did rise 15% today, but the price is still l
DOGS+13.37%
Load More

Join 40 M users in our growing community

⚡️ Join 40 M users in the crypto craze discussion

💬 Engage with your favorite top creators

👍 See what interests you

View More