Square
Following
Hot
News
Profile
Share your thoughts
placeholder
Article
Dachao has always been bullish on pons, for one reason: the lower it falls, the more gets burned.
Most of the platform’s daily fee revenue is used to buy and burn pons. Last week, it spent about 150ku a day on buybacks.
This money is spent based on the amount of u, not the number of tokens.
At 0.41u, 150ku a day could buy and burn 380k pons. At 0.28u, the same 150ku could buy and burn 560k, nearly half again as many.
The lower the token price, the more tokens disappear from the market each day. Sellers keep selling until they run out, but the buybacks never stop.
That’s why at the 0.3u level,
post-image
PONS+15.20%
Two consecutive wins today; shorted at 4157 and exited at 4146, 2000🔪
The entry had a basis, and the exit had a plan $XAU
XAU-0.35%
A brief analysis of BTC’s short-term trend from Dow Theory, Chan Theory, Elliott Wave Theory, volume-price relationships, order flow, and price action
Shorts take profit before dawn: Yesterday’s predicted C-5 endpoint of 79,450-78,500 was not reached—the October 13 low was only 80,960 (the C wave truncated at the double-bottom position), followed by a V-shaped reversal to 84,068 on 18.5 billion in volume and Delta +$836 million. Shorts opened on October 12 took their first batch of profits at 80,960 as planned. The structure has now fundamentally changed: the 80,316/80,960 double bottom has fo
BTC+0.93%
#美国9月CPI即将公布 #CPI Bitcoin’s Next Volatility Test: Can September Inflation Change the Fed Outlook?
The next major macroeconomic catalyst for Bitcoin is approaching. On October 14, 2026, the United States is scheduled to release its September Consumer Price Index (CPI) report at 8:30 AM Eastern Time, equivalent to 20:30 UTC+8. With inflation expectations, interest-rate policy, and risk appetite all in focus, this report could set the tone for the next phase of crypto-market volatility.
But the key question is not simply whether inflation rises or falls. It is whether the actual numbers surprise
Falcon_Official
#USCPISoon September Inflation Could Reset the Fed’s Next Move: Energy Shock, Core CPI and the Market Reaction Test
The next major US inflation report arrives on October 14, and markets are approaching it with a difficult combination of elevated energy costs, persistent underlying inflation and uncertainty over Federal Reserve policy. The September Consumer Price Index (CPI) will be released by the US Bureau of Labor Statistics at 8:30 a.m. Eastern Time, equivalent to 5:30 p.m. Pakistan time. As of October 13, the figures have not yet been released, so the numbers investors are discussing are forecasts, not confirmed results.
The numbers markets are watching
Economists surveyed in recent market reports expect headline CPI inflation to rise to approximately 3.7% year over year in September, compared with 3.4% in August. Core CPI, which excludes food and energy, is forecast at around 2.5%, up from 2.4%. The difference between these two measures is central to interpreting the report: headline inflation captures the direct effect of volatile energy and food prices, while core inflation provides a clearer view of underlying price pressures.
August already showed renewed pressure. The headline CPI increased 0.4% month over month, while gasoline prices rose 3.9% and the broader energy index increased 2.1%. Shelter costs also rose 0.3%. These figures suggest that the September report must be examined beyond its annual headline number: the monthly change, energy contribution and persistence of service-sector inflation all matter.
Why energy could distort the headline
Oil prices have become a major variable in the inflation outlook. Brent crude was reported around $106.65 per barrel on October 12 amid concerns about Middle East supply disruptions. Higher crude prices can feed into gasoline, diesel, transport and distribution costs, placing renewed pressure on household budgets and business margins.
This creates an important analytical distinction. If headline CPI accelerates while core inflation remains relatively moderate, the increase may be driven largely by energy rather than a broad resurgence in consumer demand. That would still matter for households and inflation expectations, but the policy implications could differ from a report showing simultaneous acceleration across housing, services and other core categories.
The key question is whether higher energy costs remain a temporary shock or begin spreading into broader prices and wages.
Three scenarios for markets
A softer-than-expected report could ease pressure on Treasury yields and support rate-sensitive assets. If core inflation rises only modestly and monthly price increases remain contained, investors may become more comfortable with the possibility that the Fed can avoid additional tightening. Growth stocks, technology shares and other long-duration assets could benefit, although the reaction would also depend on earnings expectations and market positioning.
A hotter report would create a different test. If both headline and core inflation exceed forecasts, markets could reassess the risk of further rate increases or a longer period of restrictive policy. Treasury yields and the US dollar could strengthen, while expensive growth stocks and other interest-rate-sensitive assets face valuation pressure.
A mixed result may be the hardest to interpret. Headline inflation could rise because of energy while core CPI remains close to expectations. In that case, traders will need to assess the composition of inflation rather than treating the headline figure as a complete signal. These are conditional scenarios, not predictions of the actual release.
The Federal Reserve’s dilemma
The Fed must balance price stability against economic activity. Inflation remaining above its 2% objective complicates any move toward easier monetary policy, but higher interest rates also raise borrowing costs for households and businesses. Market commentary ahead of the release indicates that policymakers are weighing whether incoming inflation data justify further tightening, with the September CPI report an important input.
One report will not determine the entire policy path. The Fed also considers employment, consumer demand, inflation expectations and other price measures, including the Personal Consumption Expenditures index. Investors should therefore avoid treating a single monthly CPI print as a guaranteed signal of the next rate decision.
What traders should monitor after publication
The first comparison is actual headline CPI against the approximately 3.7% annual forecast. Next, compare core CPI against the 2.5% estimate. Then examine monthly changes and the contribution from energy, shelter and services. Finally, watch the response in Treasury yields, the dollar, equity futures and crypto markets.
For digital assets, the transmission mechanism matters more than the inflation headline alone. A softer report that lowers yield expectations may improve risk appetite, while a stronger report that pushes yields higher could pressure leveraged positions and speculative assets. However, crypto prices can also move independently because of liquidity, positioning and asset-specific news.
The most useful approach is to define scenarios before the release, manage position size and avoid entering a trade solely because the first headline appears bullish or bearish.
The bottom line
#USCPISoon is a test of whether rising energy costs are driving a temporary acceleration in headline inflation or accompanying broader price pressure. The market enters the release with September headline CPI forecast near 3.7% and core CPI near 2.5%, but the actual figures will determine whether those expectations need to change.
The strongest signal will come from the relationship between headline inflation, core price momentum and the market’s reaction in yields and the dollar. For Gate Square traders, the priority is not to guess the number it is to prepare for the different outcomes, distinguish forecasts from actual data and let confirmed evidence guide risk decisions.
repost-content-media
BTC+0.86%
A single track has 4 million people, packed with young people! The number of applicants for the 2027 national civil service examination is expected to exceed 4 million.
The total forces deployed by both sides in the Russia-Ukraine war are estimated at approximately 1.5 million to 1.6 million.
It can be seen that the number of national civil service exam applicants is approximately 1.5 to 1.7 times higher than the total forces deployed in the Russia-Ukraine war.
Did any crypto folks also apply?
post-image
I may have drunk fake liquor last night—I’m actually seeing Bitcoin as bullish and feeling like it’s going up. Someone please talk some sense into me. Let’s see if you’re reading it the same way? Yesterday was really disgusting; I completely couldn’t figure out what this damn market maker was doing. $BTC I closed my short at a stop-loss and came out to watch the show—let’s see how you perform tonight. CPI data and Bitcoin trend analysis
post-image
BTC+0.93%
10.14 Bitcoin analysis
No breakthrough, no buildup. As long as Bitcoin does not break 8, the market will still trend upward later on. The daily chart has bottomed and rebounded and is now in a sideways accumulation phase; a catalyst is all that is missing for a move higher. I believe there will still be a small rebound this week.
Therefore, those without positions can look bullish below 83, with a target of 85–86.#btc
BTC+0.93%
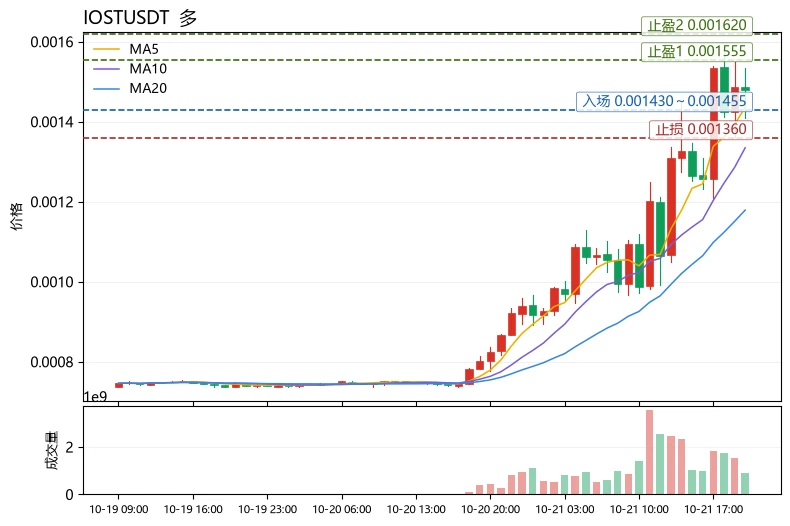
$TRUTH About to plunge sharply, brothers... The time to short has come... Target price: 0.165-0.0188 🚨🔴🚨
Open a short position on TRUTH 🔴 Continue opening short positions on $BA
🔴 Short $Q
post-image
TRUTH+22.01%
BA-1.53%
Leading gainers heated up again: $TRUT led the way with a gain of +42.44%; $Q followed with a gain of +38.60%; $BTW rose +30.47%, while BAT gained +25.46%.
These high-beta stocks have clearly regained upward momentum, but blindly chasing prices becomes highly dangerous after such sharp gains. The best strategy now is to wait for a pullback, a retest of support, and clear signals of continuation rather than entering at elevated levels.
post-image
Is anyone still holding long positions
post-image
Gold is under pressure as bears step up their attack; watch the short-term resistance at 4170!
Gold first fell and then rose in early trading yesterday, but ultimately came under pressure and moved lower in the late session, so the overall outlook was correct. The market currently appears relatively calm, and the Consumer Price Index (CPI), Producer Price Index (PPI), and the Federal Reserve Chair’s speech due later this week will be key to breaking the deadlock.
View on today’s gold trend
Technically, since peaking near $4,700 in late August, gold has continued to form lower highs and lower l
post-image
BTC+0.86%
#GateX红牛F1新加坡站夺冠 #每周来晒 F1×Web3 Crossover: Gate Innovations to Look Forward To
Gate can launch full-lifecycle Web3 experiences for racing events, covering three core areas: digital collectibles, trading interactions, and offline benefits
I. In-Depth Extensions of Event-Specific Digital Collectibles
1. Dynamic NFTs Highlighting Individual Races
Launch dynamic NFTs featuring winning moments from individual races such as the Singapore Grand Prix, recording Verstappen’s finish on-chain and including an on-chain certificate of the driver’s signature.
2. Season-Wide Achievement Collection System
Coll
GT+0.09%
  • 2
Blur Suddenly Announces Plans to Shut Down Its Website Frontend! BLUR crashes over 27. Is the former
live-cover
LIVE1,605
🔍 Market conditions can change in an instant—what really matters is understanding what the market is really trading!
Rotation among market hot spots, shifts in capital flows, macro news... Behind every market move lies market logic worth watching.
📊 Gate Live’s professional analysts provide real-time market analysis, breaking down key trading signals from market trends to popular narratives and helping you make sense of the market faster.
Less chasing pumps and selling dips, more independent judgment!
👉 Tune in to Gate Live: https://www.gate.com/live
GateLiveChinese
🔍 Market conditions can change in an instant—what really matters is understanding what the market is really trading!
Rotation among market hot spots, shifts in capital flows, macro news... Behind every market move lies market logic worth watching.
📊 Gate Live’s professional analysts provide real-time market analysis, breaking down key trading signals from market trends to popular narratives and helping you make sense of the market faster.
Less chasing pumps and selling dips, more independent judgment!
👉 Tune in to Gate Live: https://www.gate.com/live
repost-content-media
  • 2
💰 $12.21 MILLION IN NET INFLOWS — IS SMART MONEY POSITIONING FOR THE NEXT MOVE? 🚀
📊 Gate ranks #2 globally in 24-hour net inflows among centralized exchanges, according to the DefiLlama data cited in this report, with approximately $12.21 million in net inflows.
But here's the bigger question: Where could the capital flow next? 👀
💎 BTC & ETH: Could major cryptocurrencies attract fresh buying pressure?
🔥 GT & Trending Sectors: Will renewed trading activity create opportunities in GT, meme coins, and other high-interest sectors?
📈 Market Momentum: Could sustained inflows signal improving
post-image
BTC+0.93%
ETH+0.88%
GT+0.09%
MEME-0.13%
  • 5
  • 1
10.14 ETH Analysis
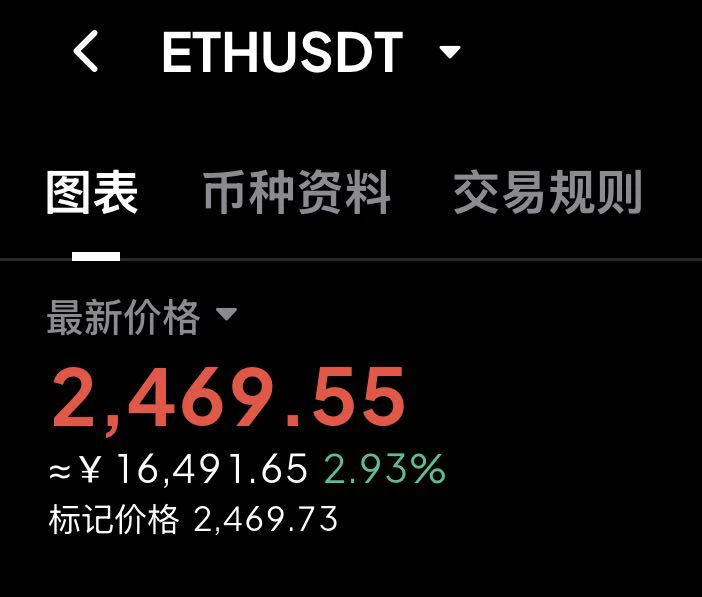
Analysis: Short around 2520-2540 on the rebound, stop-loss at 2560, first target 2480, second target 2440
The actual 1H chart shows that the price began an oversold rebound from the phase low of 2407.00, surged to a high of 2537.77 before entering high-level range-bound consolidation, and is currently quoted at 2508.91. Overall, this is a technical recovery following a sharp decline; the broader bearish trend structure has not been reversed, rebound momentum is gradually weakening, selling pressure above continues to emerge, and the price has repeatedly fallen back under pre
post-image
BTC+0.93%
The biggest trap in CPI market moves: Why doesn’t BTC rise when the data is bullish?
Many traders believe that as long as US CPI comes in below expectations, BTC, US stocks, and gold will definitely rise; if CPI comes in above expectations, the market will definitely fall.
But real financial markets are often not that simple.
First, the market trades the gap between expectations and reality, not simply whether the data is good or bad. If investors have already bet on cooling inflation, even if CPI meets expectations, the bullish news may already be priced in. After the data is released, profit
NVDA+0.92%
  • 21
10.14 Bitcoin Analysis
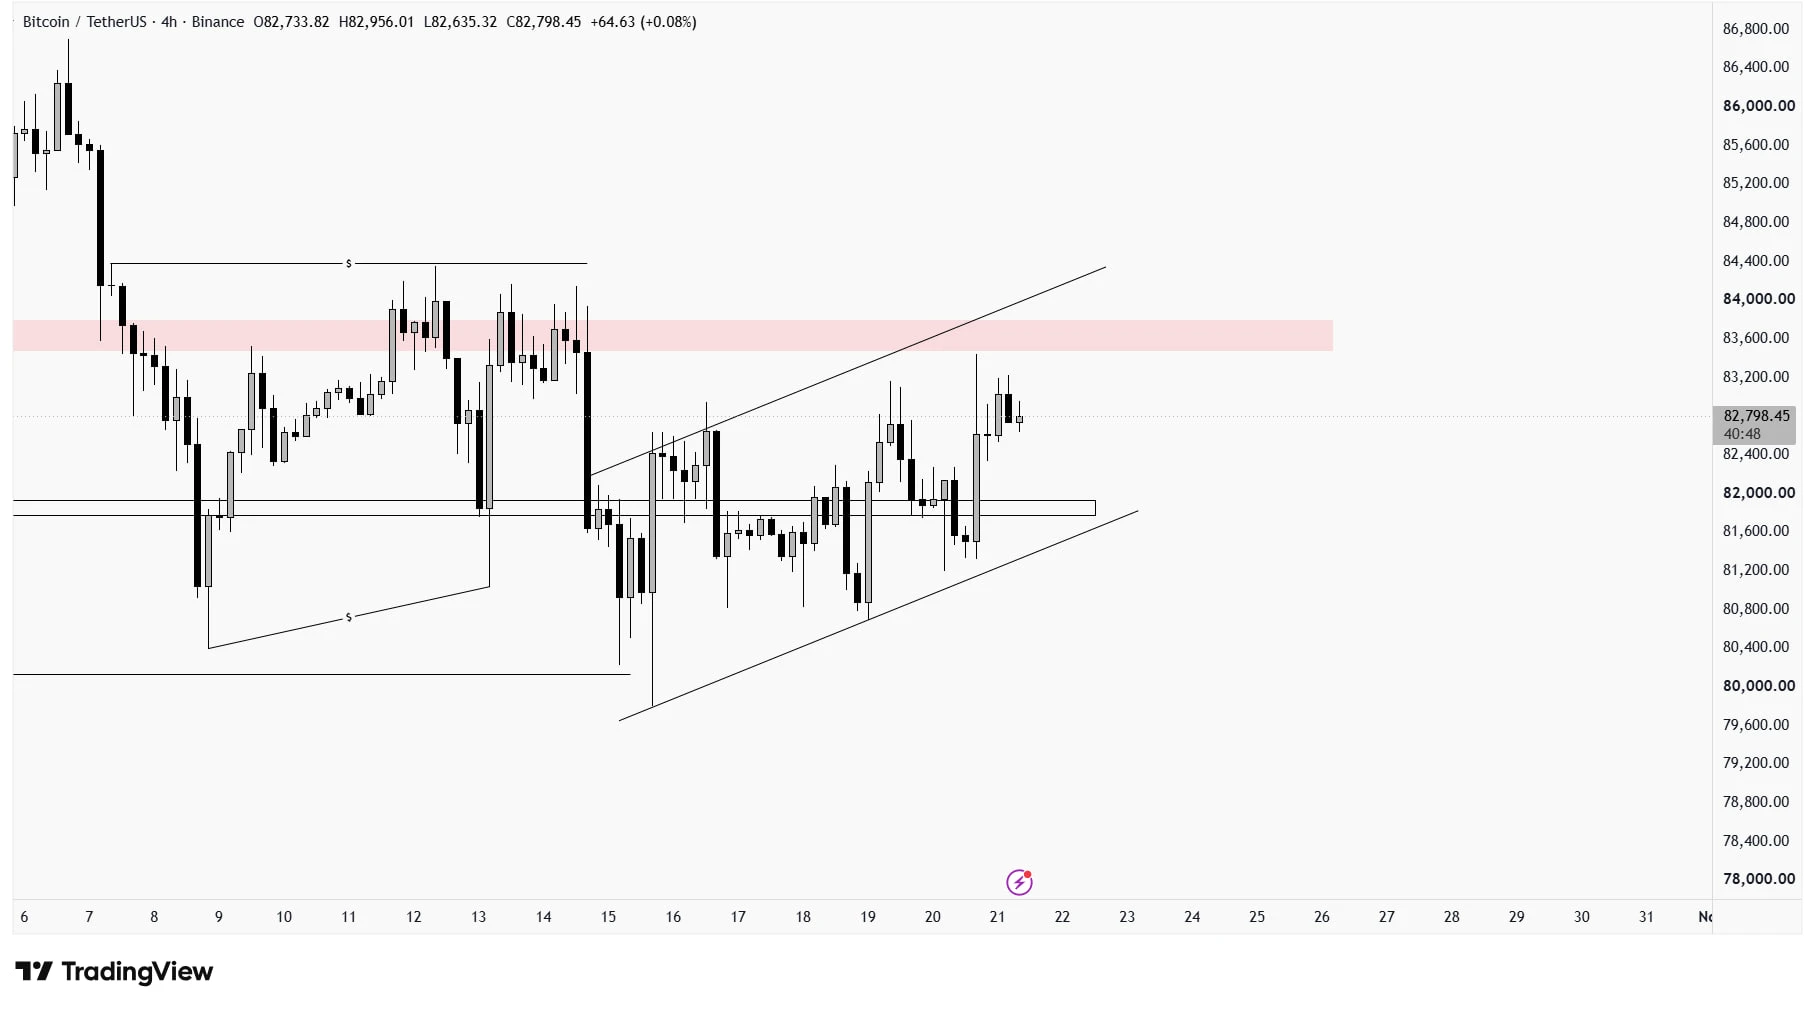
Analysis: Short near 83800-84200 on a rebound, stop-loss at 84500, first target 82800, second target 81500
The oversold rebound began from the period low of 80985.0, surged to a high of 84134.2, and then entered high-level consolidation. The current price is moving sideways near the medium-term moving average. Overall, this is a technical recovery following a sharp decline; the broader bearish trend structure has not been reversed, rebound momentum is gradually weakening, and selling pressure above continues to emerge. At 20:30 tonight, the U.S. Bureau of Labor Statistic
post-image
BTC+0.93%
Load More

Join 40 M users in our growing community

⚡️ Join 40 M users in the crypto craze discussion

💬 Engage with your favorite top creators

👍 See what interests you

Trending Topics

DrLinHanSpeaksAtOxfordUnion

134.67k Views1.85k Discussing

Gate Founder & CEO Dr. LinHan has been invited to speak at the Oxford Union, a 200-year-old debating society that has hosted Einstein, Hawking, and Churchill. He will discuss crypto, the future of money, and what Gate Money means for global value movement. First trading platform on this stage. Nov 12 at Oxford. [👉 Learn more](https://oxford-union.org/event-6845310)

USCPISoon

24.63k Views1.74k Discussing

GateWCTCS9GlobalTradingCompetition

36.76k Views5.94k Discussing

View More