





Square
Following
Hot
News
Profile
Share your thoughts
placeholder
Article
$BTC The bull market launch script from 2023 has appeared again!
The two market moves are strikingly similar. Both saw strong rebounds from cycle bottoms. Both experienced two rallies followed by deep pullbacks. If history repeats itself, the real major uptrend may still be ahead! Comparing BTC’s price movements in 2023 and 2026, clear similarities can be found between the two market moves. In 2023, BTC started from a cycle low of around $15,500, then experienced multiple rallies, pullbacks, and volatile shakeouts before finally breaking through previous resistance and surging to around $29,00
post-image
BTC+0.36%
ZEC+0.67%
$CHIP Market makers can no longer withstand the selling pressure; the price seems poised to fall.📉🔥
🚨 Hurry and open a short position now! 🛑 Stop-loss: 0.072 Take-profit: 0.0615-0.056$CHIP 👇
post-image
CHIP+28.88%
GT’s recent rebound reminds me why patience and a clear plan matter. My approach is to buy at lower prices and take profits when my targets are reached. Stay focused on the goal, but avoid chasing every rise.
I see potential in GT because of its role in the Gate ecosystem and its token burn mechanism. However, burns do not guarantee higher prices. Platform dependence, regulation and market volatility remain real risks.
For me, staying committed also means protecting my capital and knowing when to take profit.
What is your view on GT? Are you holding for the long term or taking some profits dur
post-image
GT+3.00%
btc market update
live-cover
LIVE1,526
🚨 BITCOIN IS FLASHING THE SAME SIGNAL THAT MARKED EVERY MAJOR BOTTOM
Almost nobody is paying attention to the monthly RSI.
Look at what happened the last 5 times:
2015 → Cycle Bottom
2019 → Cycle Bottom
2020 → COVID Crash
2022 → Cycle Bottom
2026 → Cycle Bottom?
Every major low came with the same warning from the monthly RSI.
And now that signal is flashing AGAIN.
Most people are waiting for Bitcoin to recover before buying.
I'm watching the exact conditions that appeared BEFORE the biggest recoveries.
I called the $17K bottom in 2022.
Then the $126K top in 2025.
If history repeats, t
BTC+0.36%
#SimpleEarnUSDTLimitedTime11%APR Simple Earn USDT Limited Time 11% APR. A New Opportunity to Make Your Stablecoins Work for You
In the cryptocurrency market, many people focus entirely on price movements, looking for the next big rally or the perfect entry point. However, there is another side of crypto that deserves attention. Sometimes, the smarter approach is not about making more trades but about exploring opportunities that allow your existing assets to generate potential returns.
Gate Simple Earn USDT Limited Time 11% APR brings this idea into focus. With a promotional annual percentage
  • 4
If they’d had this back then, Yu the Great wouldn’t have struggled so much with the floods
post-image
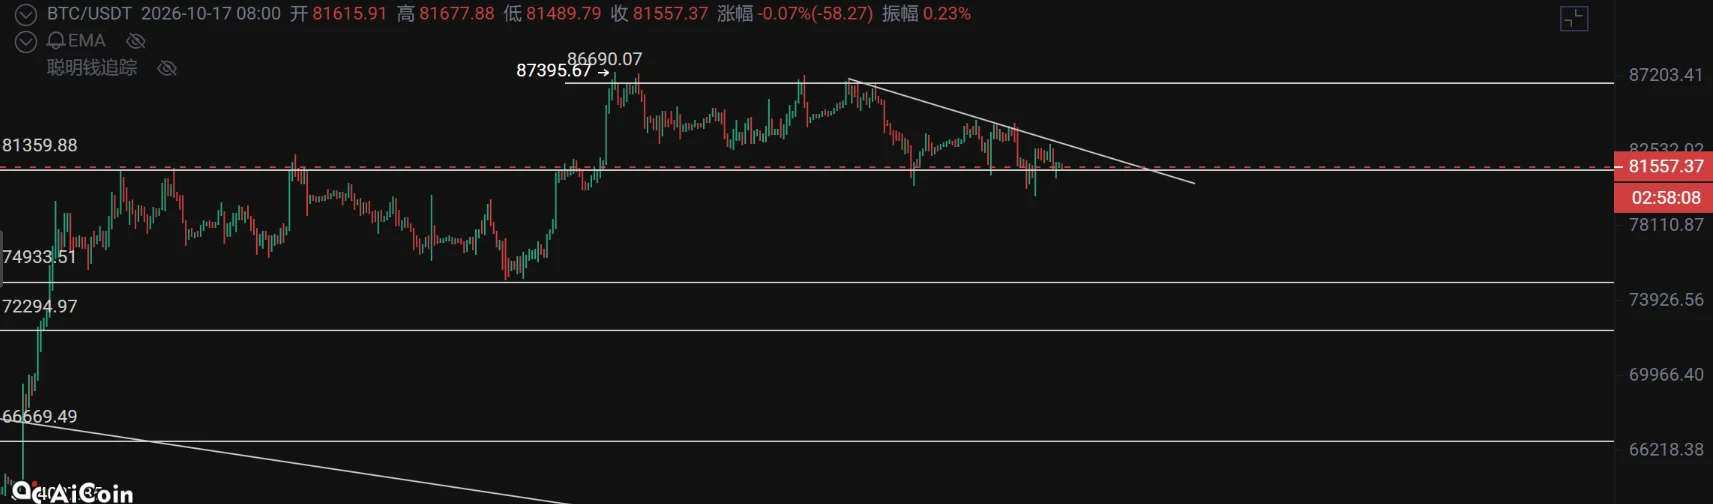
$BTC I think the probability of dropping below 80k is definitely much higher than rising above 87,000. Even if a bull market comes, it will still flush out leveraged longs. If there is no bull market, it will plunge all the way down. Opening a short position now is the right choice.$BTC
post-image
BTC+0.39%
Bottom Stabilization and Accumulation of Momentum, Gold Expected to Trade Volatile with an Upward Bias Next Week
From the daily chart perspective, gold prices stabilized and rebounded after bottoming out. The current price has recovered to move above the short-term moving averages, while support from the lower Bollinger Band has held effectively, with a bottoming pattern gradually taking shape. The RSI indicator has turned upward from a low level, bullish momentum continues to recover, and the oversold rebound has already begun.
Next week will bring several key economic data releases. If the d
post-image
XAU+0.03%
In my view:
The only truly valuable asset is food.
Next come gold and the US dollar; nothing else can maintain a stable value!
post-image
GLDX+1.02%
PAXG+0.03%
Silver maintains its bearish structure. The decline appears likely to continue to $55 this week as well. If another interest rate hike comes from the US, the likelihood of this decline will strengthen. #XAGUSD #Silver
⚠️ This is not investment advice.
post-image
XAGUSD+2.77%
Why is everyone suddenly watching SYMBOL right now?

$RLC /USDT - LONG

Trade Plan:
Entry: 1.0706 – 1.1004
SL: 0.9425
TP1: 1.1928
TP2: 1.2643
TP3: 1.3715

Why this setup?
Why now? The daily trend is bullish and the 4h setup is armed with a 95% confidence score, meaning the macro structure is fully aligned for a long. The 1h price sits at 1.0855, which is also the exact entry reference, placing you right at the trigger line. The 15m RSI at 65.08 shows room to run before overbought, while the 1h ATR of 0.059592 tells you volatility is expanding, fueling a potential move toward TP1 at 1.1928 a
RLC+11.20%
  • 1
Market update btc
live-cover
LIVE2,835
Actually, doing daily-chart swing trades
with something like BCH (daily charts are all short-term now)
is quite attractive
Before the next major bull run begins, the market will most likely be choppy with an upward bias
Use the previous low as the stop-loss (around 10%)
The risk-reward ratio is quite favorable
post-image
BCH-0.29%
Looking at this data, it should be pushed upward
Target: around 84200
spot ↗️
perp ↘️
OI ↗️
post-image
$MAGIC This market maker is really nice—it gave a heads-up when it was about to rise, and even after dropping so much, it still retraced, giving us a chance to get out
post-image
MAGIC+8.68%
$SAAR is breaking out, mini game is launching very soon✅
You won’t get a better entry than this, $5m run is starting now and a lot will be left behind 🤝
The team behind $SAAR is building everyday, this will eventually trade at multiple X’s very soon ✅
CA - 8H5yfL1GoDETLDaLYZzrgQuZs37eiKJjdfP21b6ypump
$ADA ADAUSDT – 1H Market Structure Analysis | Supply, Demand & Liquid
Cardano (ADA) is showing an interesting market structure after a strong bearish move toward the support zone around 0.2240–0.2255. Buyers stepped in from this area, creating a recovery and pushing price upward toward the previous swing high and supply region.
However, after taking liquidity above the previous highs, price faced selling pressure and started forming lower highs. This suggests that bearish momentum may be returning in the short term.
1. Resistance Zone – 0.2570–0.2590
The upper resistance zone represents an are
post-image
ADA-3.21%
“I will find the formula for reversing time”
post-image
#USOpensRussianDieselImports US Opens Russian Diesel Imports, Energy Markets Face a New Turning Point
The decision to open the door to Russian diesel imports in the United States puts energy markets back in focus. At a time when fuel prices, geopolitical tensions, supply chains, and global trade policies are closely connected, even a limited change in import rules can attract significant attention from traders and investors.
Diesel is one of the most important fuels in the global economy. It powers trucks, agricultural machinery, industrial equipment, ships, and many parts of the logistics net
BTC+0.36%
  • 4
Load More

Join 40 M users in our growing community

⚡️ Join 40 M users in the crypto craze discussion

💬 Engage with your favorite top creators

👍 See what interests you

Trending Topics

GateAtTOKEN2049

40.98k Views21.71k Discussing

Gate brought a series of major events to TOKEN2049 Singapore! From the official launch of Gate Money to the F1 Red Bull driver meet-and-greet and the Gate Gala, we witnessed a new chapter of "One Gate, Borderless Finance." Which moment from TOKEN2049 stood out most to you?

LedgerLossesNear90Million

39.4k Views255 Discussing

GateWCTCS9GlobalTradingCompetition

34.02k Views5.06k Discussing

View More