
Square
Following
Hot
News
Profile
Share your thoughts
placeholder
Article
$BTC BOOM💣It's about to explode soon; the big player is starting to accumulate, forming a daily double bottom, with a large pool of liquidity above🤩
Long, long, long🔥🔥TP1: 82500 TP2: 84000 TP3: 87000-90000 SL: 78200$AG $ETH
post-image
BTC+0.01%
AG-0.65%
ETH-0.66%
$Online Loan Life: Borrow money to enter the market, stay up all night watching charts, and keep adding to the position.
Act like nothing’s wrong during the day; stare blankly at red candles at night.
When liquidation hits, debt collection texts arrive more punctually than market moves.
Interest keeps accruing, but the position is down to zero.
We’re not gamblers, just ordinary people trying to survive in crypto.
Online loan life: the most honest portrait of crypto bros.
post-image
Trenches
AGT
A
bade
b
AGT
0x5d...e274
Market Cap
$.
Change
.
24h Vol
$.
Holders
.
CNPY
C
bade
b
CNPY
0xc6...ddd2
Market Cap
$.
Change
.
24h Vol
$.
Holders
.
COVENANT
C
bade
b
COVENANT
0xcd...de79
Market Cap
$.
Change
.
24h Vol
$.
Holders
.
Q
Q
bade
b
Q
0xc0...0589
Market Cap
$.
Change
.
24h Vol
$.
Holders
.
Gato
G
bade
b
Gato
55A3...pump
Market Cap
$.
Change
.
24h Vol
$.
Holders
.
Money is already piling in to assets pre-market, have they forgotten how these external markets operate? Its about to get very violent.
Hyperliquid, slaughter house edition.
post-image
HYPE-2.14%
$ELA SEND IT TO THE STARS!
post-image
ELA+8.96%
$AGT BOOM😨 It’s flying up again, damn. LONG was doing great, then turned around and went SHORT. Nothing to do but keep grinding; the rewards will come soon😎😎
SHORT SHORT SHORT🔥🔥AGT congabeo$BT $MAGMA
CPIWatch
post-image
MAGMA+3.50%
Market anylysis today BTC and other coin 👛🪙
live-cover
LIVE1,737
Set it up this way to automatically clean up 99% of comments.
$EPIC It surged 18% in a day, briefly touching 0.3350 before dumping back to 0.2884. That long upper wick is no joke.
First, the signal: this is a classic high-volume spike and retracement. The 24-hour trading volume of 72.2M alongside an 18.29% gain shows the volume is real, but that wick at 0.3350 indicates very heavy overhead selling pressure. From the low of 0.2182 to 0.3350, the price gained 53%, so profit-taking at this level is perfectly normal. Technically, 0.2884 sits just below the midpoint of the intraday gain, putting it in the pullback confirmation phase—not a breakout entry poin
EPIC+23.34%
Online Lending Life with a market cap of 110k—are you sure you don't want to buy?
If you added to your ETH position at 2355, keep an eye on your profits; intraday long positions are making money
post-image
Bitcoin at $81,500: Bulls and Bears in a Standoff
Bitcoin is trading around $81,500 on Saturday, October 17, 2026, caught in a notable technical standoff where short-term bearish moving averages clash with a significantly healthier long-term structure.
With a market cap of roughly $1.639 trillion, daily trading volume of $13.967 billion, and a 24-hour range of $81,108.80 to $81,733.01, the market has settled into a narrow consolidation phase, leaving traders to decide whether the latest accumulation is the start of a recovery or just a pause before support gets tested again.
⚠️ Personal market
post-image
BTC+0.01%
Gate Social Rewards Are Here — Win Up to 10,000 USDT!
Growth Points Lucky Draw Phase 2️⃣ 5️⃣ is ongoing, with plenty of rewards up for grabs!
🎯 How to Earn Growth Points
1️⃣ Square tasks — post, like, comment, and share, up to 600 pts/day
2️⃣ Live tasks — watch, like, comment, share streams, up to 300 pts/day
3️⃣ Chat tasks — join discussions and share trading cards, up to 90 pts/day
4️⃣ Creator tasks — post token or trading card content, up to 300 pts/task
Test your luck today 👉 https://www.gate.com/activities/pointprize?now_period=25
$BTC $ETH $ZEC
post-image
Gate_Square
Gate Social Rewards Are Here — Win Up to 10,000 USDT!
Growth Points Lucky Draw Phase 2️⃣ 5️⃣ is ongoing, with plenty of rewards up for grabs!
🎯 How to Earn Growth Points
1️⃣ Square tasks — post, like, comment, and share, up to 600 pts/day
2️⃣ Live tasks — watch, like, comment, share streams, up to 300 pts/day
3️⃣ Chat tasks — join discussions and share trading cards, up to 90 pts/day
4️⃣ Creator tasks — post token or trading card content, up to 300 pts/task
Test your luck today 👉 https://www.gate.com/activities/pointprize?now_period=25
$BTC $ETH $ZEC
repost-content-media
BTC+0.01%
ETH-0.66%
ZEC-1.66%
PPI rises 6.3% year over year, highest since 2022; energy is “eating” the entire economy
Yesterday, when the PPI data came out, I was looking at Gate’s candlestick chart. The moment the numbers appeared, my first thought was, “I must be reading that wrong.”
September PPI rose 6.3% year over year, versus expectations of 5.4% and a previous reading of 5.4%. It rose 1.3% month over month, versus expectations of 0.6% and a previous reading of 0.4%. Core PPI rose 5.0% year over year, versus expectations of 4.4%. Core PPI rose 0.7% month over month, versus expectations of 0.3%. All figures significa
MU-5.66%
#美股存储板块跌幅扩大
The core question is whether this represents a healthy correction following a rally driven by artificial intelligence (AI), or the beginning of a deeper repricing process within the storage sector. Rather than buying simply because prices have fallen, it would be more prudent to focus on earnings expectations, memory pricing, and whether each company can maintain its profit margins.
My perspectives on storage sector stocks:
* Micron (MU): Monitor demand for DRAM and HBM, memory growth linked to AI, and gross profit margin forecasts. Strong AI demand could bolster earnings, though
post-image
ybaser
#美股存储板块跌幅扩大
The core question is whether this represents a healthy correction following a rally driven by artificial intelligence (AI), or the beginning of a deeper repricing process within the storage sector. Rather than buying simply because prices have fallen, it would be more prudent to focus on earnings expectations, memory pricing, and whether each company can maintain its profit margins.
My perspectives on storage sector stocks:
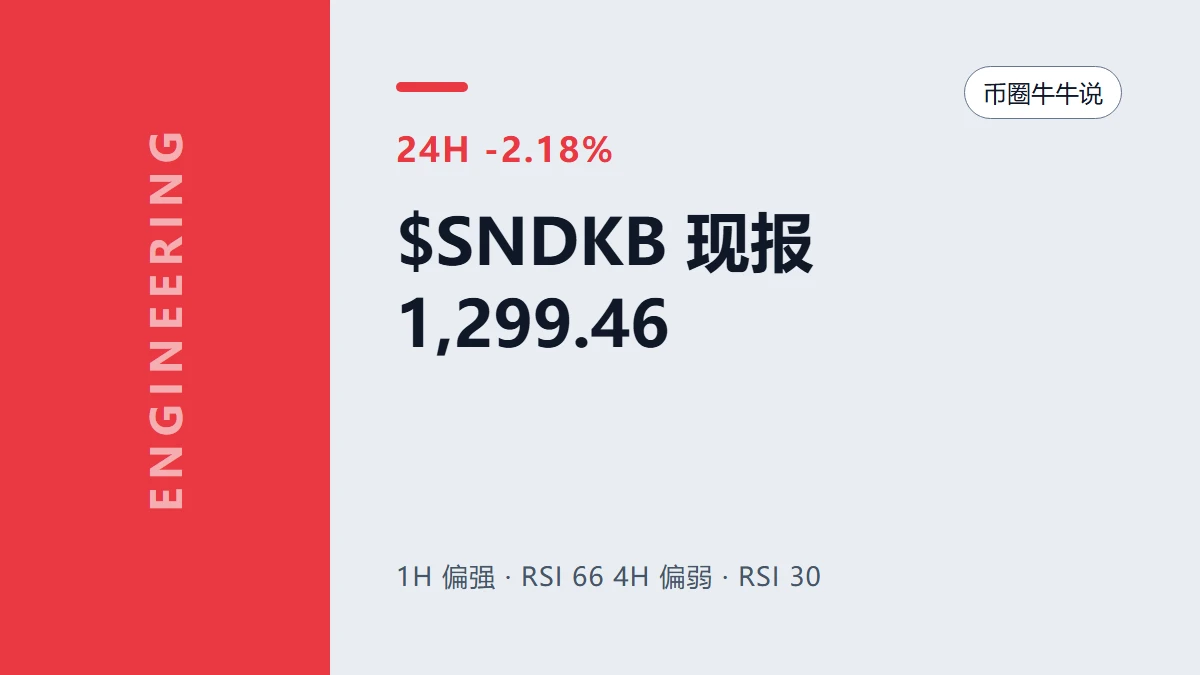
* Micron (MU): Monitor demand for DRAM and HBM, memory growth linked to AI, and gross profit margin forecasts. Strong AI demand could bolster earnings, though these expectations may already be priced into the stock.
* SanDisk (SNDK): Focus on NAND flash pricing, demand for enterprise SSDs, and the sustainability of any earnings recovery. NAND supply and price cycles can make this stock particularly volatile.
* Western Digital (WDC): Evaluate "nearline" (high-capacity/accessible) HDD demand from AI data centers, cloud computing expenditures, and free cash flow. The factors influencing HDD demand differ from those affecting NAND and DRAM.
* Seagate (STX): As data center storage requirements grow, keep an eye on demand for high-capacity drives, pricing power, and profit margins.
* Track NAND market conditions, enterprise SSD adoption rates, and the company's valuation relative to earnings expectations.
What signs might justify rebuilding a position? I would look at the following three points:
* Stabilization of fundamental indicators: A halt in the deterioration of memory and NAND prices, company forecasts, and earnings estimates.
* Confirmation through price action: Stocks forming higher lows and reclaiming key moving averages, accompanied by stronger trading volume.
* Attractive valuation: Expected earnings growth that justifies the current price, even under less optimistic scenarios.
A decline in a stock price is not, by itself, a buy signal. If earnings estimates are falling faster than the stock price, the valuation may not have actually become cheaper.
Rather than buying the entire storage sector indiscriminately, I prefer to differentiate between individual companies. While AI demand serves as a long-term tailwind, memory, NAND flash, and hard disk drives each have their own unique supply cycles, competitive pressures, and profit margins.
An important distinction: A pullback driven by profit-taking is fundamentally different from one caused by weak forward guidance or falling memory prices. The latter scenario warrants a much more cautious approach. Which of these stocks—MU, SNDK, WDC, or STX—are you following most closely? I can help you compare their valuations, earnings outlooks, technical levels, and the potential factors that could support a recovery.
$MU ‌$SNDK ‌$WDC ‌$STX ‌
repost-content-media
MU-5.66%
SNDK-6.90%
  • 5
$BR Long setup... Buyers are back in force!
BR is currently trading around 0.453 after a sharp rebound. Buyers are trying to hold above the 0.44 support zone, creating the potential for further upside. Entry: 0.445–0.455 (long) Take-profit 1: 0.475 Take-profit 2: 0.495 Final target: 0.530 Stop-loss: 0.425 As long as BR holds above 0.44, the rebound could continue. A break above 0.475 could further strengthen momentum, pushing the price toward 0.50 and higher. Watch support closely and manage risk. $BR
post-image
BR+20.33%
Crypto Trade Today
live-cover
LIVE897
#TeslaRoadsterSparksMemeCoinSurge
Tesla’s Rocket Roadster Meets Crypto Hype: Can FTR Turn Viral Attention Into a Lasting Rally?.
The connection between futuristic technology and cryptocurrency speculation is becoming increasingly visible. Tesla’s rocket-powered Roadster demonstration has created a powerful online narrative, attracting attention from technology enthusiasts, traders, and meme-coin communities. Now, the key question is whether this attention can translate into sustained market participation or whether the excitement will fade as quickly as it appeared.
For me, this story is not
$CT I took the full -12.73% hit on this move: entered at 0.385, cut at 0.34, down 11 points. The post-mortem is simple: greed. Before the Fed minutes, I clearly saw $CT 24h volume shrink to just over 20M and large on-chain transfers start flowing out, but I still fantasized that dovish minutes would spark a rally. Instead, the minutes were hawkish, and $CT plunged straight through 0.35, hitting a low of 0.3155. I set my stop at 0.34 and at least stuck to my discipline, but the entry thesis itself was wrong—loading up on a small-cap token ahead of a macro event; correlation is no excuse, I was
CT-13.88%
Gate square new creator Share to win red packet
post-image
The most unusual detail in today’s market action isn’t the declines themselves, but relative strength: $STRK fell 12.04%, $BAT fell 9.28%, while $ENA
in the same sector fell just 5.23%. Its RSI of 37.4 is also higher than STRK’s 31.3 and BAT’s 36.7. The smaller decline and higher indicator suggest selling pressure has been released more gradually, with funds not rushing for the exits.
But relative resilience doesn’t mean a reversal is underway. ENA is currently at 0.1885, still below MA5=0.18964 and MA20=0.193345, with the bearish moving-average alignment yet to recover. The MACD histogram
post-image
STRK-11.92%
BAT-10.46%
ENA-4.54%
Load More

Join 40 M users in our growing community

⚡️ Join 40 M users in the crypto craze discussion

💬 Engage with your favorite top creators

👍 See what interests you

Trending Topics

USSeptemberPPIBeatsExpectations

91.35k Views1.93k Discussing

US September PPI came in at 6.3% YoY, well above the 5.3% market expectation, pointing to renewed producer-side inflation pressure. Weekly jobless claims were 199K, broadly in line with forecasts. Could hotter inflation further reduce room for rate cuts, and what does it mean for $BTC, US stocks, and gold?

GateWCTCS9GlobalTradingCompetition

37.87k Views6.68k Discussing

GateBTCAndETHFuturesVolumeRanksTop3

53.8k Views1.81k Discussing

View More