
Square
Following
Hot
News
Profile
Share your thoughts
placeholder
Article
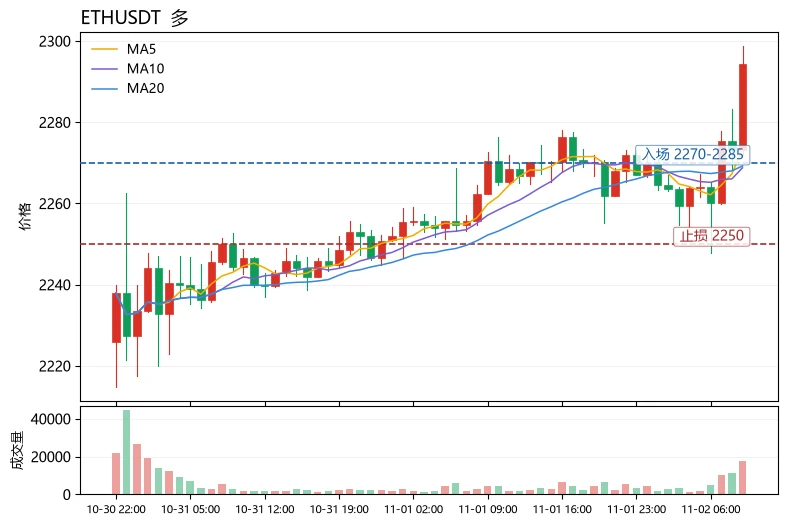
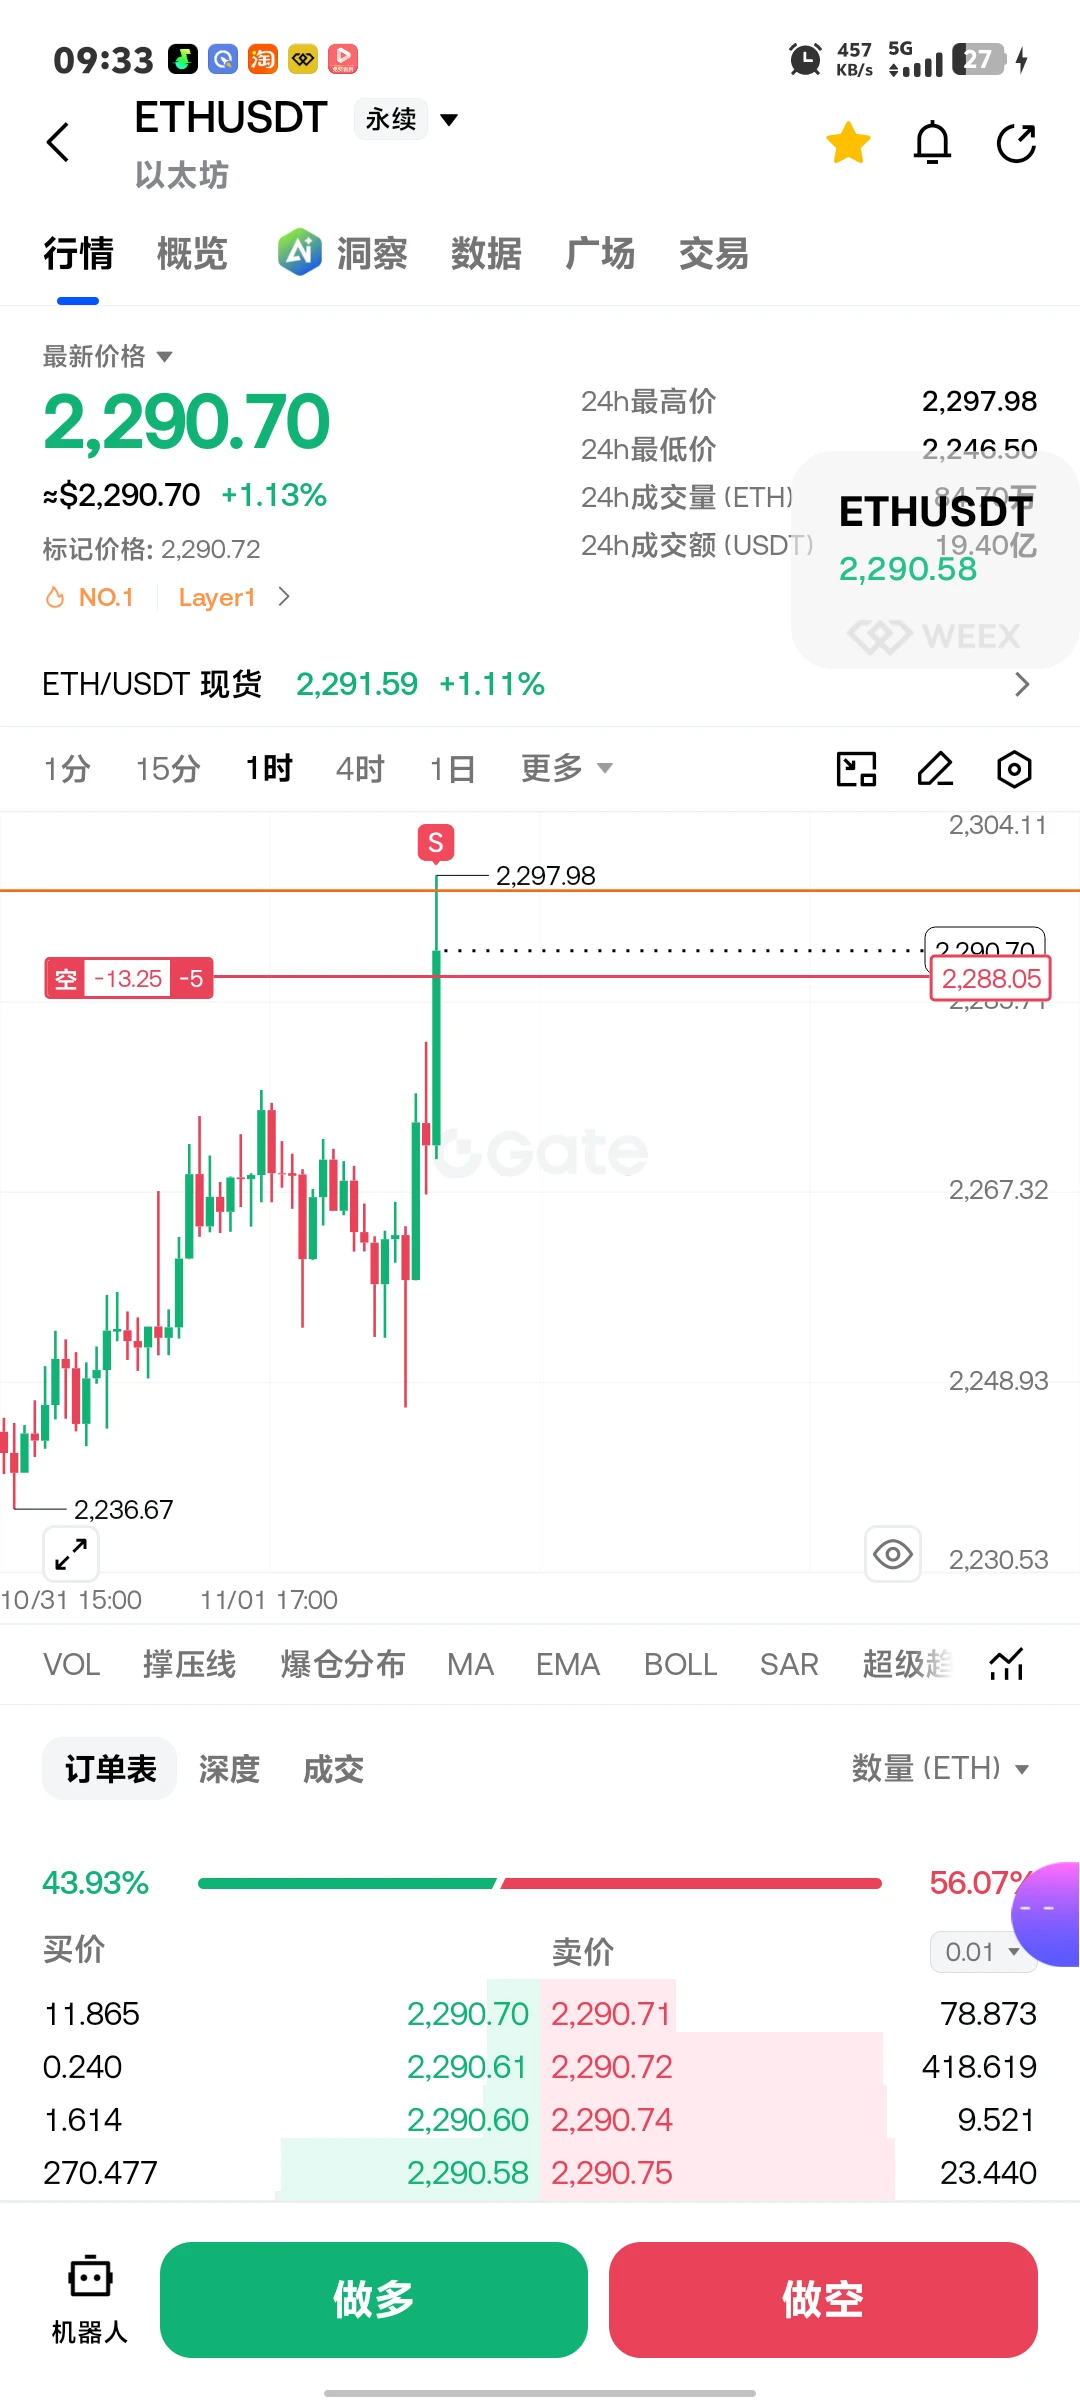
Is this heading for a break above 2,300? $ETH
post-image
ETH-1.23%
Today is Monday, November 2. After moving sideways over the weekend, Ether briefly dipped to 2,246 this morning before rebounding. Those who have already taken profit can continue shorting at 2,270. It will keep falling tonight, heading toward around 2,200.
post-image
ETH-1.23%
  • 5
Trenches
ZIG
Z
bade
b
ZIG
0x8c...1145
Market Cap
$.
Change
.
24h Vol
$.
Holders
.
uni
u
bade
b
uni
jM9r...pump
Market Cap
$.
Change
.
24h Vol
$.
Holders
.
Anakin
A
bade
b
Anakin
Exxz...pump
Market Cap
$
Change
.
24h Vol
$.
Holders
.
IDOL
I
bade
b
IDOL
0x3b...ab07
Market Cap
$.
Change
.
24h Vol
$.
Holders
BTC
B
bade
b
BTC
C5xp...pump
Market Cap
$.
Change
.
24h Vol
$.
Holders
.
Can you still go long amid fearful sentiment? Yes, but only with a “small position and tight stop,” not a heavy bet.
$ETH The current price is 2294.43, above the Bollinger upper band at 2284.13. MA5 (2273.43) is above MA20 (2269.24), and the MACD histogram remains bullish at +1.501; the trend structure is intact. However, RSI at 69.3 is nearing overbought territory, and the 30-candle range is only about 2.22%. Volatility is low, meaning an upward breakout needs confirmation from increased volume; otherwise, it could be a false breakout followed by a quick pullback. The funding rate is -0.0015%
post-image
TRX+0.42%
$BTC Listen to me, friend… Get ready to go heavily long… Thank me later. Stop-loss: $77500 Take-profit: $79000 - 80000 - 81000 Go long now $BTC 👇
post-image
BTC-0.67%
morning market
live-cover
LIVE1,928
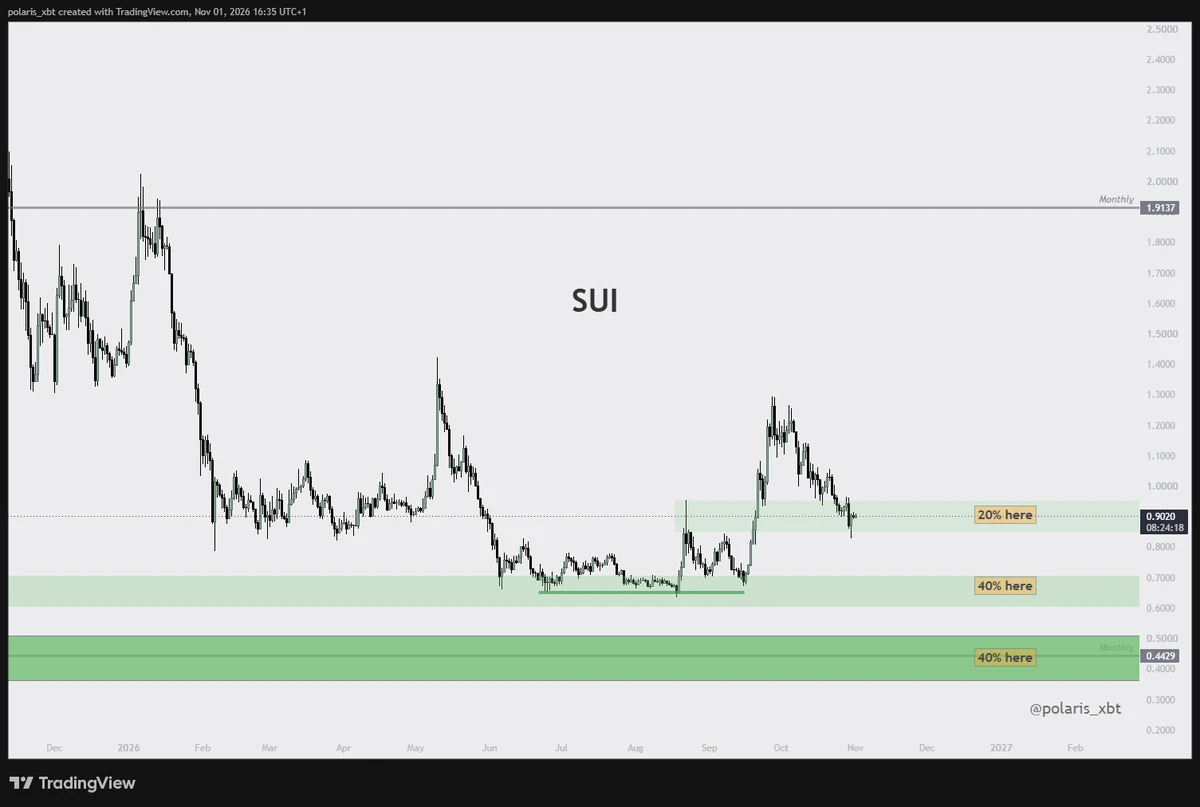
$SUI
First DCA zone tagged.
Lower zones have much more limit orders and will come with larger correction in BTC if we get it (70% odds imho)
post-image
SUI-1.05%
BTC-0.67%
Rise a notch! 500⚡️➕30⚡️
For what you’ve decided to do, stay calm on the outside, yet let your heart surge. $BTC $ETH
BTC-0.67%
ETH-1.26%
[NEW STREAMER]market update
live-cover
LIVE1,659
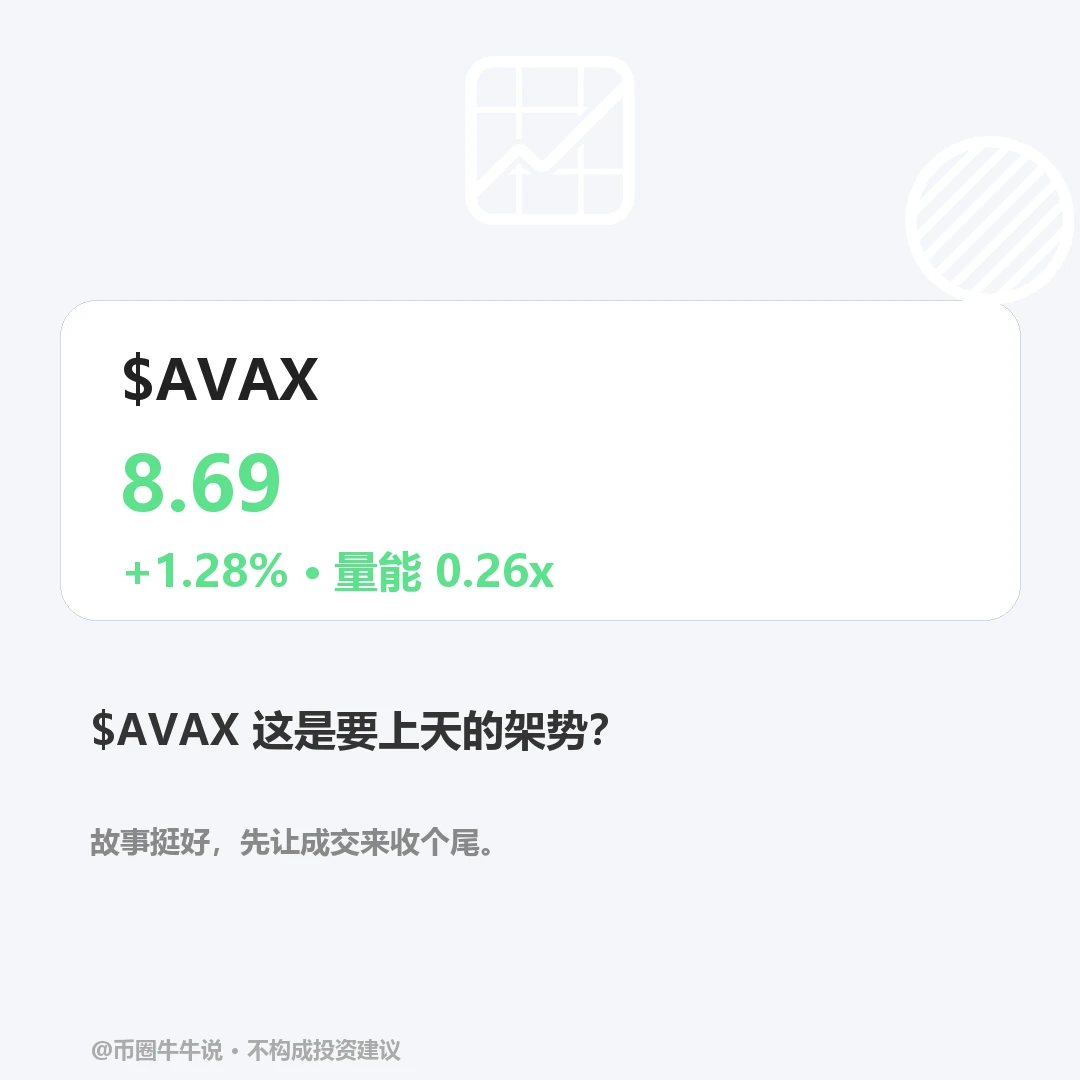
Divergence: $AVAX is currently at 8.687, weak on the 1-hour chart but strong on the 4-hour chart, with trading volume at only 25.8% of average. How should this contradiction be interpreted?
The 1-hour RSI has fallen to 34.4, indicating continued short-term selling pressure, while the 4-hour timeframe is signaling strength. This kind of conflict between timeframes often means the direction is still unconfirmed. Without volume confirmation, any short-term rebound or pullback could be a fake move.
If the price can move above 9.06 and hold there, the bullish outlook would be worth reassessing; if
post-image
AVAX-0.10%
Many people mistake a sharp rise for strength, then chase high-volatility coins and get tossed around; true relative strength should be measured against others in the same sector—the one with lower volatility and a steadier structure is often where capital is willing to stay.
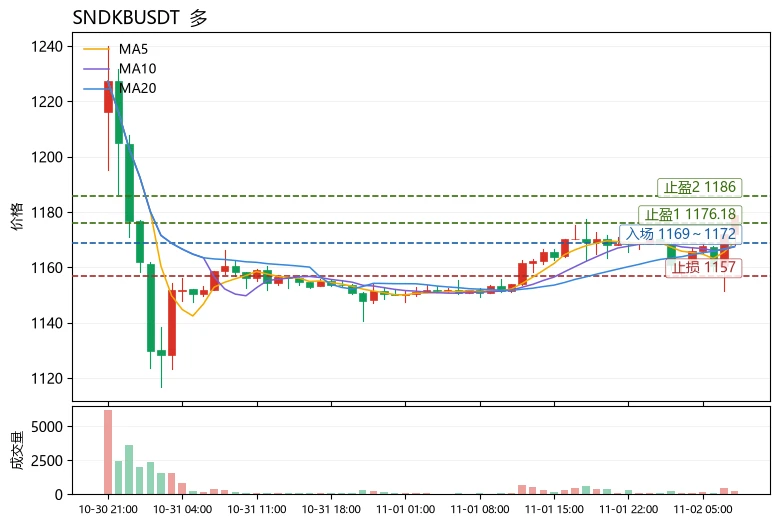
$SNDKB is currently at 1178.89, up 2.41% in 24h, with a trading volume of 7.6M USDT. Compared side by side with the concurrently active $TRUMP and $NEAR : $TRUMP is up 9.75%, but its RSI has already reached 72.8, its 30-candle range is about 12.28%, and its funding rate is +0.0050%, making it a high-volatility asset wi
post-image
SNDKB
SNDKBSNDKB
Four.meme
MC:$3.87KHolders:1
0%
TRUMP-0.95%
NEAR+1.17%
So people with too strong a sense of morality can't make money 🥲
11/2 Gold
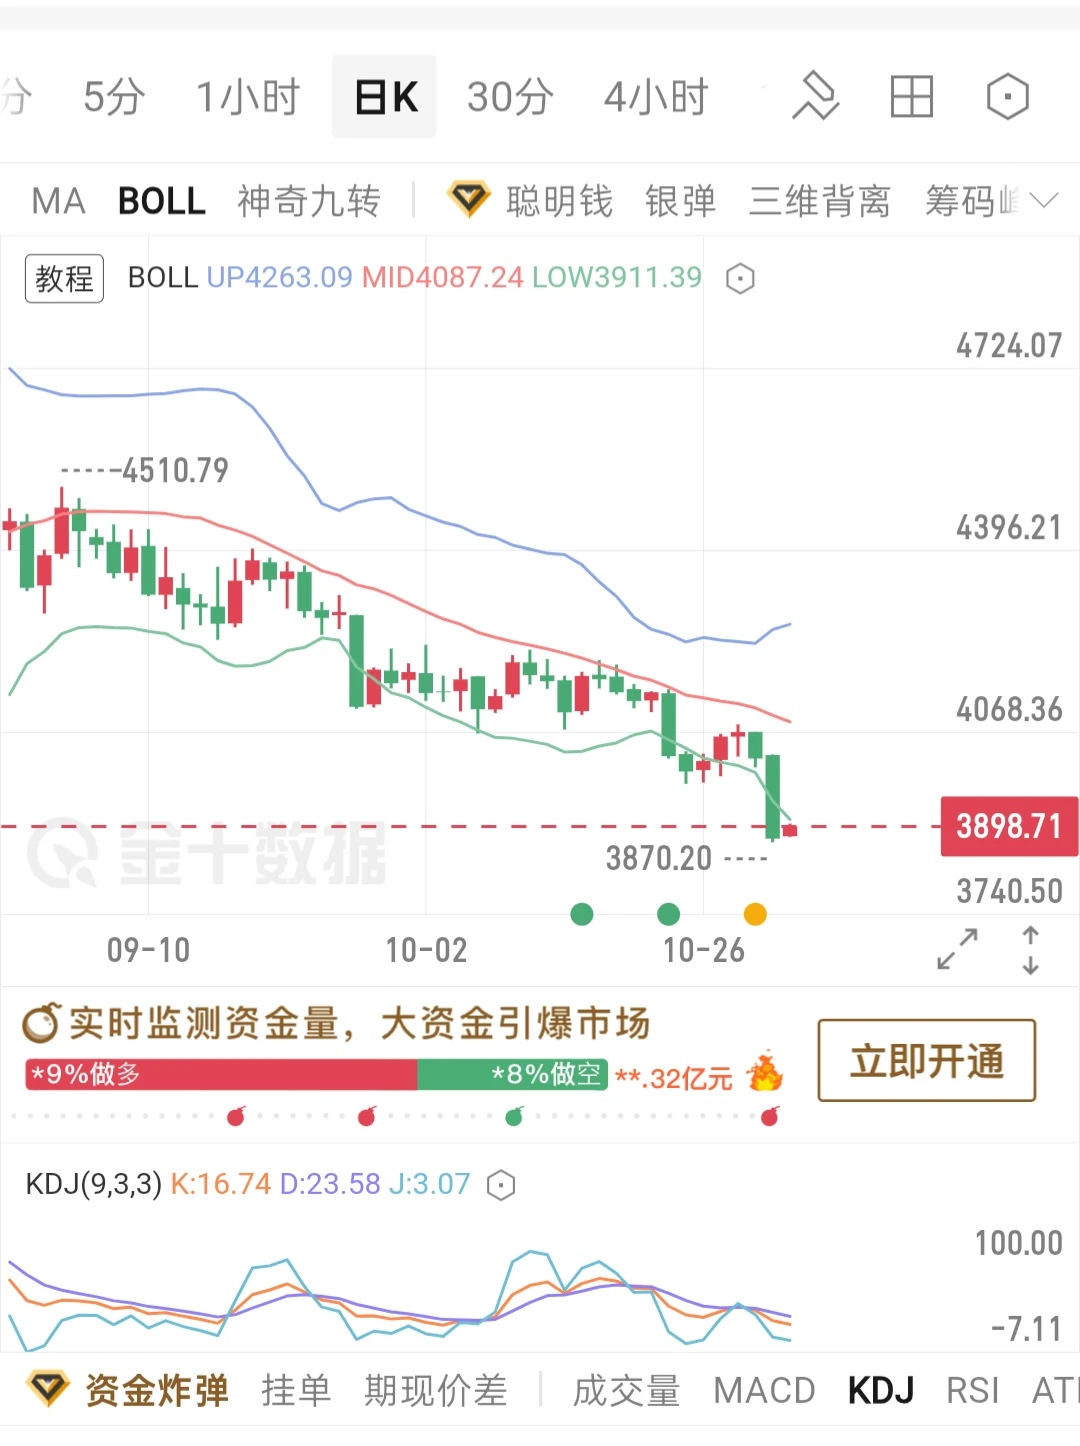
The daily Bollinger Bands are widening downward, and the current price has already fallen below the lower band, confirming a clear bearish trend on the higher timeframes. After dipping to around 3870, the price rebounded slightly—a corrective recovery after a sharp drop. The Bollinger midline is the key overhead resistance.
The three KDJ lines are in the low oversold zone, giving the short term some rebound potential. However, no bullish crossover reversal has emerged; this is only an oversold bounce after the decline and does not signal a trend reversal.
Trading advice:
Short at 392
post-image
GLDX-0.40%
PAXG+0.37%
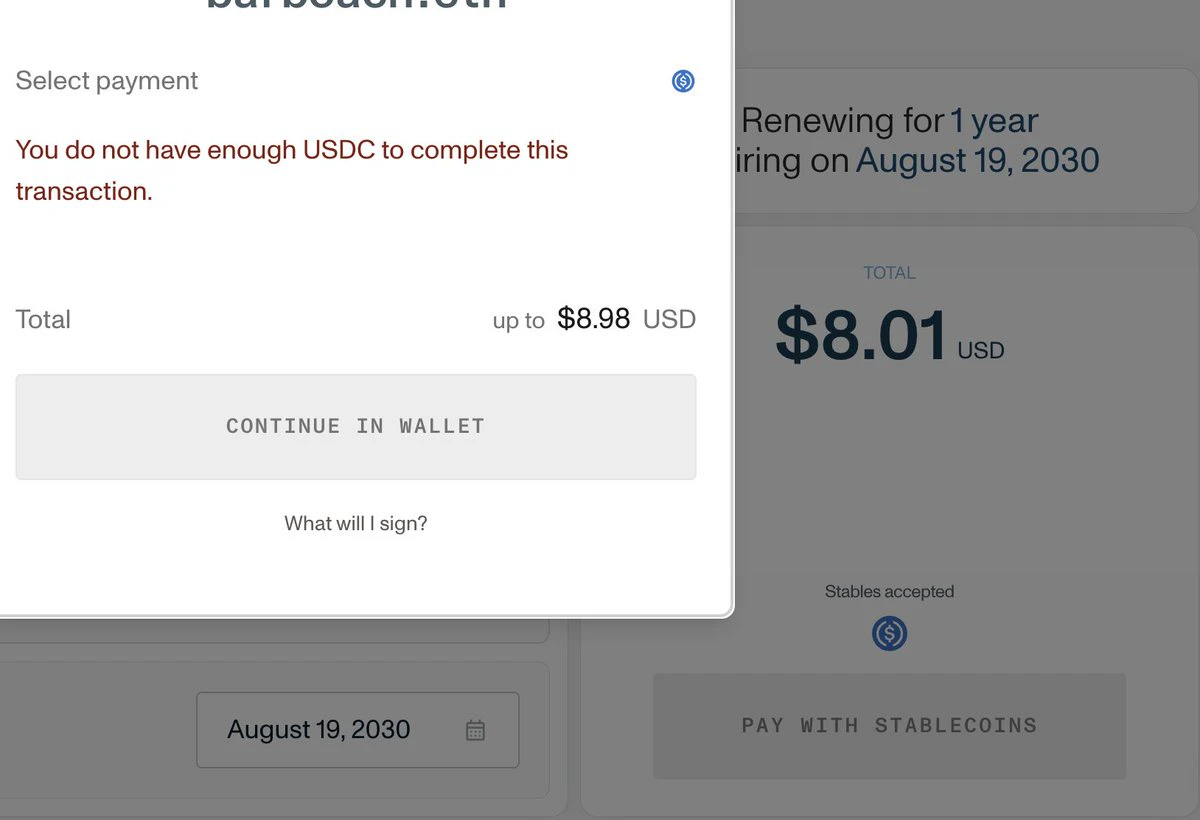
I just renewed a bunch of my @PokemonENS @ensdomains names. I cant even believe how bad the new ENS app is.
You cant even use ETH for renewals?? And the "total" is not the real total. I used my own FE and saved over 10% that they are adding in unexplained fees.
Come on guys
post-image
ENS-1.25%
ETH-1.26%
$BTC BTC has just climbed back to $78,000, and the US midterm elections, nonfarm payrolls, and tech giants' earnings are all landing at once!
This week's market may not be so easy to calm down.
On November 2, BTC was trading at $78,035, up 0.53% over 24 hours, with a high of $78,489 and a low of $77,562.
It looks like the decline has stalled, but BTC hasn't even broken through $78,500. The rebound is pretty weak.
① Three major events this week, one after another
November 3: US midterm elections. Control of Congress could change, prompting a repricing of expectations for crypto regulation.
Nove
BTC-0.65%
These days, no business can beat hospitals—you have to wait 20 days to get admitted. That’s the clout of the top hospital in the province
post-image
  • 2
$ESPORTS BOOM🤑🤑 A huge liquidity block has appeared below—time to go gobble it up🙈💸SHORT SHORT SHORT🔥Tp1: 0.0155Tp2; 0.013Tp3: 0.01Sl: 0.0217$IDOL $AIN
post-image
ESPORTS-5.30%
IDOL-6.71%
AIN+3.85%
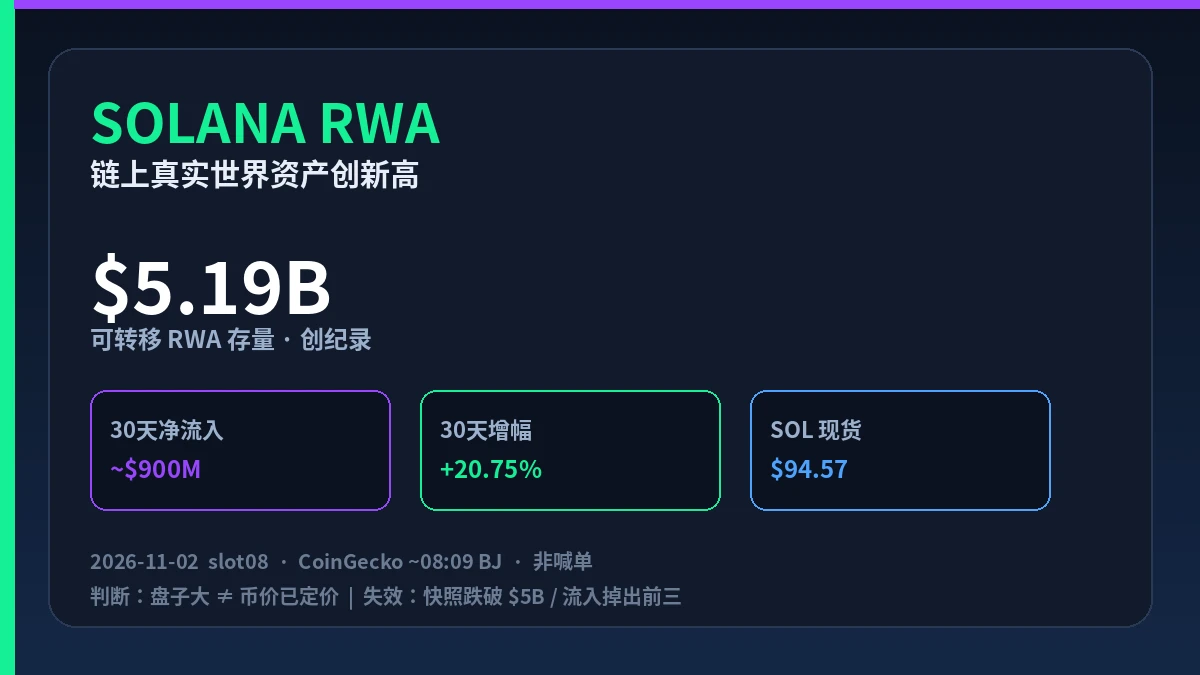
Transferable RWA assets on Solana have reached about $5.19 billion, a record; net inflows over the past 30 days were about $900 million, putting it ahead of other chains. TokenPost and on-chain data dashboards have both shown these figures. CoinGecko puts spot SOL at about $94.57 (snapshot at around 08:09 Beijing time, down about 0.9%).
A larger asset base doesn’t mean the token price will immediately follow. Most tokenized stocks and Treasuries sit on balance sheets, generating very little in fees for the network; retail trading may be lively, while institutional positions often barely move.
post-image
SOL-0.77%
RWA-0.39%
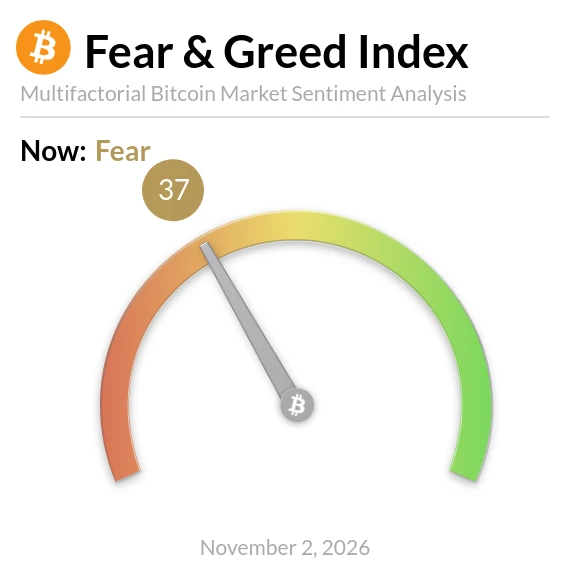
Bitcoin Fear and Greed Index is 37 - Fear
$BTC Current price: $78,057
post-image
BTC-0.67%
This Week’s Gold Market Analysis (Comprehensive Assessment Based on the Previous Post)
I. Overview of This Week’s Key Drivers⚜️
This is a week packed with macroeconomic data. The key themes are U.S. employment data, PMIs from multiple countries, and Fed officials’ remarks, alongside the U.S. midterm elections. Gold pricing still hinges on real Treasury yields, the strength of the U.S. dollar, and rate-cut expectations.
Gold is fundamentally a non-yielding safe-haven asset: falling real Treasury yields are bullish for gold, while rising real yields are bearish. ❎
Key events this week, ranked by
XAU+0.38%
ETH-1.23%
XAUUSD+0.91%
  • 21
Load More

Join 40 M users in our growing community

⚡️ Join 40 M users in the crypto craze discussion

💬 Engage with your favorite top creators

👍 See what interests you

Trending Topics

BTC大跌

553.59k Views39.96k Discussing

$BTC briefly fell below $77,000 and remains under pressure around the $77K zone, with its 24-hour decline still above 4%. With risk appetite weakening and Fed uncertainty rising, where is the next key support after losing $80K?

IntelBeatsEarningsButStockPlunges

52.9k Views1.11k Discussing

StrategySTRCNears100ParValue

61.75k Views4.23k Discussing
View More