Square
Following
Hot
News
Notifications
Profile
Share your thoughts
placeholder
Article
Afternoon Market Updates
live-cover
LIVE4,248
ETH-1.26%
BTC-0.67%
SOL-0.77%
ZEC+1.16%
HYPE+0.24%
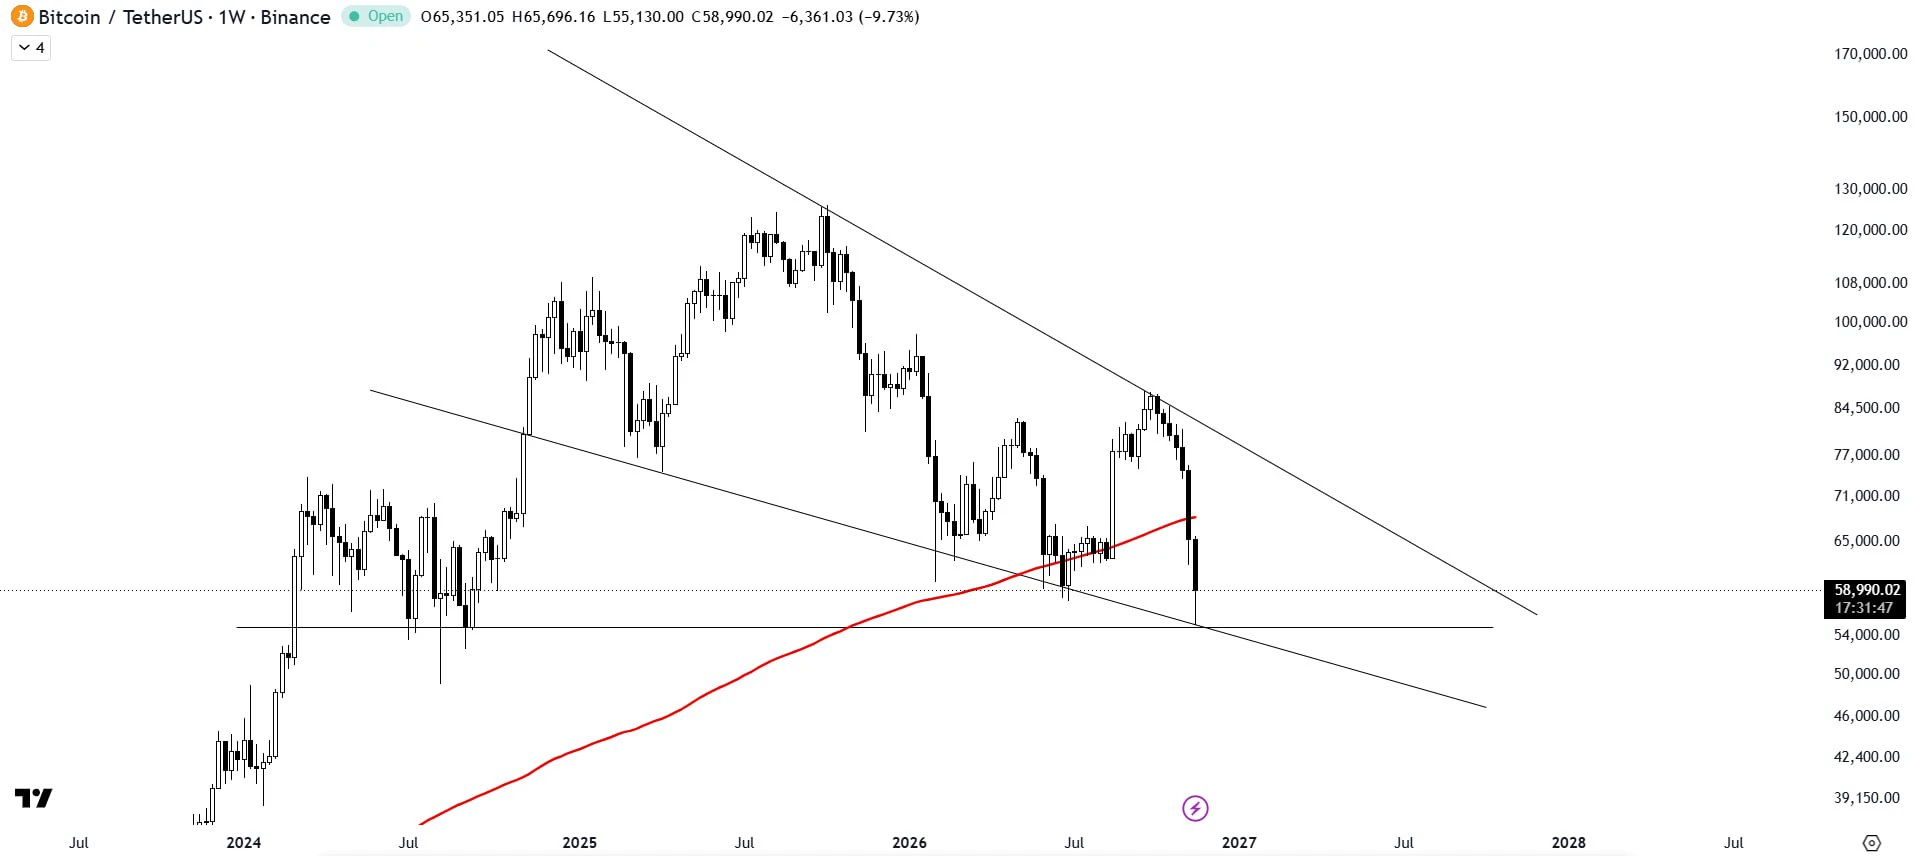
$BTC /USDT ANALYSIS

Bitcoin is bouncing from the falling wedge support trendline, showing signs of renewed bullish strength.

The next major challenge is the 200MA. As long as horizontal support holds, the structure remains bullish. A breakout could spark fresh momentum across the market.

#BTCReboundFaces60KTest
post-image
BTC-0.67%
Trenches
IDOL
I
bade
b
IDOL
0x3b...ab07
Market Cap
$.
Change
.
24h Vol
$.
Holders
.
PIEVERSE
P
bade
b
PIEVERSE
0x0e...25a9
Market Cap
$.
Change
.
24h Vol
$.
Holders
.
JAGENT
J
bade
b
JAGENT
0x8e...ae15
Market Cap
$.
Change
.
24h Vol
$.
Holders
.
Singularity
S
bade
b
Singularity
7R4M...pump
Market Cap
$.
Change
.
24h Vol
$.
Holders
.
CLAUDIA
C
bade
b
CLAUDIA
2j5S...W2ZM
Market Cap
$.
Change
.
24h Vol
$.
Holders
.
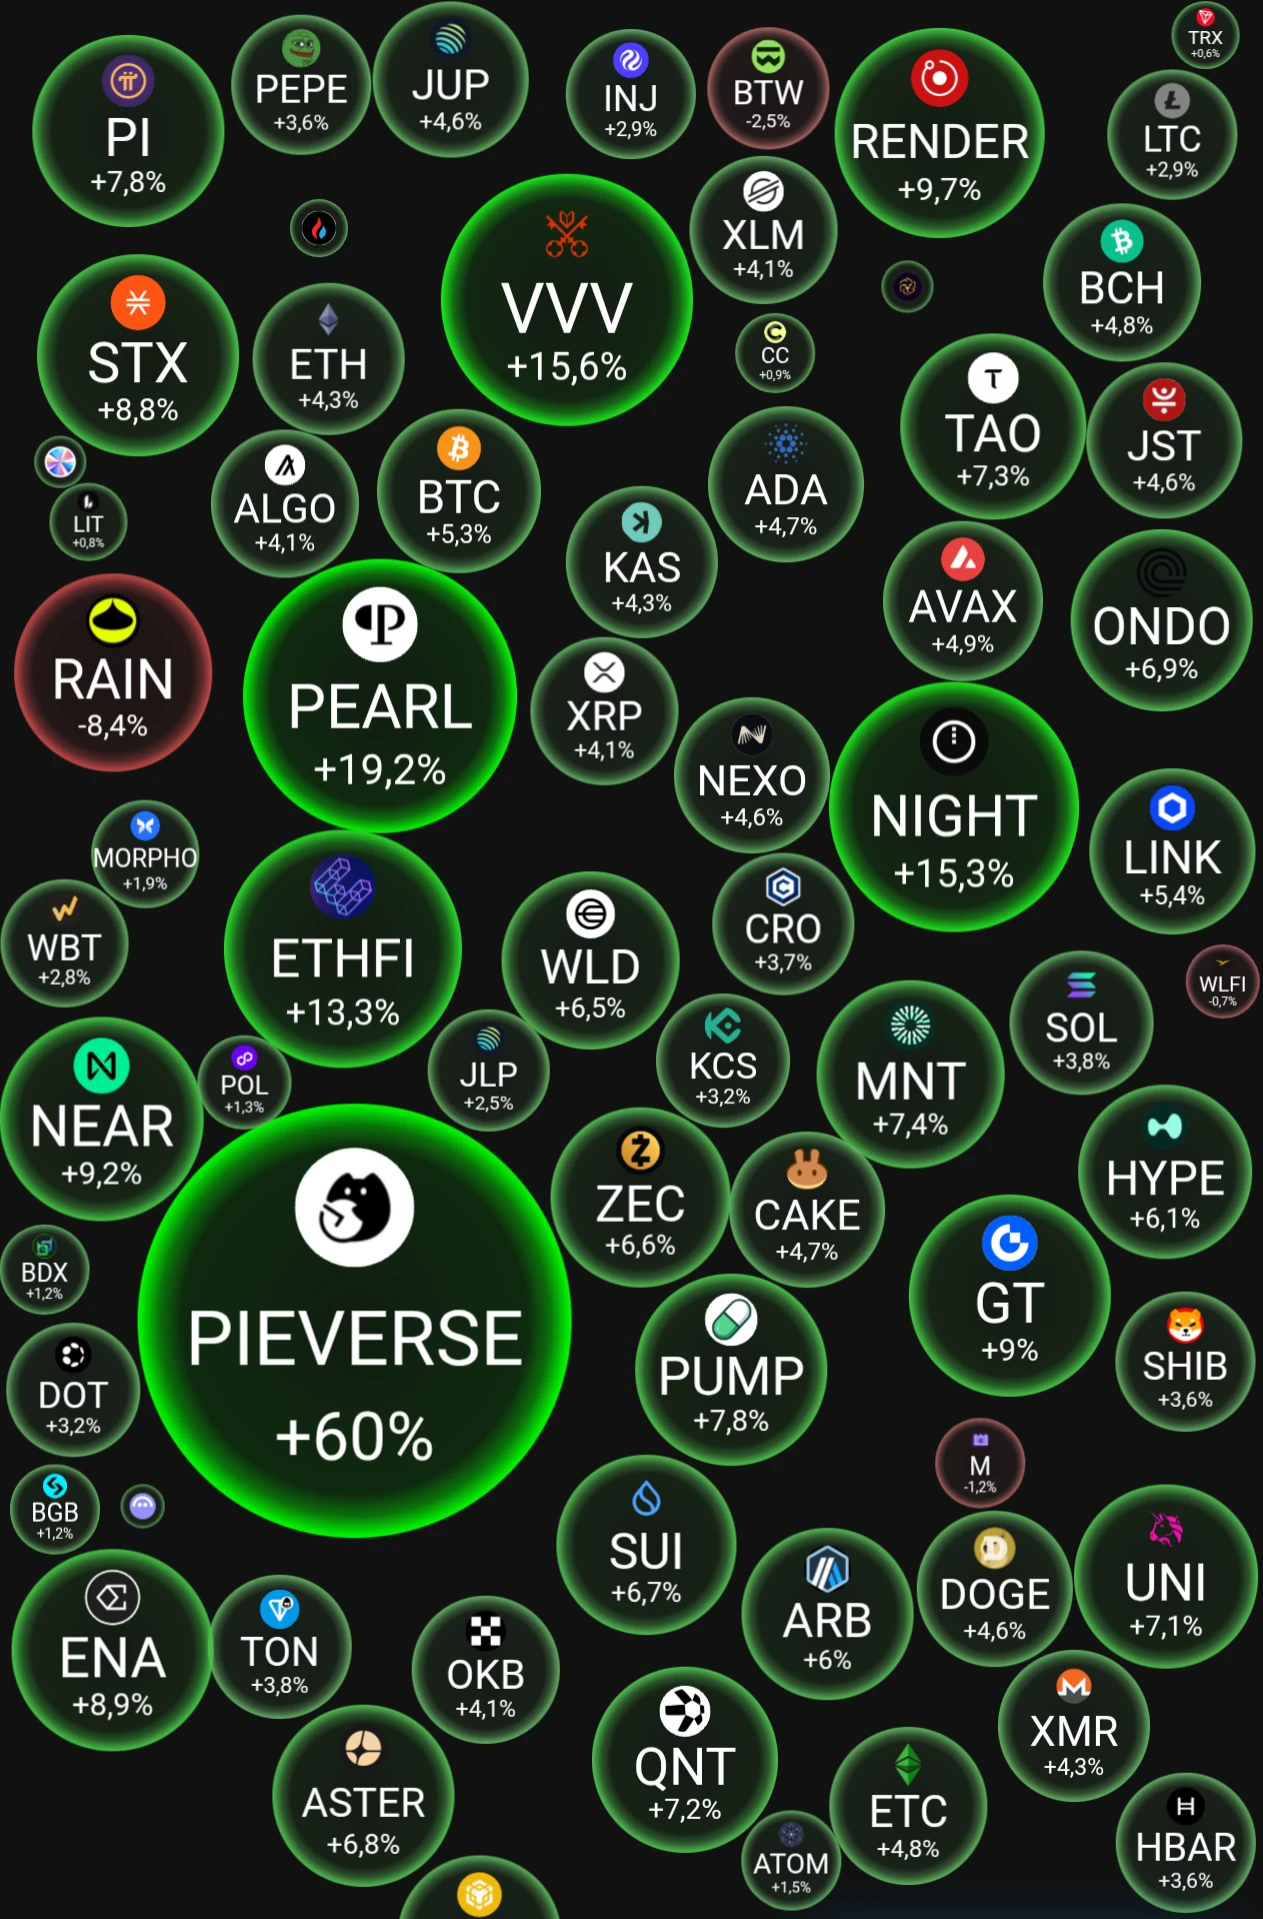
HELLO EVERYONE 👋

🟢THE MARKET IS UP TODAY🟢
$BTC ‌$ETH ‌
🌍 A few news updates

Bitcoin fell to around $55,100 on Saturday, then rebounded above $60,000. By morning, the price was back below that level. The Fear and Greed Index fell from 12 to 11 out of 100.

U.S. spot BTC and ETH ETFs lost around $1.47 billion over November 16–20. The figure is preliminary, as Friday data for IBIT was not yet included in the summary.

Chainflip halted operations after an incident involving its Ethereum vault. Bitquery estimated the amount of ETH and stablecoins withdrawn at around $4.86 million.

Bitdee
post-image
BTC-0.67%
ETH-1.26%
PIEVERSE+0.58%
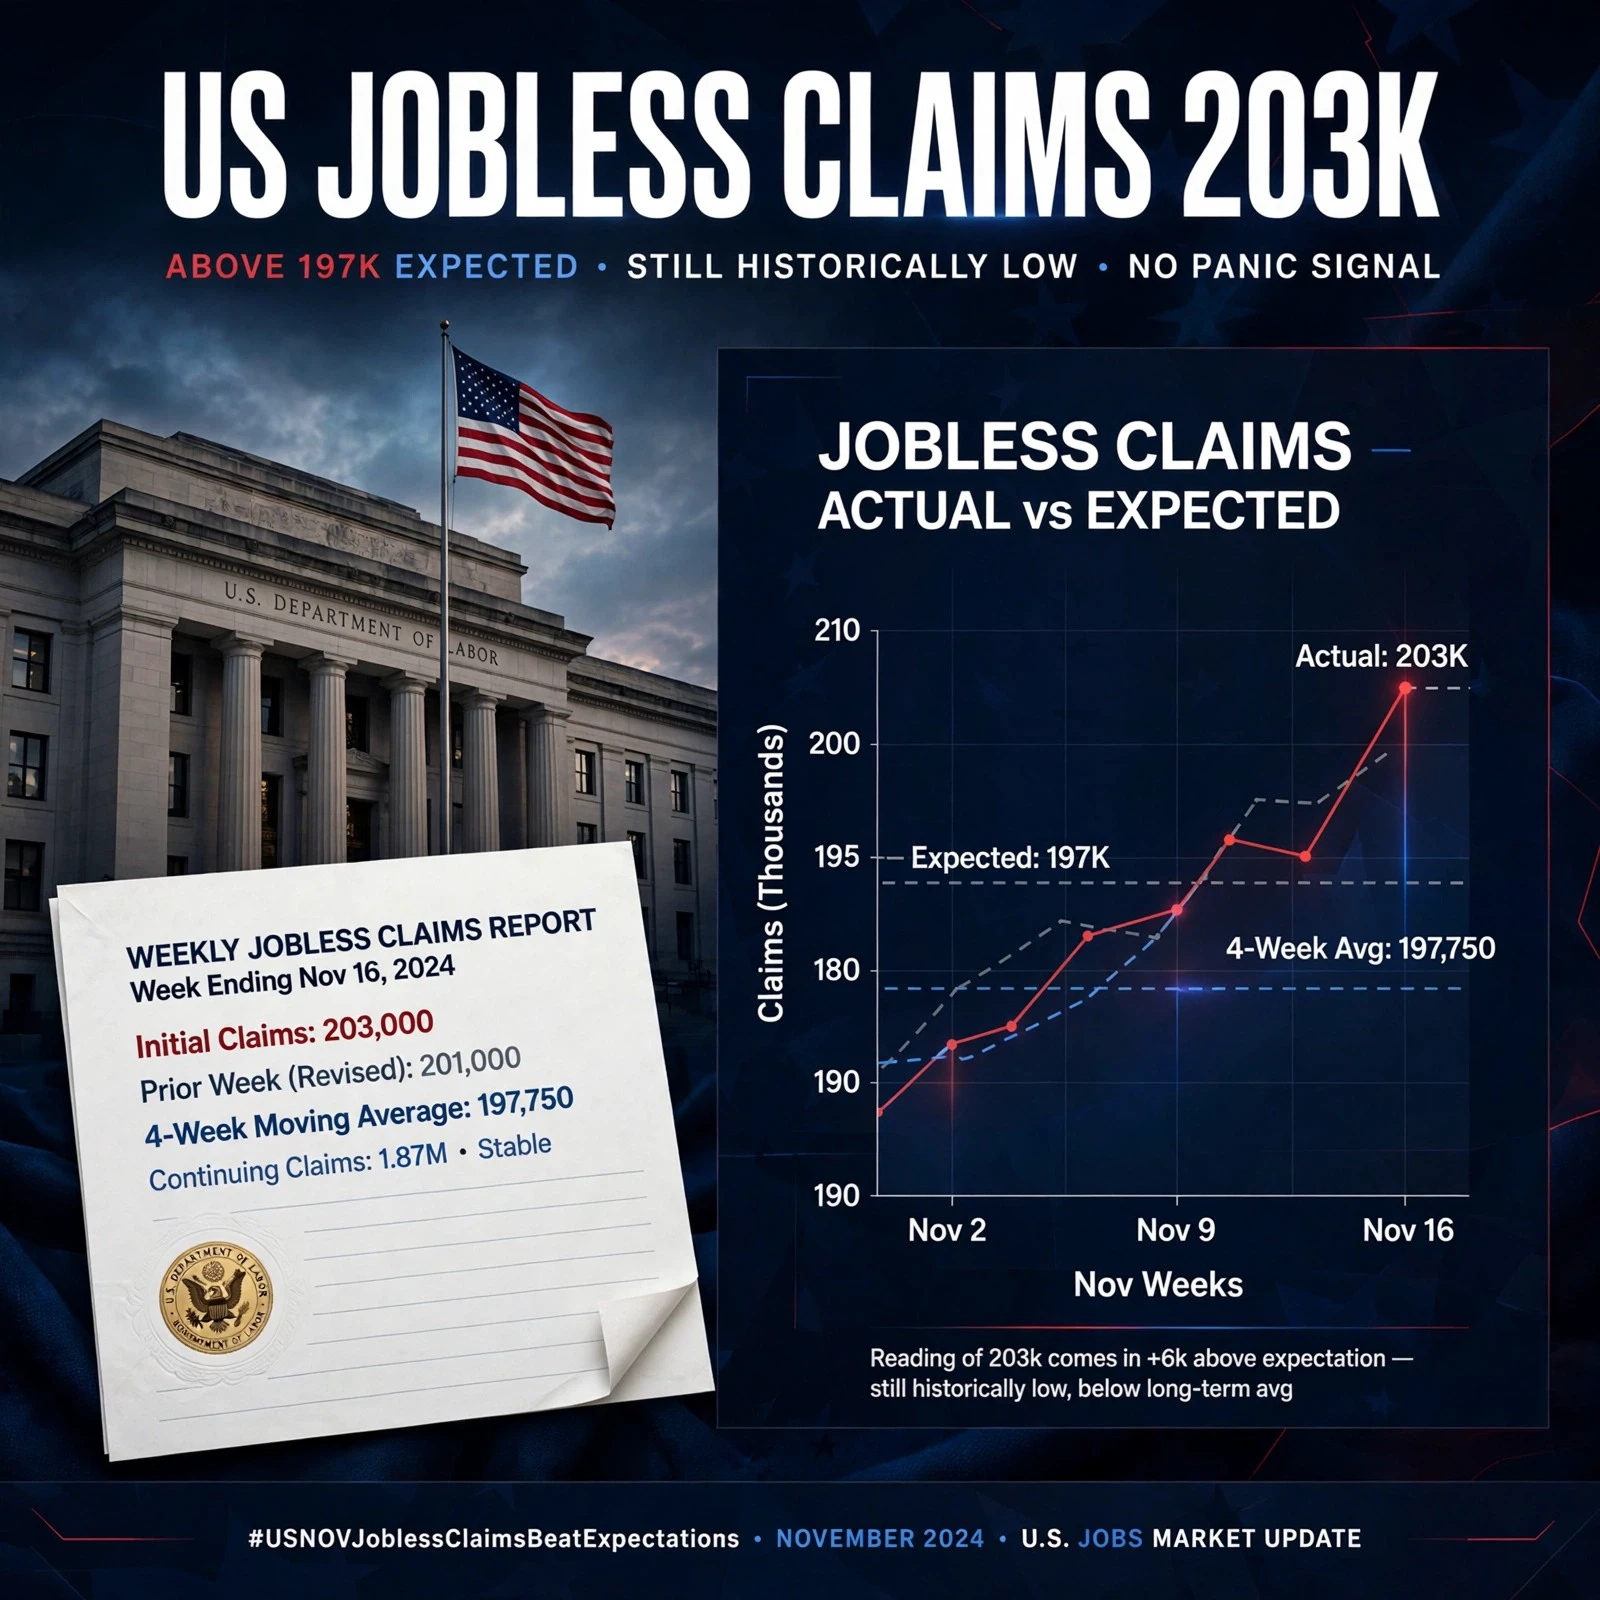
#USNOVJoblessClaimsBeatExpectations

WHY A 1,000-CLAIM TICK IN NOVEMBER CHANGES THE LABOR PICTURE

Earlier in the autumn of 2026, U.S. initial jobless claims dipped as low as 189,000—matching a multi-decade low—and kept headline fears about layoffs quiet. Now, following the U.S. Department of Labor report released on November 19, 2026, seasonally adjusted initial claims rose by 1,000 to 203,000 for the week ending November 14, above consensus estimates around 197,000 to 198,000. That small move from recent lows to a slightly higher-than-expected reading is the kind of shift markets watch clos
post-image
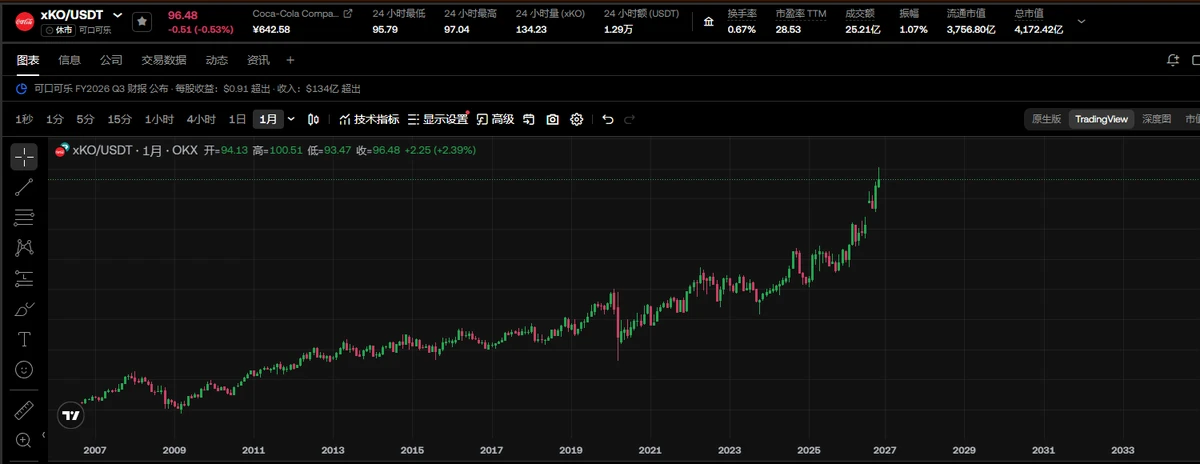
Alright, whether it’s a bull market or a bear market, you can’t do without Coke.
post-image
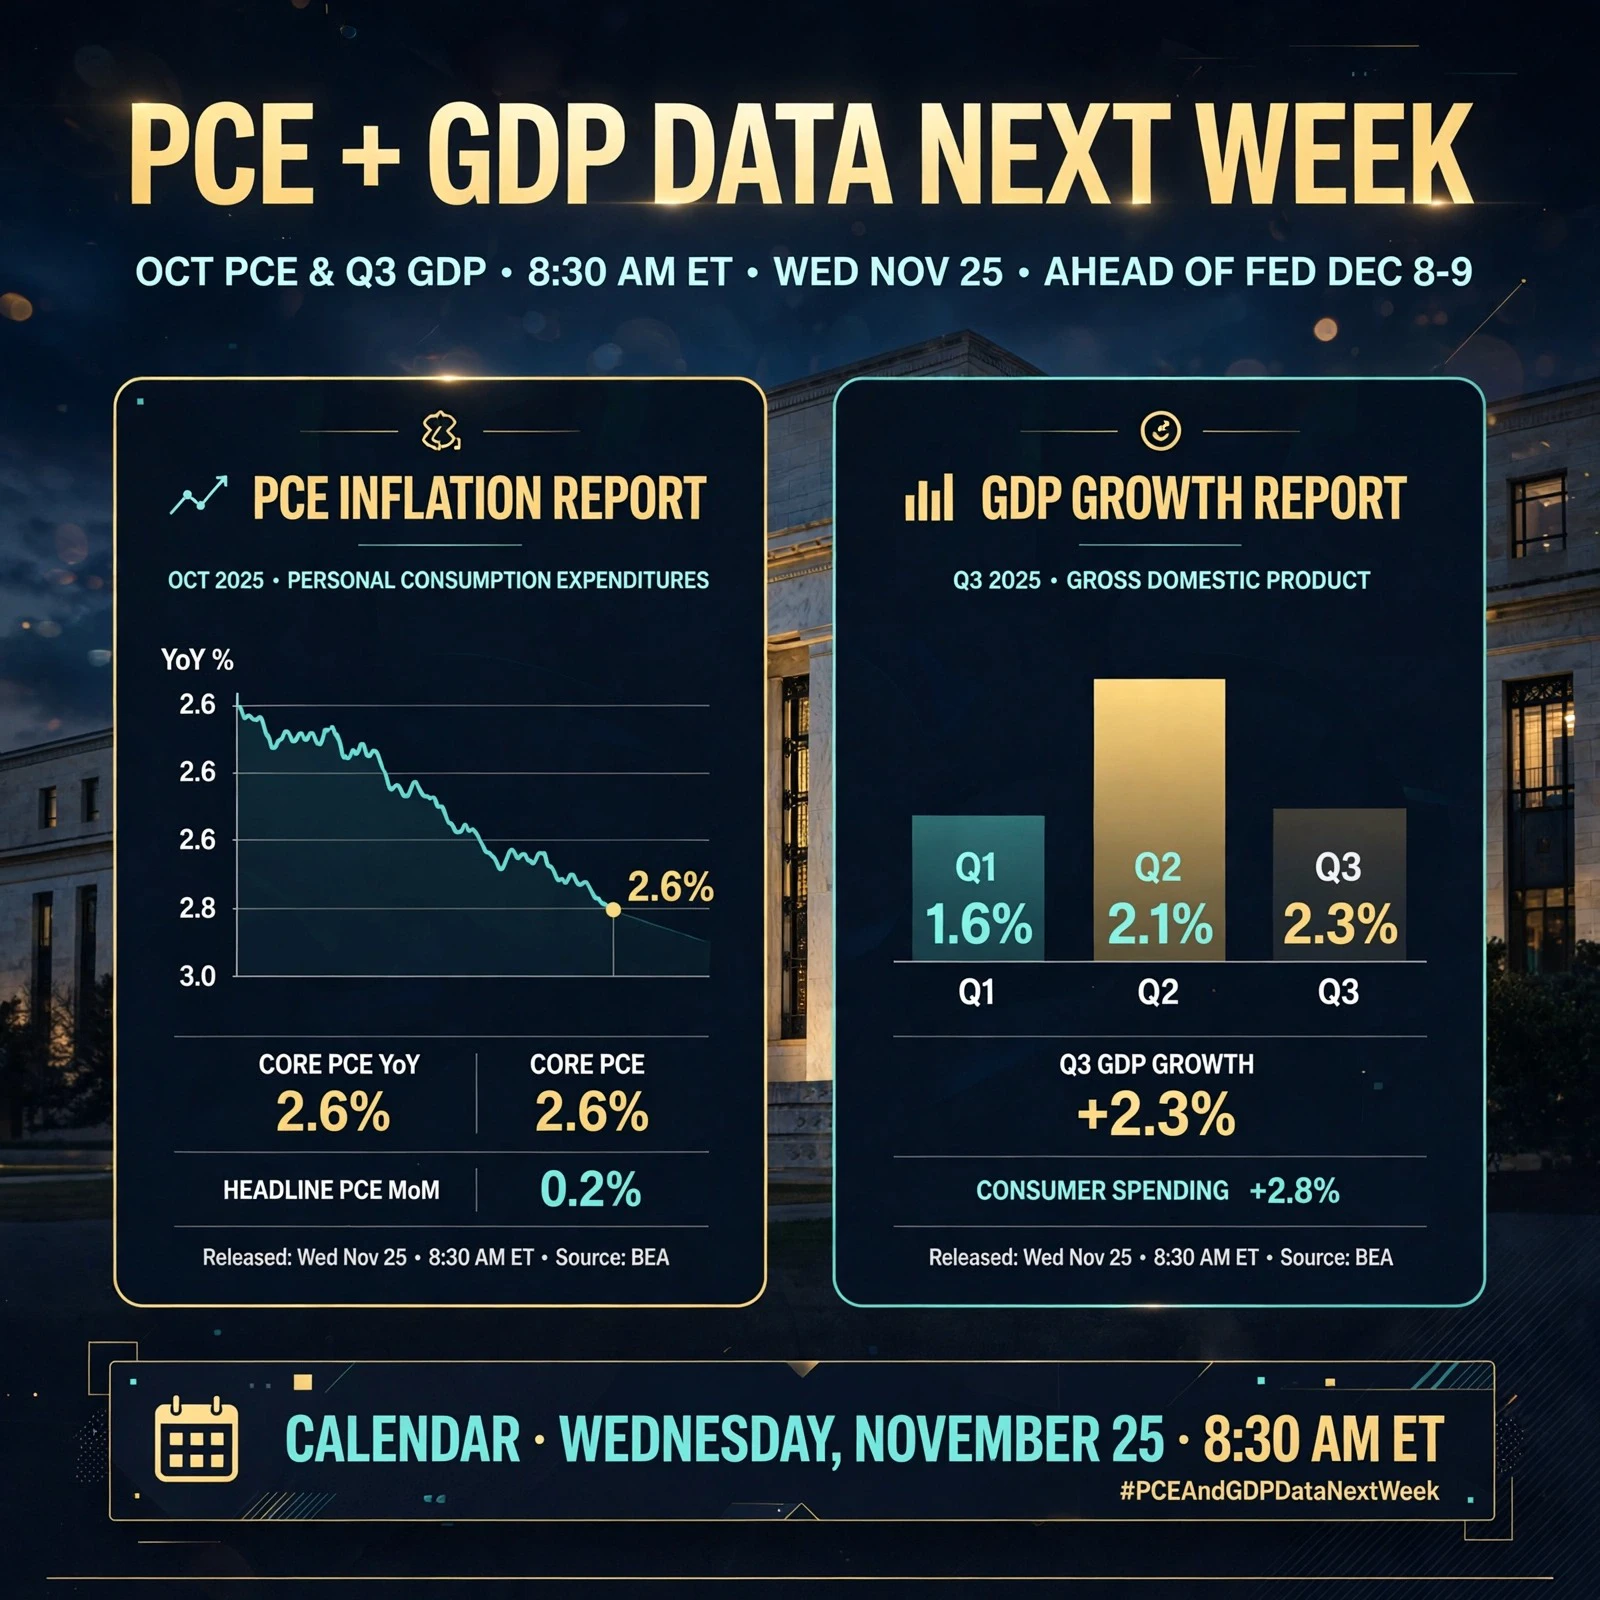
#PCEAndGDPDataNextWeek
In the prior autumn stretch, U.S. real GDP grew at an annualized 3.4 percent in the advance Q3 reading while September headline PCE stood at 3.6 percent year-over-year and core PCE stood at 3.1 percent. Separating common myths from verified facts helps put both upcoming reports into clearer focus ahead of the Federal Reserve's December 8–9 meeting.
Admiral Markets
🔍 MYTH: A HOTTER ANNUAL INFLATION NUMBER ALWAYS MEANS PRICES JUST SPIKED

Myth: If a year-over-year inflation reading ticks higher, it proves consumer prices suddenly surged in that single month. Fact: A yea
post-image
BTC-0.67%
Dare I ask: who else? Those two trades alone brought in nearly 10k points. Tell me, are you convinced or not? Don’t bring up Lao Ji’s earlier losses on long positions—who hasn’t taken losses going long in a one-way market? Besides, we always reminded everyone to use stop-losses and never let losing positions ride. The short above 62,200 called on the morning of 11.20 was held to around 57,500, nearly 5,000 points. I also said to build mid- to long-term long positions in batches between 55,000 and 66,500. On the rebound, Lao Ji added to the long position and scaled in, bringing the average entr
Same day, same weekly candlestick 📉📈
Innolight fell from 1415 to 393, losing more than 70% 😭
ICBC rose from 6.53 to 9.40, hitting a new high 🚀
One is the “core AI asset” you’ve been chasing for half a year 🤖
The other is the “big elephant” you thought was too slow and never even bothered to look at 🐘
The market never lacks opportunities; what’s lacking is your ability to hold on 🤷‍♂️
ICBC+0.25%
#GateLeadsRWAPerpExpansion

WHY BIG TRADING VOLUME ALONE DOES NOT TELL THE WHOLE STORY IN RWA PERPETUALS

A common myth in derivatives markets is that whichever exchange posts the biggest raw trading volume automatically has the deepest liquidity or the stickiest traders. In reality, real-world asset (RWA) perpetuals—contracts without an expiration date that track assets like stocks, commodities, or indices—are shaped by how positions stay open, how order books hold up under stress, and how quickly new themes emerge. Tracing the timeline of key milestones shows how Gate built its footprint in
post-image
XAU+0.38%
XAG+0.47%
SPCX+0.20%
CHIP+3.52%
GT-2.41%
Is that all you bullas got?
lower
post-image
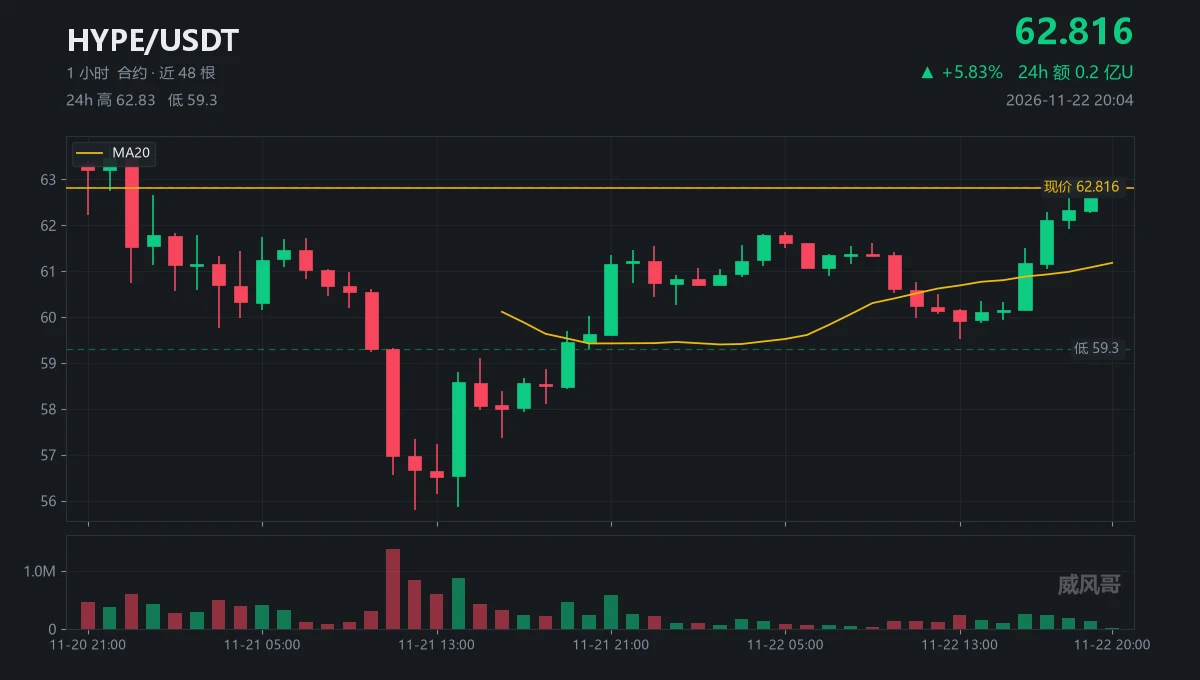
I call this stretch “Going Upstairs Empty-Handed.”
At 13:00 it touched 59.53; four hours later, it was at 62.68.
The four candles came in at 1.64, 1.57, 1.38, and 1.04 times volume.
It climbed, but each candle got lighter than the last.
The 3.15 gain took just 140,000 contracts in the final hour.
This doesn’t look like buyers rushing in; it looks more like nobody’s selling.
Look above: 63.707 was left behind at 23:00 on 11-20, just 0.89 away.
I don’t care whether it reaches that level today; first, let’s see how volume comes back.
Someone who can climb stairs without getting winded won’t annou
post-image
HYPE+0.33%
  • 1
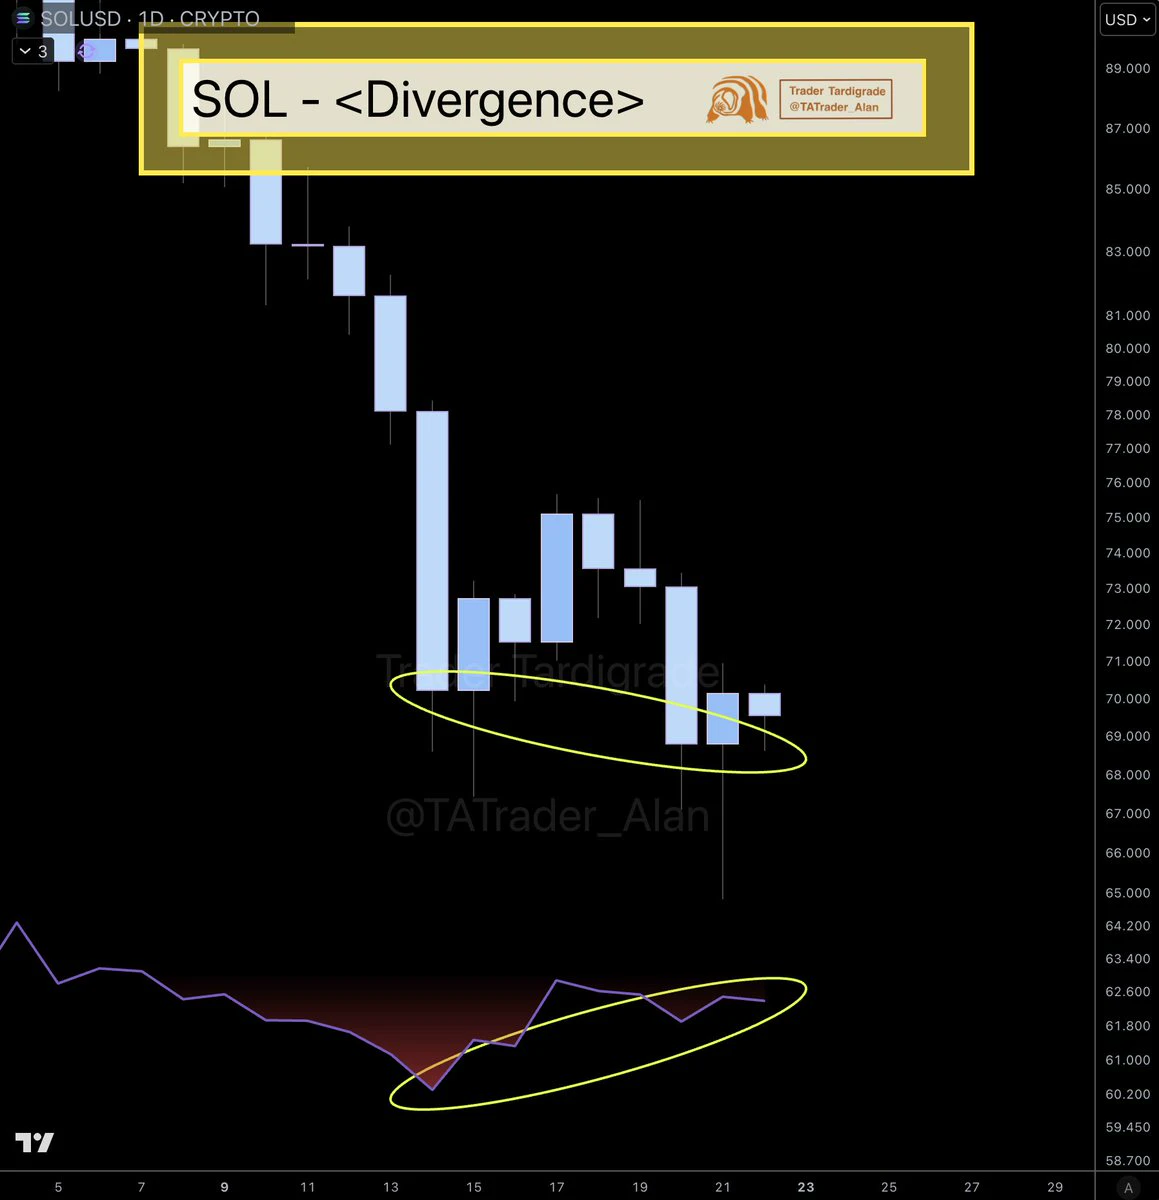
$SOL formed an RSI Divergence on the daily chart 🔥
post-image
SOL-0.77%
SUI’s rebound isn’t particularly strong; it has actually still been pulling back over the past week.

Current price: 0.661, up 5.42% in 24 hours; down 11.7% over 7 days. RSI is 34.5, and the Fear and Greed Index is 11, indicating extreme fear. Foresight News reports that Bitcoin financial infrastructure Hashi has launched on the Sui mainnet. Users can deposit native BTC to mint hBTC, which can be used in DeFi applications such as lending and collateralization, while the underlying BTC remains on the Bitcoin network. Hashi’s underlying technology was developed by Mysten Labs, while related fina
post-image
SUI-1.05%
BTC-0.67%
2Z-3.17%
$BTC Evening outlook: 11.22.

The market action that used to happen Monday through Friday has now moved to Saturday and Sunday, while weekdays are starting to move sideways.

$BTC After breaking below the 59800 support, it retested the low of the large bullish candle indicated by the red arrow at 58800. It found support and began to rebound, then reclaimed 59800 and is now trading above this resistance.

You can now understand the range inside the red box as the current consolidation zone for BTC. To continue rebounding, it must break through 61200, the price corresponding to this consolidati
BTC-0.65%
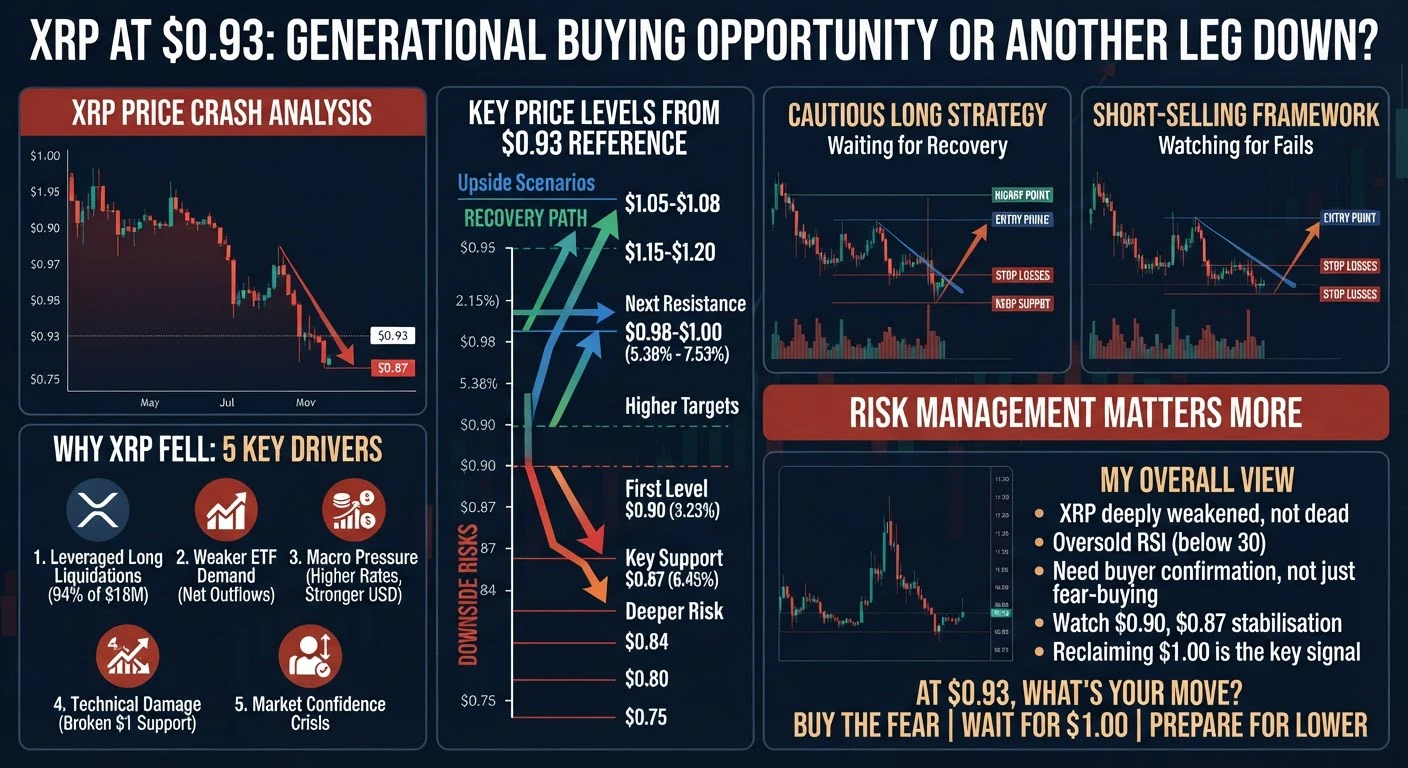
#XRP #WCTCS9
XRP near $0.93 is forcing investors to confront a difficult reality: a recognised brand and established payments network do not prevent a brutal decline when liquidity disappears and confidence weakens. The question is why sellers have taken control, what could stop the falls, and what evidence would confirm buyers are returning. The answer requires examining flows, leverage, macro pressure and technical structure before buying again.

WHY XRP HAS FALLEN SO SHARPLY

Leveraged long positions were forced out as important support levels broke. CoinDesk reported that XRP fell roughly
post-image
XRP-1.15%
BTC-0.67%
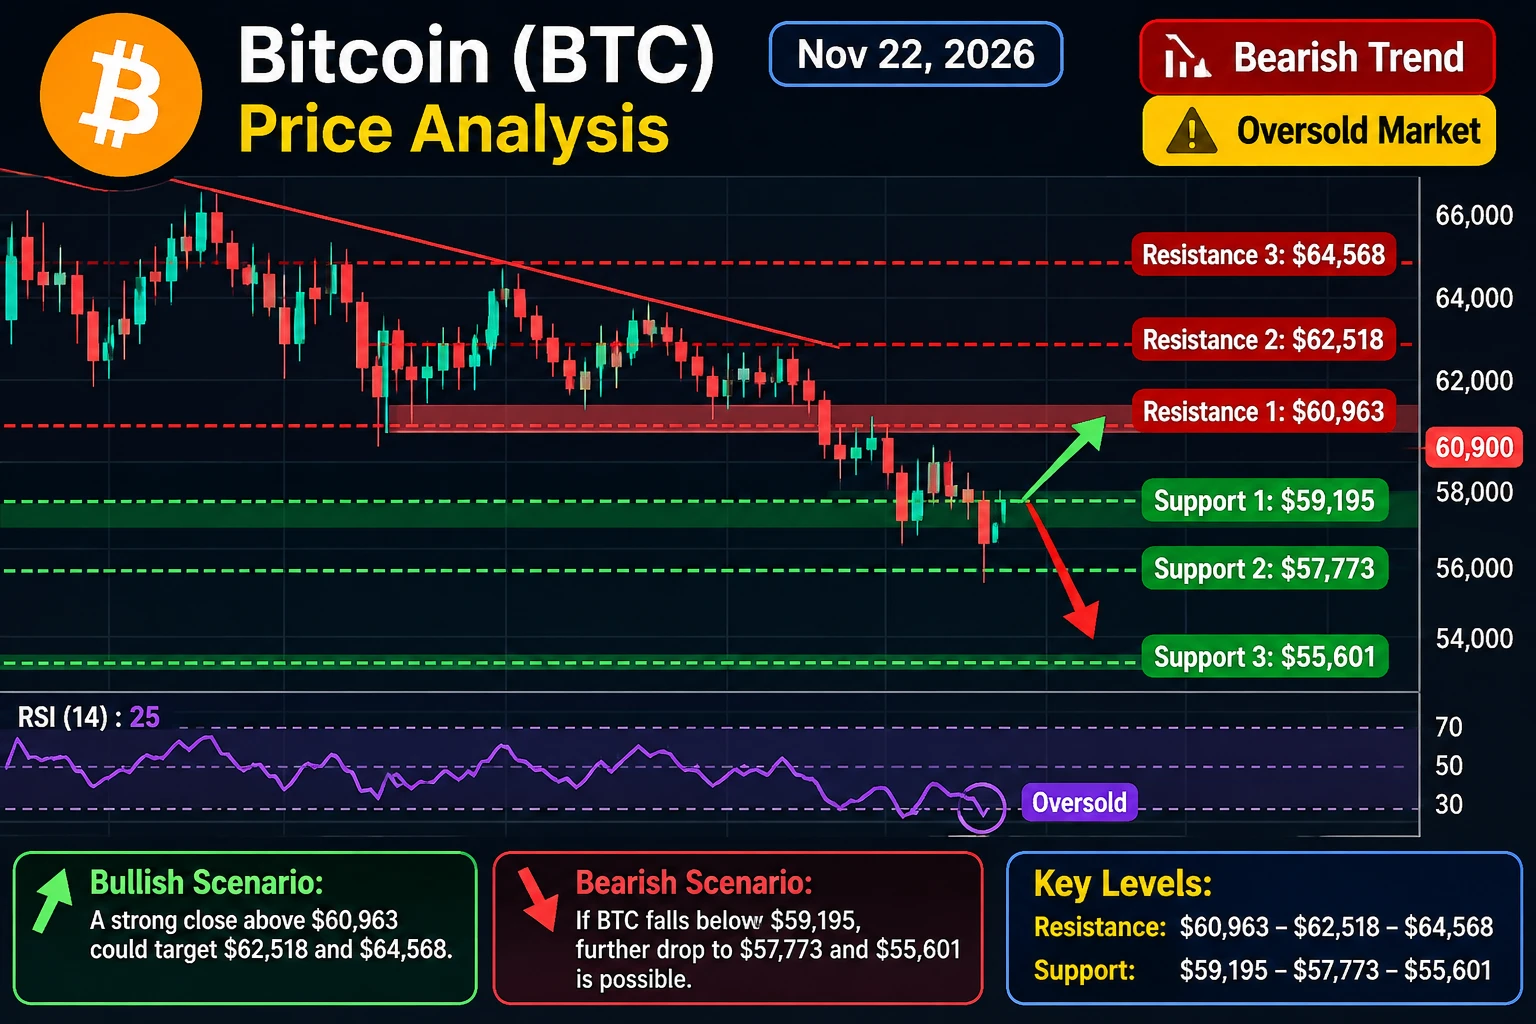
#BTCReboundFaces60KTest
(BTC) Price Analysis – November 22, 2026

Current market overview

Bitcoin is trading around the $60,900 area, showing significant selling pressure. The daily technical outlook remains bearish, although oversold conditions could allow a short-term recovery. COINOTAG +1
| Level | Price |
| ------------ | ------- |
| Resistance 1 | $60,963 |
| Resistance 2 | $62,518 |
| Resistance 3 | $64,568 |
| Support 1 | $59,195 |
| Support 2 | $57,773 |
| Support 3 | $55,601 |
Bullish scenario: A strong daily close above $60,963 could open the way toward $62,518 an
post-image
AAPL-1.83%
RKLB+0.77%
BTC-0.65%
  • 2
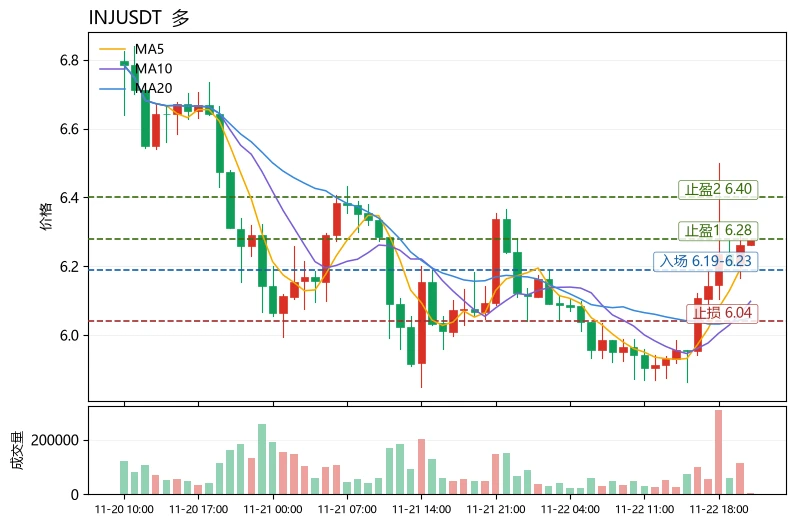
Many people treat “adding to a position as it falls to average down” as discipline, but this is precisely the opposite of risk management. $INJ is currently quoted at 6.277, with a range of about 10.13% over 30 candles and volatility at a relatively high level; MA5=6.2242 has crossed above MA20=6.0493, and the MACD histogram at +0.04766 remains bullish, but the price is already close to the Bollinger upper band at 6.2875, making the risk-reward ratio for chasing in the short term unattractive. More importantly, the funding rate is -0.0224%; the structure of shorts paying indicates that longs
post-image
INJ-1.67%
XLM-0.64%
BTC-0.67%
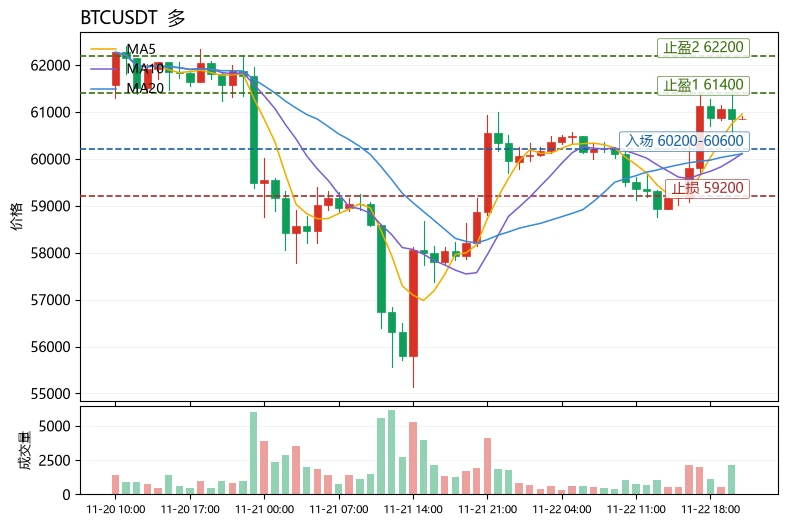
The Fear & Greed Index is only 11, yet prices are rising. Can this rebound be chased? Yes, but only with a small position in the direction of the trend—not a heavy bet.
$BTC Current price: 60864.1, up 3.47% over 24h. MA5=60953.4 has crossed above MA20=60107.5, the MACD histogram at +139.7 remains bullish, and RSI=60.4 still has room to rise. The key contradiction lies in the flows: the funding rate is +0.0031%, with longs paying a small fee to hold positions, indicating leveraged longs are actively taking sides. But extreme fear means the short squeeze may not be over, and the probability of
post-image
BTC-0.67%
RARE-0.89%
ADA-1.48%
BNB Surpasses 540 USDT with a Narrowed 4.43 Decrease in 24 Hours
live-cover
LIVE1,499
BTC-0.67%
SOL-0.77%
ETH-1.26%
XRP-1.15%
USDC+0.01%
Load More

Join 40 M users in our growing community

⚡️ Join 40 M users in the crypto craze discussion

💬 Engage with your favorite top creators

👍 See what interests you

Trending Topics

BTCReboundFaces60KTest

2.1M Views30.1K Discussing

BTC rebounded from around $55,300 on November 21, briefly reclaiming $60,000 before pulling back to around $59,300. The $60K level is back in focus as traders assess whether the recovery can last. Is this rebound a sign of stabilization or a short-lived recovery? Would reclaiming and holding $60K be enough, or do you need confirmation from trading volume and fund flows?

PCEAndGDPDataNextWeek

259.4K Views2.6K Discussing

GateDirectIPOPhase3ANTAllocates92100Shares

834.6K Views5K Discussing

View More