Share your thoughts
placeholder
Article
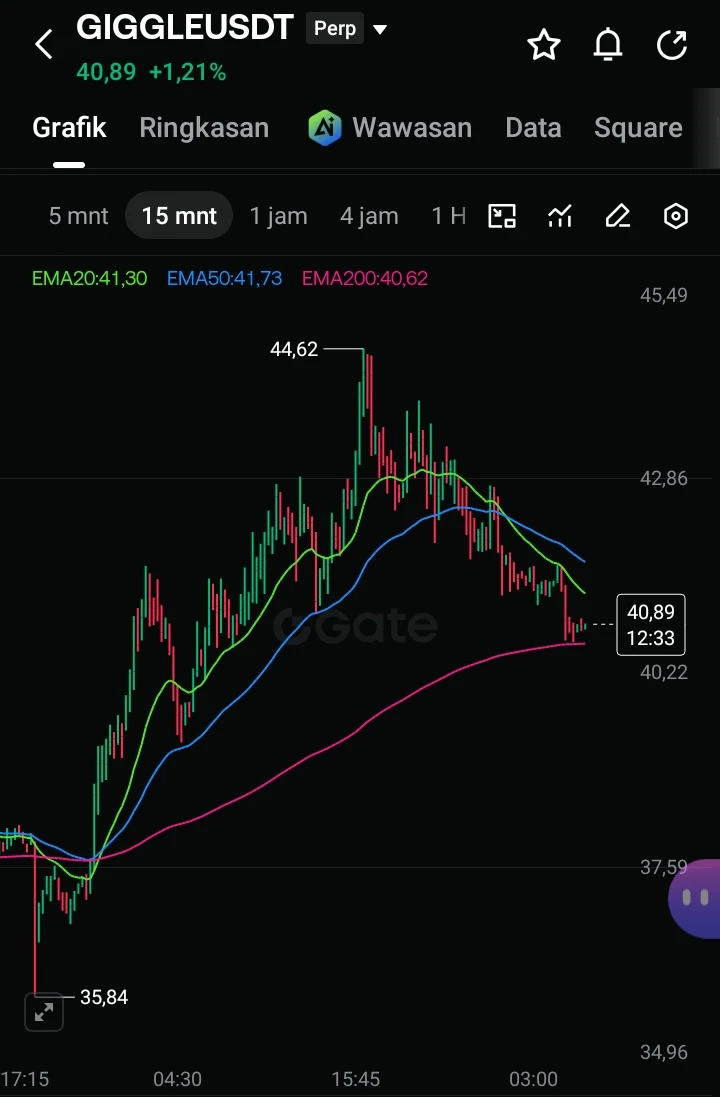
MARKET ALERT - GIGGLE
15-Minute Timeframe Analysis (Short-Term Correction)
The current price (40.89) is below EMA20 (41.30) and EMA50 (41.73), indicating a short-term corrective trend after touching a peak of 44.62. However, the price is holding just above the strong EMA200 support (40.62).
​Trading Opportunities:
​Long Scalping: Buy on weakness near the EMA200 area (40.20 - 40.60). Quick take-profit (TP) target around EMA20/EMA50 (41.50 - 42.50). Set a tight stop loss (SL) below 40.00.
​Further Option: If EMA200 breaks down, a Short opportunity opens toward the 37.50 area.
​1-Day Timeframe An
post-image
GIGGLE+0.59%
SOL+1.43%
DOGE+6.44%
  • 4
  • 1
Layout for Bitcoin, Ethereum, and Dogecoin
live-cover
LIVE2,712
  • 1
Giveaway 3 GTD spots @Chomponhood
Requirements
> Drop evm wallet
12 Hours
post-image
Everyone’s chasing silver’s rally, but the 4h chart just whispered a secret to me about $XAG /USDT.

$XAG /USDT - SHORT

Trade Plan:
Entry: 66.24 – 66.30
SL: 66.54
TP1: 66.07
TP2: 65.94
TP3: 65.74

Why this setup?
Why now? The 1D trend is *range*, not breakout—so mean reversion is king.
- RSI on 15m is 58 (cooling, not overbought), but the 1h ATR (0.111) shows volatility is compressing.
- Entry at 66.27 with TP1 at 66.07, TP2 at 65.94—that’s a 0.5% drop before the daily range even blinks.
- Confidence is only 55, but the invalidation at 66.76 is tight—risk is defined, reward is 3:1 to
XAG+0.05%
Four signals 🔥 to understand current crypto market changes!
A roundup of four industry trends worth watching closely recently 👇
✅ Morgan Stanley continues increasing its BTC holdings
It has accumulated a total of 355 BTC over the past 4 days, while spot BTC-ETF net inflows continue. The single-day increase is not explosive, but the consistency is what matters. Traditional institutions are steadily entering the market in batches. Short-term inflows do not yet mean the trend has completely reversed.
✅ Fierce competition for USDH issuance rights
Several major players, including Paxos, Frax, and
post-image
BTC+0.34%
HYPE+1.07%
SNDK+11.88%
Crypto Signals and Trding Insights
live-cover
LIVE842
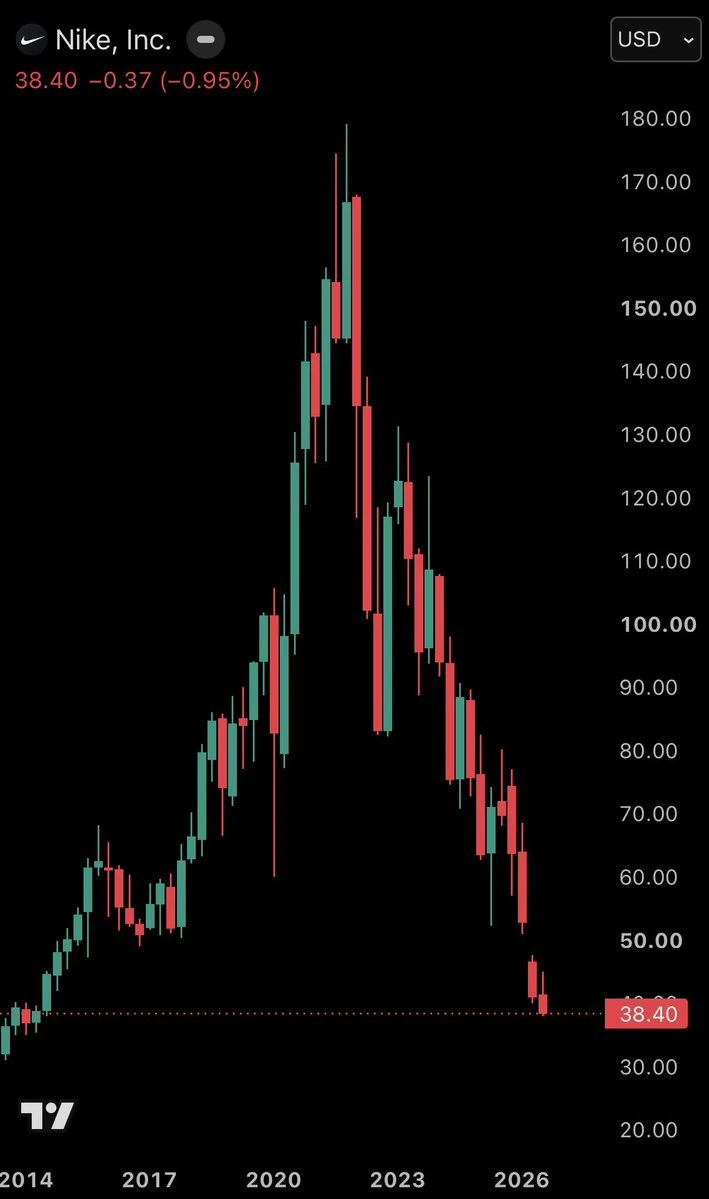
THIS IS INSANE. 🤯
$Nike is getting removed from the S&P 100. After nearly 18 years.
It joined the index in December 2008. It's leaving September 21.
$230 billion in market cap evaporated to get here. An 80% crash from peak. One of the most recognizable brands on the planet, quietly falling out of one of the most exclusive stock indexes in the world.
Here's the part that makes this worse than just a bad stock chart. When a company gets removed from an index like the S&P 100, every index fund tracking it is forced to sell automatically. Not because they want to. Because their mandate requires i
post-image
NKE-0.86%
SPX+1.63%
Everyone’s still watching $LAB /USDT—but the 4H chart just flashed a signal most traders will ignore until it’s too late.

$LAB /USDT - SHORT

Trade Plan:
Entry: 0.07503 – 0.07549
SL: 0.07746
TP1: 0.07361
TP2: 0.07251
TP3: 0.07087

Why this setup?
Why now? The 1D trend is bearish, and the 4H MTF confirms SHORT with 95% confidence. Price is hovering at 0.07526, just below invalidation at 0.07431. RSI on 15m shows 61.25—a dead-cat bounce losing steam. ATR (0.000915) says volatility is contracting, but that’s the calm before the dump. Targets: TP1 at 0.07361, TP2 at 0.07251, TP3 at 0.07087. Th
LAB+1.71%
Everyone’s waiting for XLM to break out—but the 4H chart just whispered a dirty secret nobody’s pricing in.

$XLM /USDT - SHORT

Trade Plan:
Entry: 0.18434 – 0.18508
SL: 0.18823
TP1: 0.18207
TP2: 0.18031
TP3: 0.17767

Why this setup?
- XLM is stuck in a 1D range, and the 4H bias is SHORT with 55% confidence—not a screaming sell, but a “don’t get greedy” warning.
- RSI on 15m sits at 49.73—neutral, meaning no buying panic to save the dip.
- Entry at 0.18471 with TP1 at 0.18207 (1.4% drop) and TP2 at 0.18031—that’s your “why now?”: price is stalling under resistance while ATR (0.001466) s
XLM+3.27%
Everyone’s staring at the 2.19 support while the 4H quietly prints a 95% long setup—are you late or early?

NEAR/USDT - LONG

Trade Plan:
Entry: 2.1819 – 2.2029
SL: 2.0917
TP1: 2.2679
TP2: 2.3182
TP3: 2.3937

Why this setup?
- The 1D trend is bullish, and price is coiling right at the 2.1924 reference—this is the “calm before expansion” zone.
- RSI on 15m sits at 49.61—neutral, meaning no overbought friction to block a push toward TP1 (2.2679) or TP2 (2.3182).
- ATR (0.0419) shows volatility is compressed—when it breaks, the move is fast. Entry window: 2.1819–2.2029. Invalidation only b
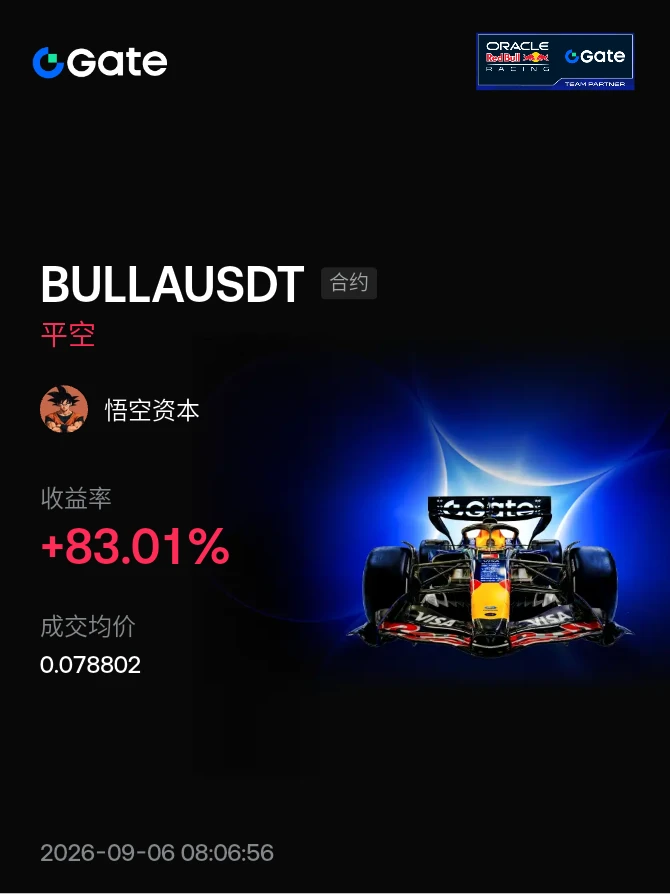
#晒出我的合约收益 Last night, I kept a close eye on $BULLA on Gate and decisively opened a short position, fully capturing this pullback! Watching the market move steadily downward, I decisively took profits, and the gains were quite substantial. Futures trading requires speed, precision, and decisiveness—following the trend is the key. I’ll keep it up tonight!🚀 #BULLA #Gateio #加密货币
$BULLA $GT
post-image
BULLA+183.43%
GT+11.68%
If free time also has to be filled, that is merely another way of constraining yourself.
post-image
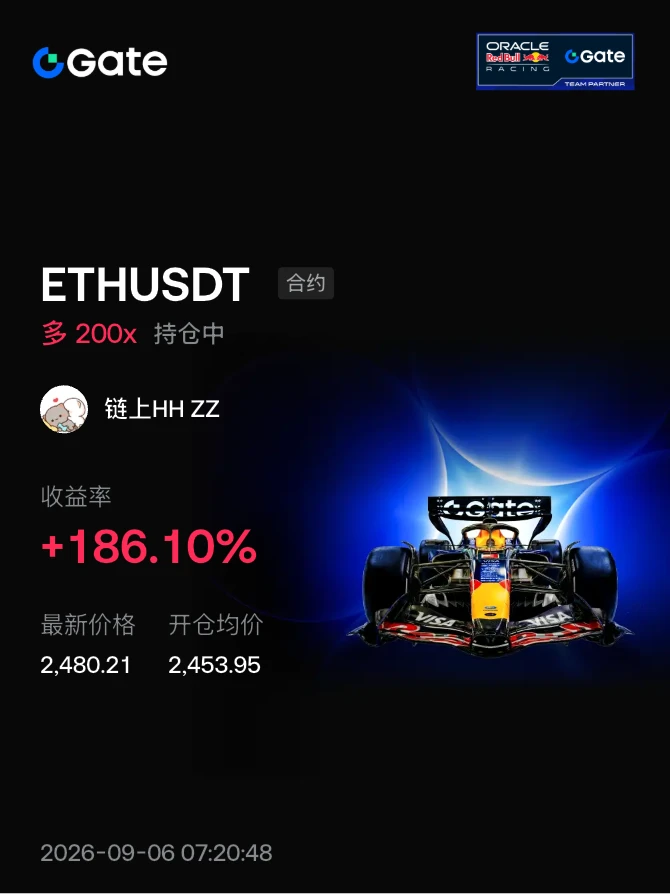
Pretty happy—I got to eat #晒出我的持仓收益 after sleeping.
post-image
Why is everyone still long HOME/USDT when the 1-day trend just flipped bearish?

HOME/USDT - SHORT

Trade Plan:
Entry: 0.00611 – 0.00613
SL: 0.00622
TP1: 0.00604
TP2: 0.00599
TP3: 0.00592

Why this setup?
- 95% confidence on the SHORT setup—this isn’t a coin flip.
- 4h momentum is fading; RSI on 15m (56.89) is stalling, not confirming upside.
- Price sits at 0.00612, with immediate downside targets at 0.00604 (TP1) and 0.00599 (TP2).
- ATR (1h) is tight (0.000042)—low volatility means the next expansion likely favors the path of least resistance: down.
- Invalidation is clear at 0.0
HOME+0.99%
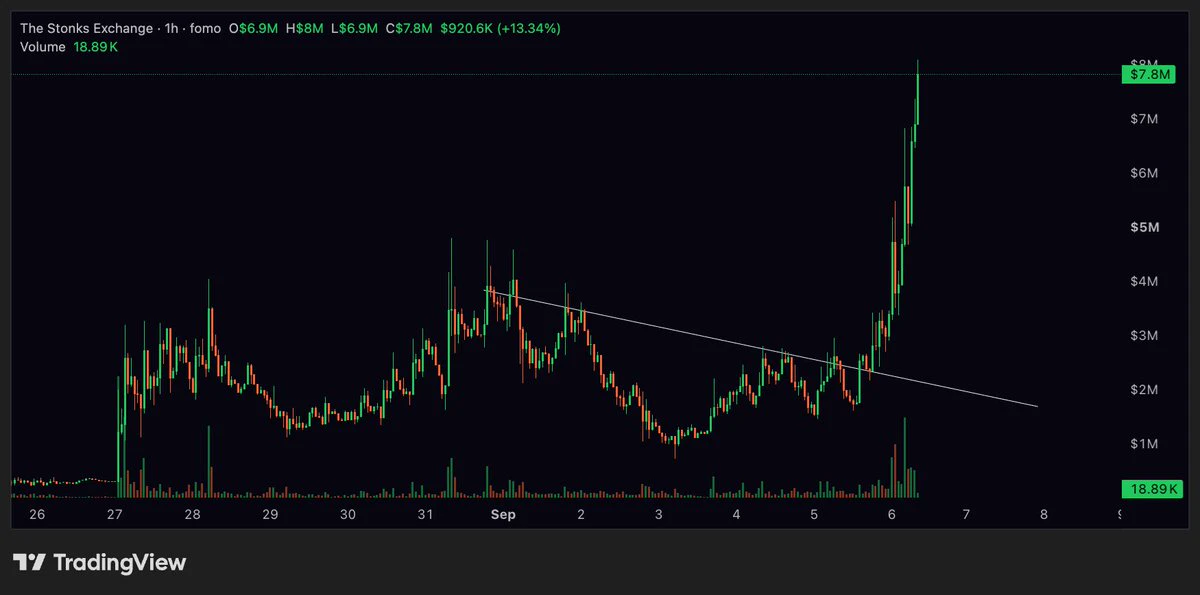
Approaching a 2x on $STONKEX for GTG and X subs. Had a few losses as well - won't ever deny that. Trading is about learning how to lose.
Round tripped $CAP as well (updated my fomo thesis in live time - go read it there) because i was proving to myself to HODL lol still holding but derisked size. Perhaps low caps are an initials out at 2x kinda play no matter what happens.
Either way we stay consistent in this INSANE on chain season.
post-image
CAP+2.31%
Why the quiet RSI at 47 might be the loudest SHORT signal on $SNDK /USDT tonight.

$SNDK /USDT - SHORT

Trade Plan:
Entry: 1759.03 – 1763.69
SL: 1790.42
TP1: 1739.57
TP2: 1725.04
TP3: 1703.24

Why this setup?
The 4H timeframe is flashing a 77% confidence SHORT while the 1D trend sits in a range—not a breakout. Price is hovering at 1761.36, with immediate downside targets at 1739.57 (TP1) and 1725.04 (TP2).
- The 15m RSI at 47.54 shows no oversold bounce fuel, meaning sellers still control the micro-momentum.
- ATR of 9.31 on the 1H confirms enough volatility to travel 22 points to TP1 w
SNDK+1.83%
Wait
What’s this
Who let the ___ out
@spark888 @惜风 @brocoliwang
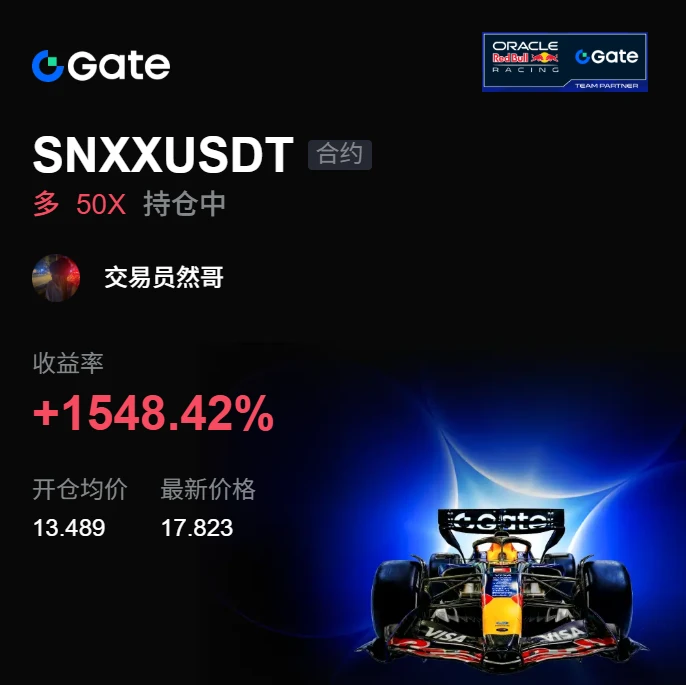
I just switched the app to the background, and it shot right back up—are you playing hide-and-seek with me?

When I checked the chart after lunch, it was still grinding along the bottom, but the K-line had already printed several long lower wicks in a row. When I opened it again in the afternoon, I happened to catch the high-volume breakout. This kind of upward move clearly isn't something retail traders can lift, so I went with the trend and opened a long at 13.489, starting with a small position to test the waters.

Now at 17.821, $SNXX the rally has been very clean, and the return on my p
post-image
SNXX+3.39%
SNDK+1.83%
LAB+1.71%
Everyone’s watching Bitcoin—but the quiet killer on 4h just flashed a 77% short signal.

LTC/USDT - SHORT

Trade Plan:
Entry: 54.32 – 54.62
SL: 56.31
TP1: 53.09
TP2: 52.17
TP3: 50.78

Why this setup?
- LTC/USDT is stalling at 54.47 with a daily range—no momentum to break higher.
- ATR (0.59) is tight, but RSI 15m at 50.91 shows zero buying pressure—just dead air before the drop.
- Why now? The 1D trend is range-bound, and price is rejecting the upper band. TP1 at 53.09 is a 2.5% scalp; TP3 at 50.78 is the real prize if 51.35 support cracks.
- The clock is ticking: this setup waits for
BTC+0.31%
LTC+6.42%
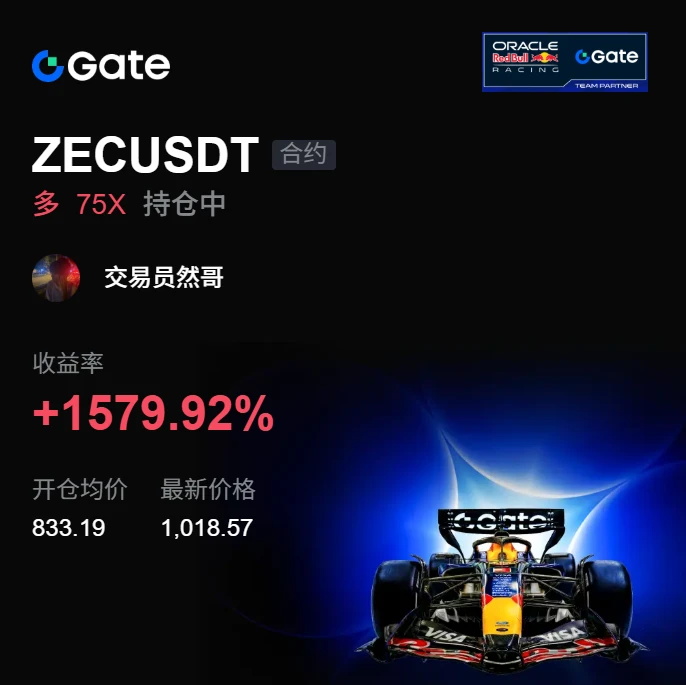
I originally just wanted to freeload a breakfast, but the market ended up wrapping me in dumplings for half a year.
During the repeated intraday oscillations, the bottom never broke down. Someone stepped in to buy every pullback, while capital quietly entered the market. I judged that the bottoming process was nearly over, so I directly opened a long near 833.19.
The price has now climbed to 1018.4, $ZEC this move really delivered the answer, with the return on the position reaching +1578.39%. Those who stayed on board should be grinning in their sleep. It was truly sluggish at first, but the
post-image
ZEC+0.82%
ADA+4.03%
ETH+1.40%
Load More

Join 40 M users in our growing community

⚡️ Join 40 M users in the crypto craze discussion

💬 Engage with your favorite top creators

👍 See what interests you

View More