
Square
Following
Hot
News
Profile
Share your thoughts
placeholder
Article
$LAES
A microcap stock in the quantum business. It held the Fibonacci support
post-image
LAES+3.21%
• Stages of investor acceptance after Fed news
• The point: Show in one paragraph how a crypto investor's thoughts change over the course of one day:
1. 12:29 UTC — “Well, that’s it, PPI will come in line with forecasts, we’re flying to $100k!” 🚀
2. 12:31 UTC — “Okay, PPI is higher than expected... But that’s good for BTC as a safe-haven asset, right?” 🫡
3. 13:00 UTC — “Well, a sausage factory is always looking for new employees” 🏭
#USCPISoon #ShareWeekly
BTC+0.31%
$ICNT Investment trade: Looking back at the content published earlier, Target 2 has now been reached. We still have room to 0.15–0.20.😎$KORU
post-image
ICNT+23.11%
KORU-8.59%
Those who went long on SanDisk around 1280 should reduce their positions around 1440.
$SNDK
post-image
SNDK-1.34%
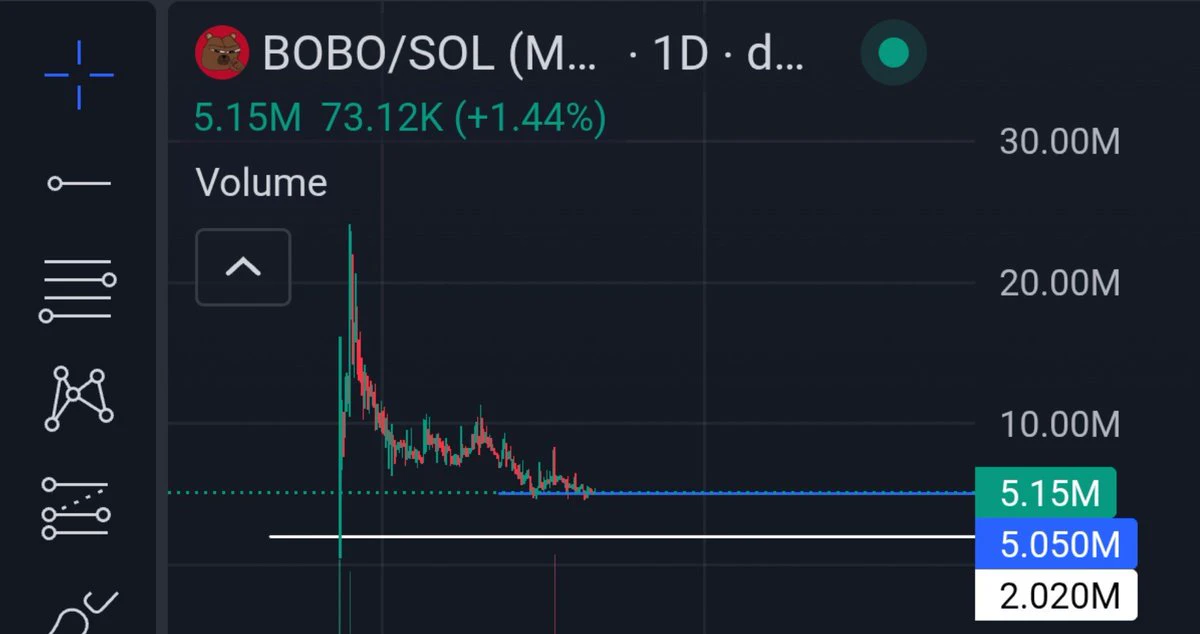
solana:7cSPCV6Sadhcuk8zBa7o7mu2ny4ccmXB8XU6HcqPcSqY Privacy Inu this one is a no brainer at $4,700 mc could bounce 2-3x with minimum 40% pump
7cSPCV6Sadhcuk8zBa7o7mu2ny4ccmXB8XU6HcqPcSqY
#crypto
post-image
SOL+1.42%
Bitcoin Mining Stocks Plunge: 4 Major Firms Lose Over 12% in One Day
Bitcoin miners took a severe hit on Wednesday as higher-than-expected US inflation data triggered a broad selloff across tech and AI stocks.
TeraWulf fell 12.64%, Core Scientific dropped 12.44%, Cipher Mining declined 12.35%, and IREN lost roughly 12.2% in a single session.
⚠️ Personal market analysis only. NFA — manage risk and DYOR.
Educational content, not investment advice or a recommendation to buy, sell, deposit, or withdraw any asset. No paid promotion or referral/affiliate links.
post-image
CORZ+7.03%
IREN-0.55%
Open a large long position on $WAL
! 🚀Entry range: 0.04995 - 0.05107Take-profit 1: 0.05335Take-profit 2: 0.05562Stop-loss: 0.04795The price is currently testing the 24-hour low of 0.05021, showing signs of stabilization on the 15-minute chart and potentially forming a double bottom. RSI(6) is 44.73, and with the funding rate negative, a short-term trade reverting upward toward the MA25 resistance at 0.05211 is currently the highest-probability strategy. Click here to trade 👇👇👇Other tokens: $SKHYNIX : Current price 981.58 - 24-hour change: -4.95%$AGT : Current price 0.032281 - 24-hour chan
post-image
AGT+113.19%
[New Streamer] Whales Moves in Sync!
live-cover
LIVE1,088
Everyone watching SYMBOL long is about to get blindsided by a sharp drop.

$MU /USDT - SHORT

Trade Plan:
Entry: 927.98 – 934.84
SL: 964.38
TP1: 906.68
TP2: 890.19
TP3: 865.47

Why this setup?


Debate:
Are we testing TP2 or is 994.50 about to flip this setup?

⚠️ Personal market analysis only. NFA — manage risk and DYOR.
Educational content, not investment advice or a recommendation to buy, sell, deposit, or withdraw any asset. No paid promotion or referral/affiliate links.
MU+0.97%
Sky has burned 7.37M SKY in its second monthly burn, roughly 2.6x the 2.86M SKY removed in the first. Each burn is funded by 5% of Sky's monthly net protocol surplus.
@SkyEcosystem
SKY+0.71%
Which step is the easiest to be fooled by in this $PYTH rally?
When I looked at $PYTH again, I first covered up the 24-hour +13.69%. It’s not that this figure is unimportant, but it is too good at grabbing attention. What really needs explaining right now is that after $PYTH’s sharp 24-hour surge, momentum and continuation are not the same thing. I won’t extrapolate the large move that has already happened into the next leg; I’ll first see whether the price can hold in the new range.
Laying out the market, the current price is 0.09408, with a 24-hour range of 0.08063–0.10094. The 1-hour suppo
post-image
PYTH+8.88%
I can't be the only one 😭
post-image
With the same 1000U, some people are holding the bag at $WAL 0.0677, while others who bottom-fished at 0.0502 are already laughing. It is now 0.0512, down 15.7% in 24 hours, with a 565M trading volume—what does that indicate? Panic sellers are fleeing, but with selling this fierce, who is taking the other side?
Round one: the volume showdown. A 565M trading volume at this market-cap level means the turnover rate has been pushed to the limit. Rising volume during a decline either means the main players are unloading or that the market is shaking out and rotating holders. What is the difference
WAL-16.21%
Why is big money watching the PPI rather than the CPI?
CPI is a statement of fact (what people have already overpaid for in stores). PPI is a look into the future (what costs businesses are bearing now). If raw materials and production become more expensive, producers will inevitably pass these costs on to end consumers within 1–2 months.
Conclusion: High PPI today guarantees high CPI tomorrow. Major players reduce risks based specifically on PPI, without waiting for consumer reports.
#USCPISoon #ShareWeekly
$AAOI
The correction continues. If the index hadn’t made a liquidity sweep, the other path would have remained valid. Today, it pulled back to the monthly EMA21-$74. On the other hand, it has also dipped as far as the support band during previous corrections. I normally use the support band as my reference for trends anyway.
I still think it’s forming a handle here. There’s no topping structure like the one at the 2017 peak
post-image
AAOI-2.87%
INDEX-1.54%
$ICNT Up 21% in half a day, it surged straight from 0.1015 to 0.1371, with 13.7M in trading volume pouring in. That’s not the kind of volume retail investors can generate. I took a quick look on-chain just now: the top 10 addresses’ holding concentration hasn’t declined, indicating this move is not distribution but someone accumulating. On the macro side, here’s an anchor: during the week when the Fed minutes leaned hawkish, the 30-day correlation between altcoins and the Nasdaq surged to 0.78. Small-cap assets like ICNT have higher beta, so as long as rate-hike expectations don’t rebound, it
ICNT+23.11%
Live trading - Analysis new crypto coin
live-cover
LIVE2,210
The second target has been reached at 0.03300. Keep your eyes on it and secure your profits. Congratulations! 🎉🤑💰👇$AKE
post-image
AKE+21.31%
BTC is currently around 82400; after the previous pullback, it has staged a short-term corrective rebound, but the upside follow-through is weak. This is a technical recovery after the decline, with no trend reversal signal appearing for now. The broader structure remains range-bound with a bearish bias.

On the 4-hour chart, the price is below the moving averages, and rebound volume is insufficient, indicating a weak consolidative recovery. The overhead resistance zone is substantial. As long as the price fails to firmly hold above resistance, this rebound is more likely to be a continuation
post-image
BTC+0.35%
Nothing says privacy like walking around with a phone with the Ledger logo on the back
post-image
Load More

Join 40 M users in our growing community

⚡️ Join 40 M users in the crypto craze discussion

💬 Engage with your favorite top creators

👍 See what interests you

Trending Topics

USSeptemberPPIBeatsExpectations

91.35k Views1.88k Discussing

US September PPI came in at 6.3% YoY, well above the 5.3% market expectation, pointing to renewed producer-side inflation pressure. Weekly jobless claims were 199K, broadly in line with forecasts. Could hotter inflation further reduce room for rate cuts, and what does it mean for $BTC, US stocks, and gold?

DrLinHanSpeaksAtOxfordUnion

135.63k Views1.86k Discussing

JapanAndKoreaStocksPlunge

47.27k Views1.76k Discussing

View More