Square
Following
Hot
News
Notifications
Profile
Share your thoughts
placeholder
Article
Just opened a short position on $SWARMS
.
Entry range (in batches): 0.00718 – 0.00734 Stop: 0.00769🎯 First target: 0.00670🎯 Second target: 0.00665🎯 Third target: 0.00643
$SWARMS is currently +14.57%; the rebound offered a good shorting opportunity.
Risk warning: The above is only a sharing of my personal trading ideas and does not constitute investment advice. Contract trading carries extremely high risk, so please manage your position size carefully.
post-image
SWARMS-3.69%
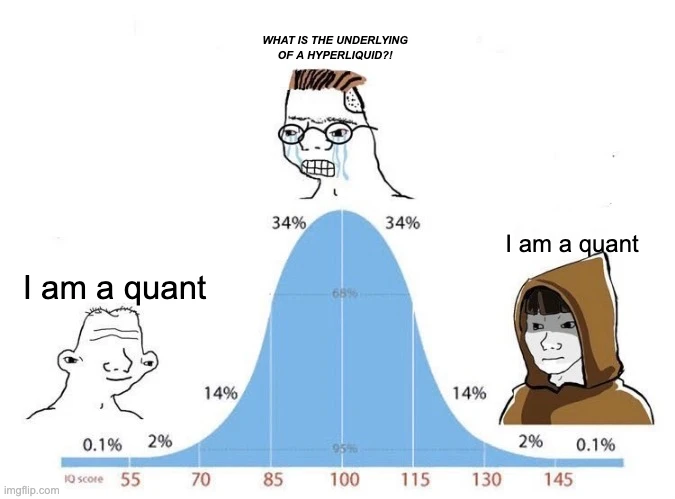
Normies need to decrease or increase their IQ to do well this supercycle...few.
post-image
Trenches
ZIG
Z
bade
b
ZIG
0x8c...1145
Market Cap
$.
Change
.
24h Vol
$.
Holders
.
BTC
B
bade
b
BTC
C5xp...pump
Market Cap
$.
Change
.
24h Vol
$.
Holders
.
IDOL
I
bade
b
IDOL
0x3b...ab07
Market Cap
$.
Change
.
24h Vol
$.
Holders
.
scamsem
s
bade
b
scamsem
41Wp...pump
Market Cap
$.
Change
.
24h Vol
$.
Holders
.
José
J
bade
b
José
87CQ...1UJT
Market Cap
$.
Change
.
24h Vol
$.
Holders
.
$COTI After weathering a prolonged, gradual decline, it finally printed a solid 1-hour bullish candle. Buyers pushed the price back above $0.0100 in one go, and buying momentum is clearly returning. The key now is whether it can firmly hold the $0.01021 level. If it does, there’s still room to move higher. The key level to watch is $0.01021—don’t rush to chase the first rally; it’s safer to wait for a pullback to confirm the breakout level is holding before acting. Keep an eye on SNDK as well. $TRUMP Risk warning: The above is only a market observation and does not constitute investment advice
post-image
COTI-2.75%
TRUMP-0.95%
Benjamin Cowen warns Bitcoin could repeat 2018 price crash
Benjamin Cowen warns that Bitcoin could face further pressure in the final months of 2026.
According to his latest analysis, a sharp sell-off in the U.S. stock market could continue to pressure Bitcoin. Cowen points to several similarities between the current environment and 2018, when U.S. stocks rose immediately after the midterm elections before quickly reversing course.
⚠️ Personal market analysis only. NFA — manage risk and DYOR.
Educational content, not investment advice or a recommendation to buy, sell, deposit, or withdraw any
post-image
BTC-0.67%
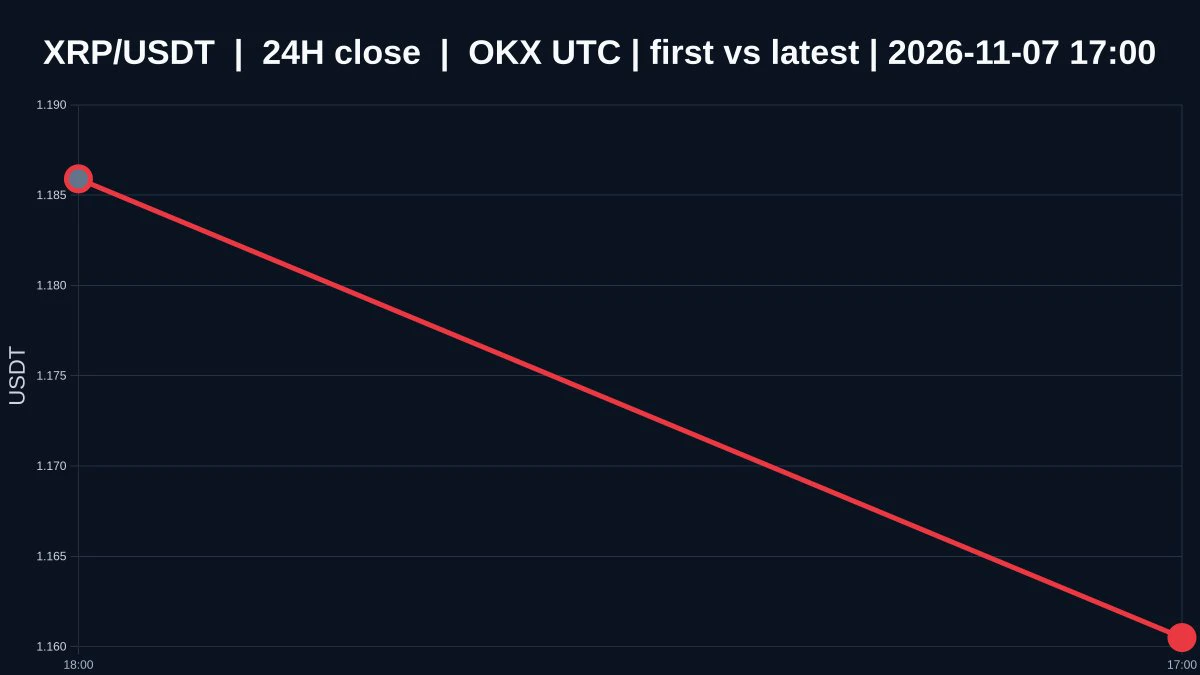
After $XRP Has Fallen This Far, What Really Matters Is Not Sentiment

Demand for a rebound has emerged, but I won’t call oversold conditions a bottom until the structure stops weakening. $XRP is currently priced at 1.1614, down 2.7873106219134636% over 24 hours, with an intraday low of 1.1518 and a high of 1.1969. The 1-hour and 4-hour trends are both weak, the volume ratio is 0.012999983166659875, and market participation is extremely low.

A steep decline only shows that selling pressure has occurred. It doesn’t automatically mean the price is cheap, let alone prove that buyers are actually
post-image
XRP-1.15%
📣 November 6 Daily Top Posts: Good insights deserve to be seen
When will heavy AI investment deliver returns? Does an index rebound mean the market is strengthening? After making a bad trading call, how should you reassess your thinking?
These 8 posts cover everything from market analysis to trading reflections. Let’s take a look at what creators are observing👇
🔹 @赚钱吃肉肉: Ongoing AI investment: Can profits and cash flow keep up?
https://www.gate.com/zh/post/status/curated/25443255
🔹 @龙抄手: Rebound or reversal? A video anal
post-image
BTC-0.67%
ETH-1.26%
NDAQ+0.28%
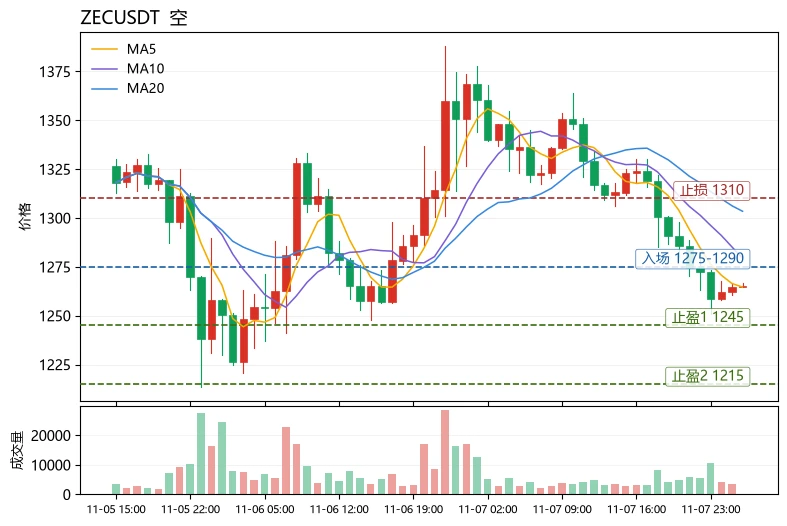
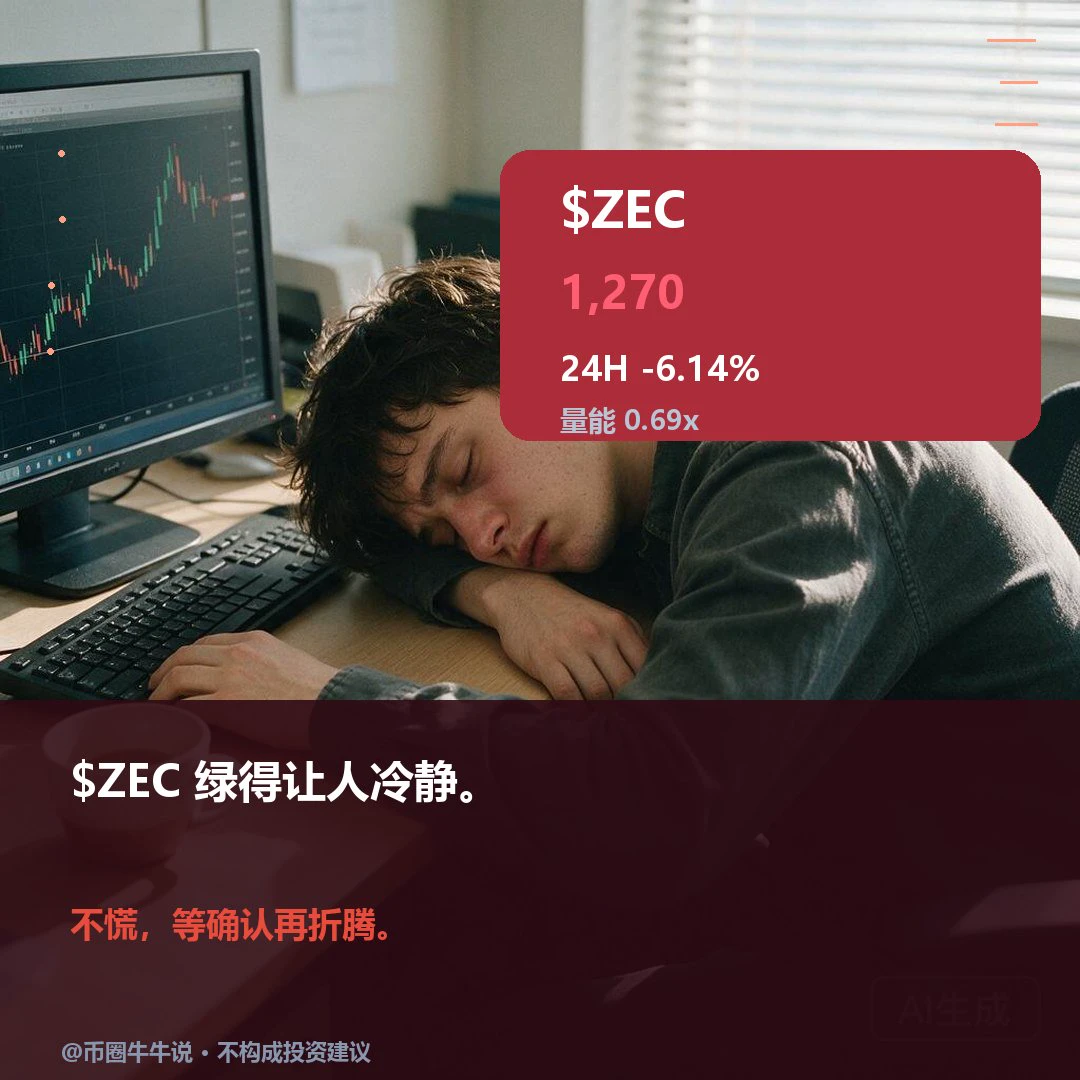
$ZEC Current price: 1265.39. The first resistance above is 1303.45 (MA20), while 1245.75 (lower Bollinger Band) is the line bulls must hold. Price has fallen below MA20 and MA5 has crossed below it; the MACD histogram remains bearish at -6.352, and RSI at 35.6 is nearing oversold territory but has not bottomed. The 10.84% range over 30 candles indicates elevated wick risk. More importantly, the funding rate remains +0.0100%: as the price falls, bulls continue paying to hold their positions, suggesting leveraged longs have not yet been flushed out. Funding favors bears, and chasing longs risks
post-image
eur
eureur
Gate.Fun
MC:$5.55KHolders:3
0.06%
ZEC+1.16%
ADA-1.48%
Live trading - Analysis crypto coin
live-cover
LIVE581
Core Automation trained one AI model in two data centers 9,000 miles apart, and it came out about 1% better than training in one place on the same compute.
The US and Asian sites only had to exchange updates every 50 training steps. I like these types of tests.
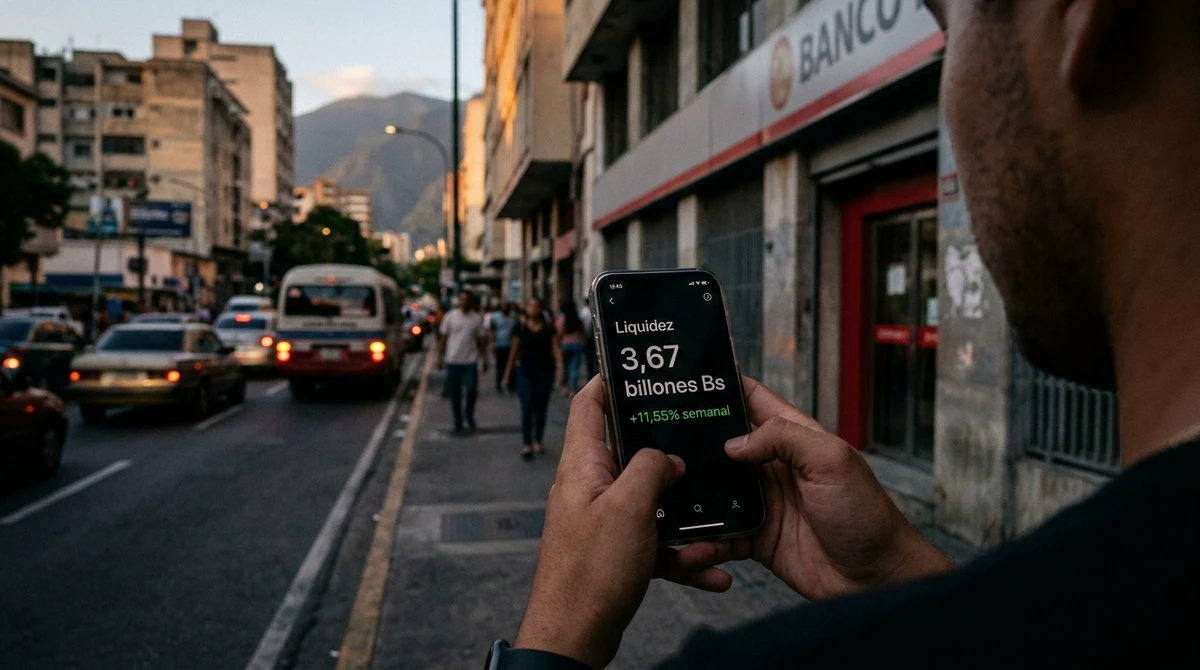
📊 Record liquidity: 3.67 trillion bolivars put pressure on P2P
Monetary liquidity grew 11.55% in just seven days, reaching 3 trillion 669,557 million bolivars—the strongest weekly jump since late November 2025. This isn’t abstract macroeconomics: it puts direct pressure on the parallel dollar’s price and on how quickly bolivars need to be moved.
🔹 The hard numbers
• Monetary liquidity: 3.67 trillion bolivars (+11.55% weekly)
• Demand deposits: 3.20 trillion (+11.59% weekly)
• Currency in circulation: +317.87% in 2026 · Year over year: +538.21%
• Official dollar rate: ~Bs. 900 (+201.04% in 20
post-image
🔹 High prices continue to erode purchasing power, and US consumer confidence remains weak.
live-cover
LIVE2,405
This time is different from before. If it breaks above 0.005, the target is 0.01🤯$ONE friend, be careful..$BIRB
$AIN
post-image
ONE-1.19%
BIRB-16.68%
AIN+3.85%
$XAG Copy the bot below for free. Increase returns and reduce risks.
XAG+0.47%
At three in the morning, my phone screen was still lit, and my account balance had dropped another notch—this time, I was down more than 300 U.
I’d figured weekend liquidity was low and the market would probably just drift along, but the longer I watched, the more awake I got. This kind of slow, steady decline is the most agonizing; every time I refresh the page, it feels like I’m putting myself through a psychological test.
Here’s a look at my current positions:
$BT contract entry average price: 78596.8; the current price has already slipped to 75787.8, with an unrealized loss of -194.94U (R
post-image
SNDK-0.18%
Are these tariffs really moving trillions of dollars into the U.S.? Navarro makes it sound like it’s actually happening, but I’ve been watching trade flows for a while, and something just doesn’t add up. Anyway, I learned my lesson with stop-losses: I set them too tight and got stopped out twice, so now I keep them way farther away. Hope I’m wrong this time—if I am, that means the market still has room to run.
#Tariffs
If you’re keeping an eye on this, give me a follow.
post-image
$ONE The market makers are weak—why can’t they pump me into liquidation?
post-image
ONE-1.19%
#BTCETH反彈交易思路 #WCTCS9 Strategy shared for reference only; trade at your own risk.

BTC futures strategy (latest reference price around 75900)
1. Buy low
Entry: 74350 - 74650
Take profit: 76000 / 77200
Stop loss: 73700

2. Short
Entry: 76900 - 77200
Take profit: 75600 / 74400
Stop loss: 77750

Ethereum futures strategy (latest reference price around 2245)
1. Buy low
Entry: 2185 - 2205
Take profit: 2270 / 2350
Stop loss: 2150

2. Short
Entry: 2315 - 2335
Take profit: 2250 / 2185
Stop loss: 2370

⚠️⚠️
Use these levels flexibly. Avoid oversized positions and don't hold losing trades st
post-image
BTC-0.65%
ETH-1.23%
$ZEC Currently at 1270.43, down 6.14% over 24H (range: 1250.67–1364.08). The 1H trend is weak, with RSI at 25.74, price below the EMA20 at 1293.33, and a volume ratio of 0.69. The 4H trend is weak, with RSI at 42.91, price below the EMA20 at 1287.32, support at 1159.00, and resistance at 1387.89. A sustained move above the 1364.08 resistance could signal continuation; a break below the 1250.67 support would weaken the structure. In the review, check whether price holds above 1364.08 and recovers 1250.67; volume is only 0.69x. A hold without volume or failure to recover after a breakdown would
post-image
ZEC+1.16%
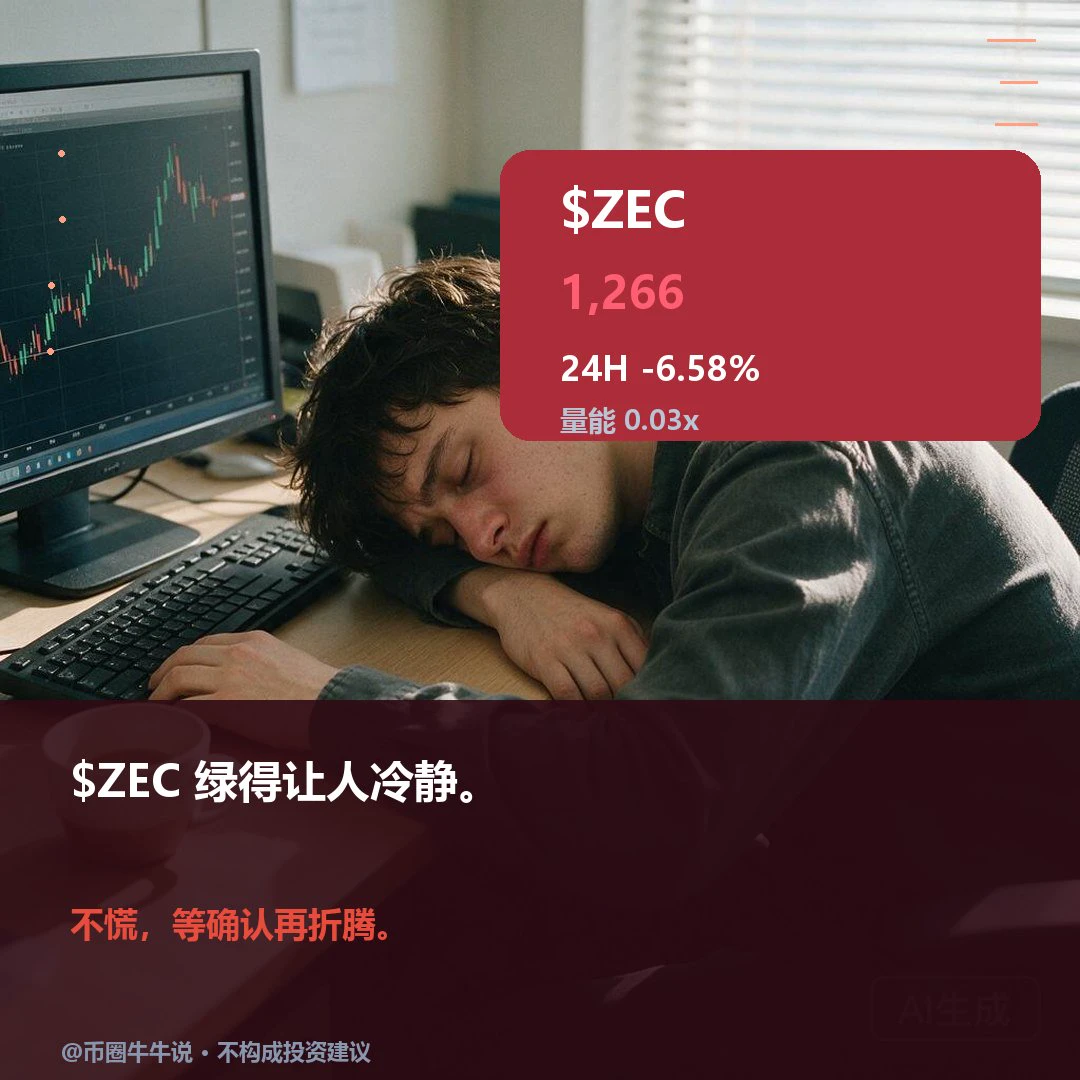
$ZEC Currently at 1266.05, down 6.58% over 24H (range: 1250.67–1367.59). The 1H outlook is weak, with RSI at 21.73; price is below the EMA20 at 1292.87, and the volume ratio is 0.03. The 4H outlook is weak, with RSI at 42.10; price is below the EMA20 at 1286.86. If price holds above the 1364.08 resistance level, watch for continuation; a break below the 1250.67 support level would weaken the structure. Review whether price holds above 1364.08 and reclaims 1250.67; volume is only 0.03x. A hold without volume or a failure to reclaim the level after a breakdown would invalidate the setup. Market
post-image
ZEC+1.16%
Load More

Join 40 M users in our growing community

⚡️ Join 40 M users in the crypto craze discussion

💬 Engage with your favorite top creators

👍 See what interests you

Trending Topics

USAIStocksHitHard

20.5k Views3.67k Discussing

U.S. stocks sold off sharply on Thursday, November 5 (UTC). The Nasdaq closed down around 5.5%, entering correction territory, while the Philadelphia Semiconductor Index plunged roughly 12%, with chip stocks including $NVDA and $AMD posting steep losses. Beyond profit-taking, investors are growing concerned about the pace of AI data center construction, capital spending, and future returns on investment. The key question now is whether the AI sector’s lofty growth expectations need to be repriced. Where do you think the next opportunities will emerge: chip stocks, tech giants, or other sectors?

USNonfarmPayrolls

32.83k Views4.34k Discussing

StakeOnLaunchpoolToShare450KVLX

8.87k Views824 Discussing

View More