Square
Following
Hot
News
Notifications
Profile
Share your thoughts
placeholder
Article
Early-session short positions played out as expected, with ETH breaking below the 2,000 level and continuing lower.

Daily candles have closed lower for consecutive sessions, moving averages are aligned bearishly, Bollinger Bands are opening downward, and MACD’s green bars persist, with bearish momentum showing no clear signs of exhaustion.

The signs of a storm were already there: the structure was weak even before the breakdown. Follow the trend and stay steady for the long run.

Watch the 1850-1880 support zone below; rebounds facing resistance remain opportunities to short. $ETH
ETH-1.23%
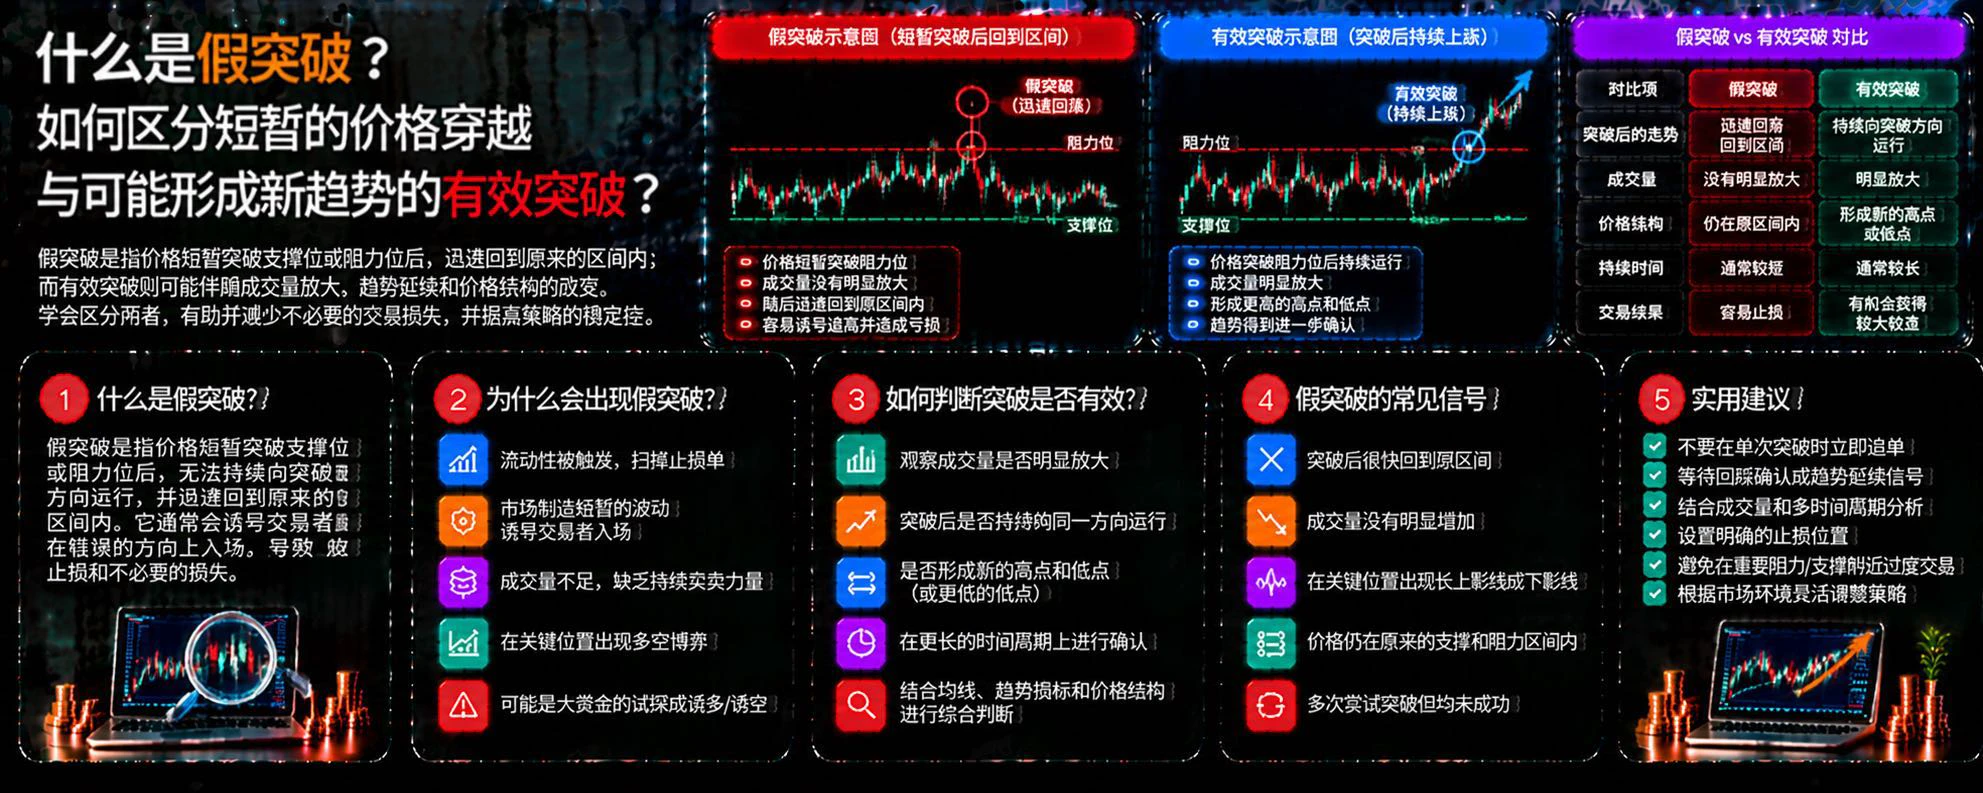
What Is a False Breakout? How Can You Distinguish a Brief Price Break from a Valid Breakout That May Form a New Trend?

In crypto trading, many people immediately chase the price when it breaks through a key resistance level, and rush to short when it falls below support. But sometimes the price only briefly moves beyond a key level, then quickly returns to its original range. This phenomenon is called a false breakout, and it is one of the risks traders often overlook.

First, what is a false breakout?

A false breakout occurs when the price briefly breaks through a support or resistance leve
post-image
Trenches
mihao
m
bade
b
mihao
4Cxj...pump
Market Cap
$.
Change
.
24h Vol
$.
Holders
.
AGT
A
bade
b
AGT
0x5d...e274
Market Cap
$.
Change
.
24h Vol
$.
Holders
.
FOOD
F
bade
b
FOOD
FTu5...pump
Market Cap
$.
Change
.
24h Vol
$.
Holders
.
IDOL
I
bade
b
IDOL
0x3b...ab07
Market Cap
$.
Change
.
24h Vol
$.
Holders
.
AI
A
bade
b
AI
2T56...pump
Market Cap
$.
Change
.
24h Vol
$.
Holders
.
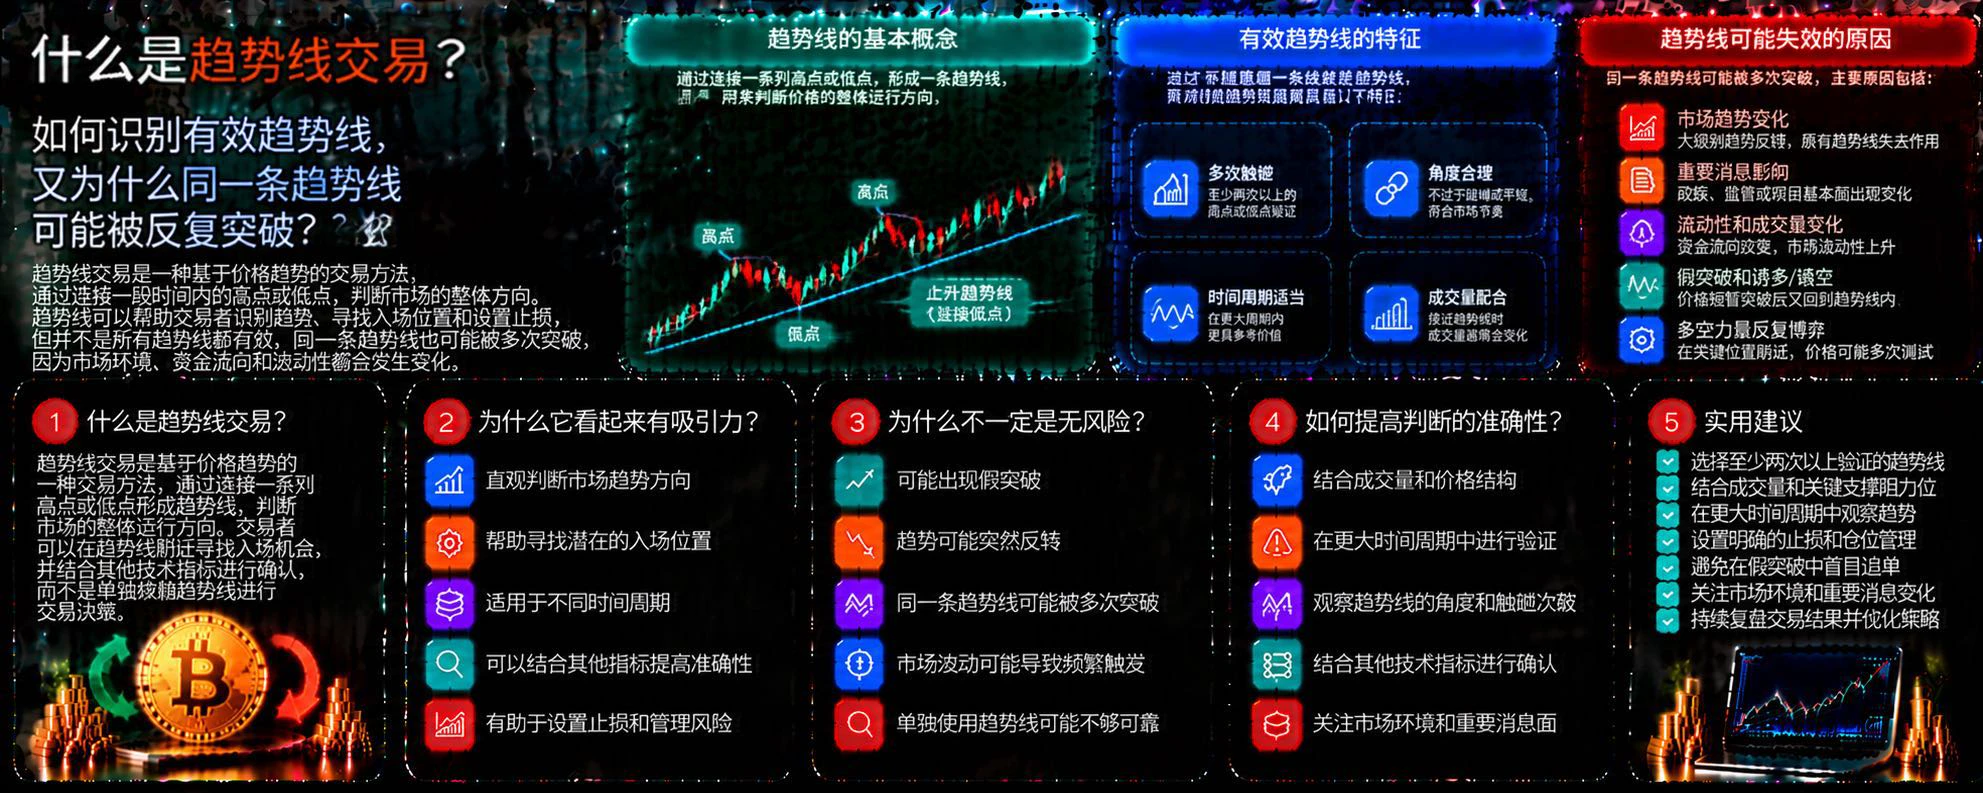
What Is Trendline Trading? How Can You Identify a Valid Trendline, and Why Might the Same Trendline Be Broken Repeatedly?

In cryptocurrency trading, trendlines are an intuitive technical analysis tool. By connecting a series of price highs or lows, traders can observe the market’s overall direction and look for potential entry and exit opportunities. But trendlines are not unbreakable boundaries. No matter how neatly they are drawn, they cannot guarantee that prices will move as expected.

First, what is trendline trading?

Trendline trading involves connecting significant price highs or lows
post-image
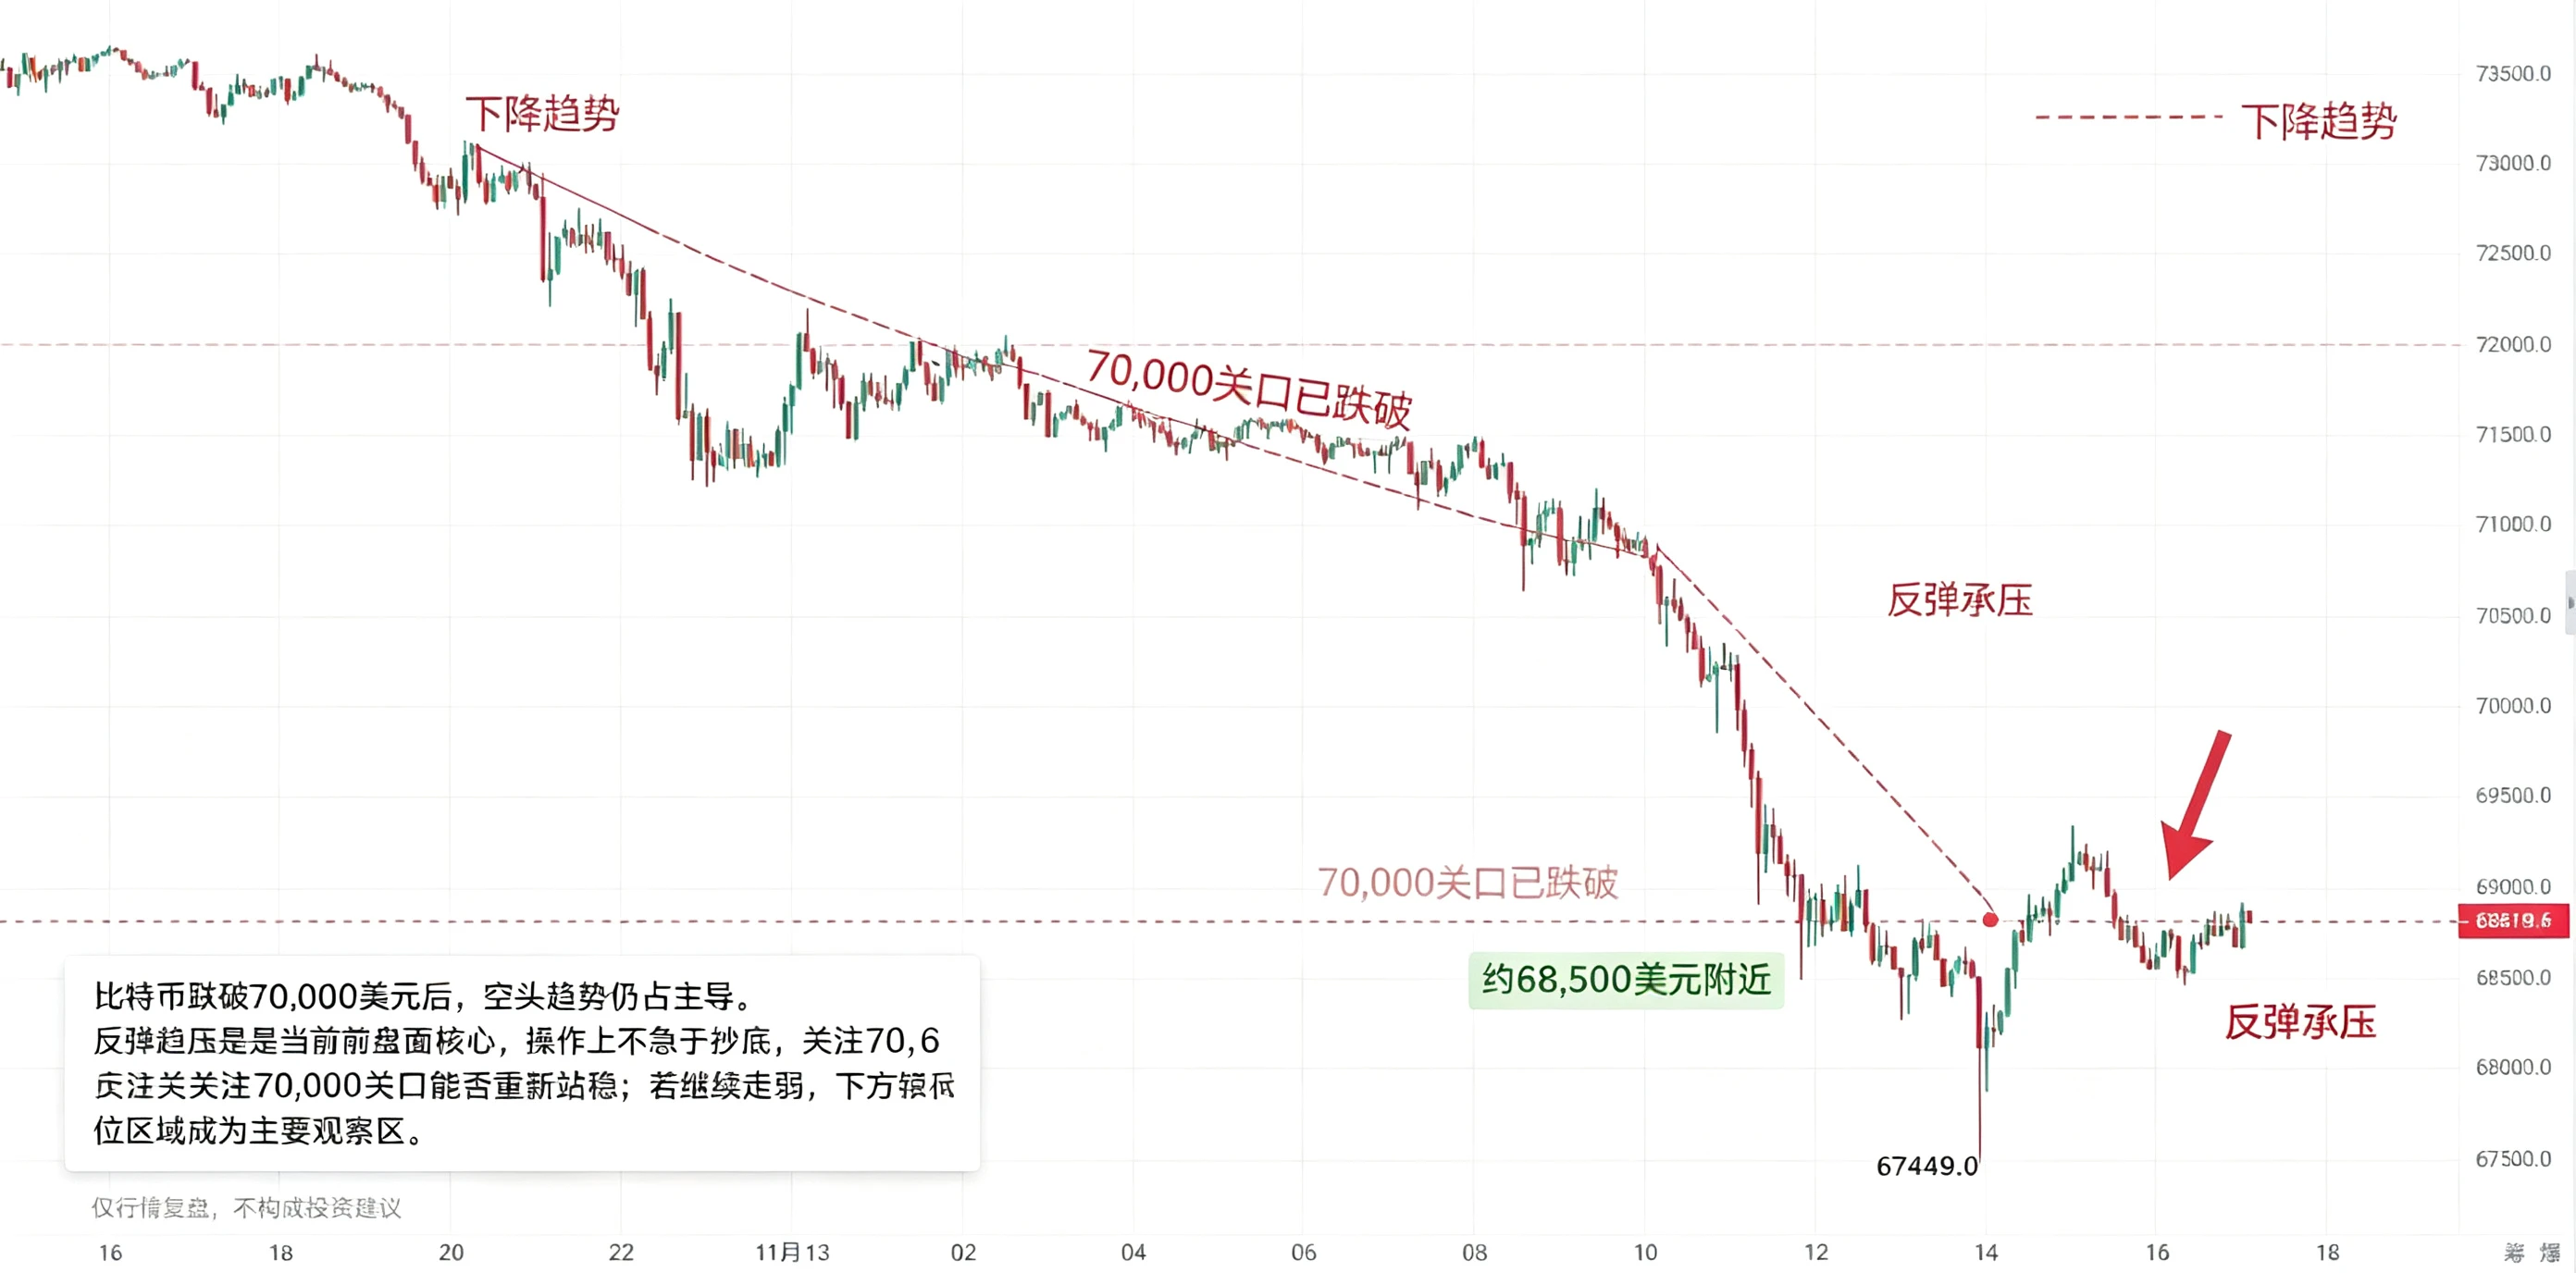
Watch whether Bitcoin can reclaim and hold the 70,000 level; if weakness continues, the lower price zone remains the key area to monitor.

Bitcoin has continued to weaken from its highs, falling to a new recent low of 67449 before a slight rebound. It is currently moving sideways near the lows around 68800.
The broader trend remains dominated by bears. This decline has been driven by macro factors such as inflation and expectations of high interest rates. The current rebound is a recovery after the sell-off, not a reversal.
With heavy resistance overhead, prioritize looking to short rallies un
post-image
BTC-0.67%
doge market updates
live-cover
LIVE2,103
I won't short $BTC here. At least not at this price. After that brutal crash, $BTC is finally showing signs of recovery. Buyers are starting to step in, and the $68,000 support area has held up quite well. I think if buyers continue to defend this level, this could be the bottom. My next target is $71,200, and I think there's a large liquidity zone above the price. We all know how much the market loves liquidity. I expect $BTC to move toward that level before deciding on its next direction. Be careful shorting here. You could end up being the liquidity the market is looking for.
post-image
BTC-0.67%
Why Can the Order Book Look Deep, Yet Liquidity Suddenly Disappear When You Place an Order?

In crypto markets, you may sometimes see a large number of buy orders stacked in the order book and assume there is strong support below. But when prices start falling rapidly, those buy orders can quickly dwindle, and a market that looked stable can suddenly become fragile.

Why does this happen?

First, orders can be canceled at any time.

The order book shows currently visible limit orders, not completed trades. Traders can modify or cancel orders as market conditions change. So large orders only in
post-image
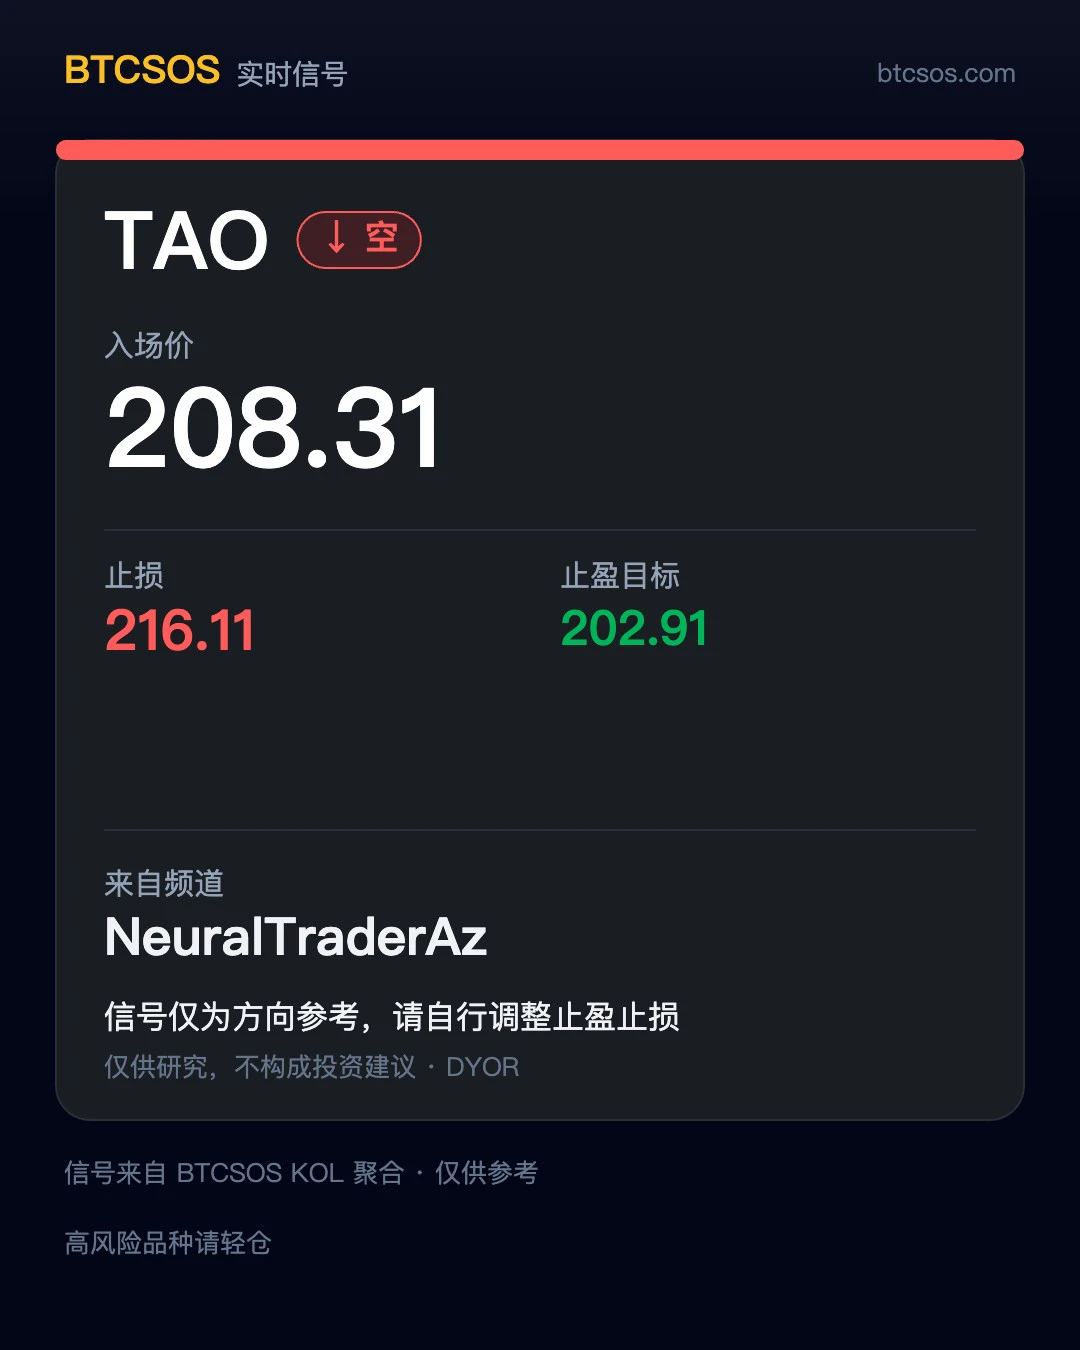
📡 Signal Card · Repost Only
Source: NeuralTraderAz channel signal: $TAO Short position Time: Not specified Entry: 208.31 Target: 202.91 Stop-loss: 216.11
Funny enough, sis just reposted this person's $ERA trade on 11-13, and here they are again—pretty consistent 👀
As usual: sis only reposts the signals as-is, without changing a single number. Whether to follow and how large a position to take is up to you; you bear the risk.
Shared as a personal record, not investment advice. #NBISQ3营收同比增长571%,ARR目标延期 NBIS -18.93% xNBIS -19.02%
post-image
TAO+0.48%
ERA+24.21%
NBIS-16.96%
Am I the person who knows zec best
ZEC+1.29%
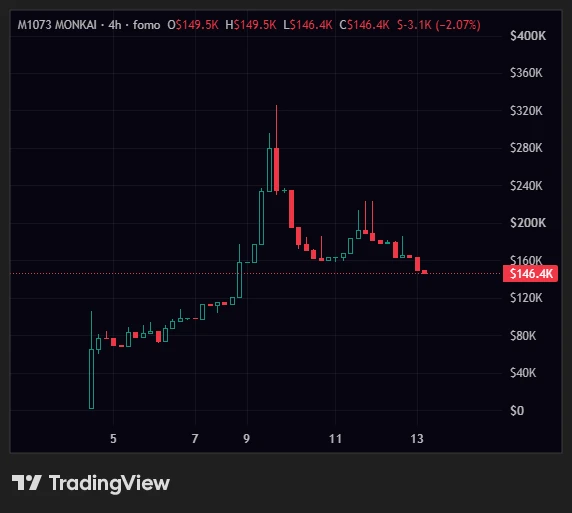
$MONKAI holding up pretty well considering how rough the market has been lately
Honestly I think this is the last entry before it starts making some serious moves
Don't sleep on this one 👀
post-image
KGEN | Long 🟢 | Bullish | 15m24h: +1.57% | Volume: 92.7M USDT Long rationale: Price is above EMA200; EMA20/50/200 are in bullish alignment; RSI14 is 63.5; MACD histogram is positive; ADX14 is 37.3; volume is 0.76 times the 20-candle average; trend pullback/continuation. Entry: 0.0847 Stop-loss: 0.0771184 Take-profit 1: 0.094177 | Take-profit 2: 0.0998632 | Take-profit 3: 0.107445 Entry price for reference only; do not chase the price. The trade setup is invalidated if the stop-loss level is reached. Technical setup only; not financial advice. $KGEN
post-image
KGEN-5.46%
This waterfall is truly magnificent; it washes my mood clean, leaving me utterly delighted.

Steadily hitting another new low! $BTC $ETH
BTC-0.67%
ETH-1.26%
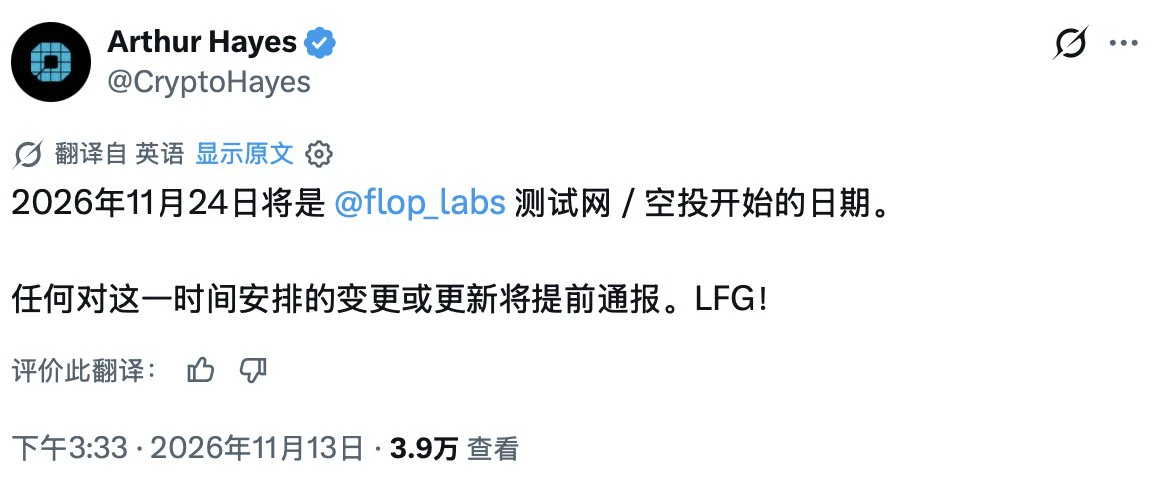
The previously mentioned @flop_labs
is the first project after @CryptoHayes’s comeback
Hayes and the official account both posted today
The testnet is about to launch, with an airdrop; it starts on November 24
The testnet will last about 90 days
Mainnet in Q1 2027
This one’s worth going for
post-image
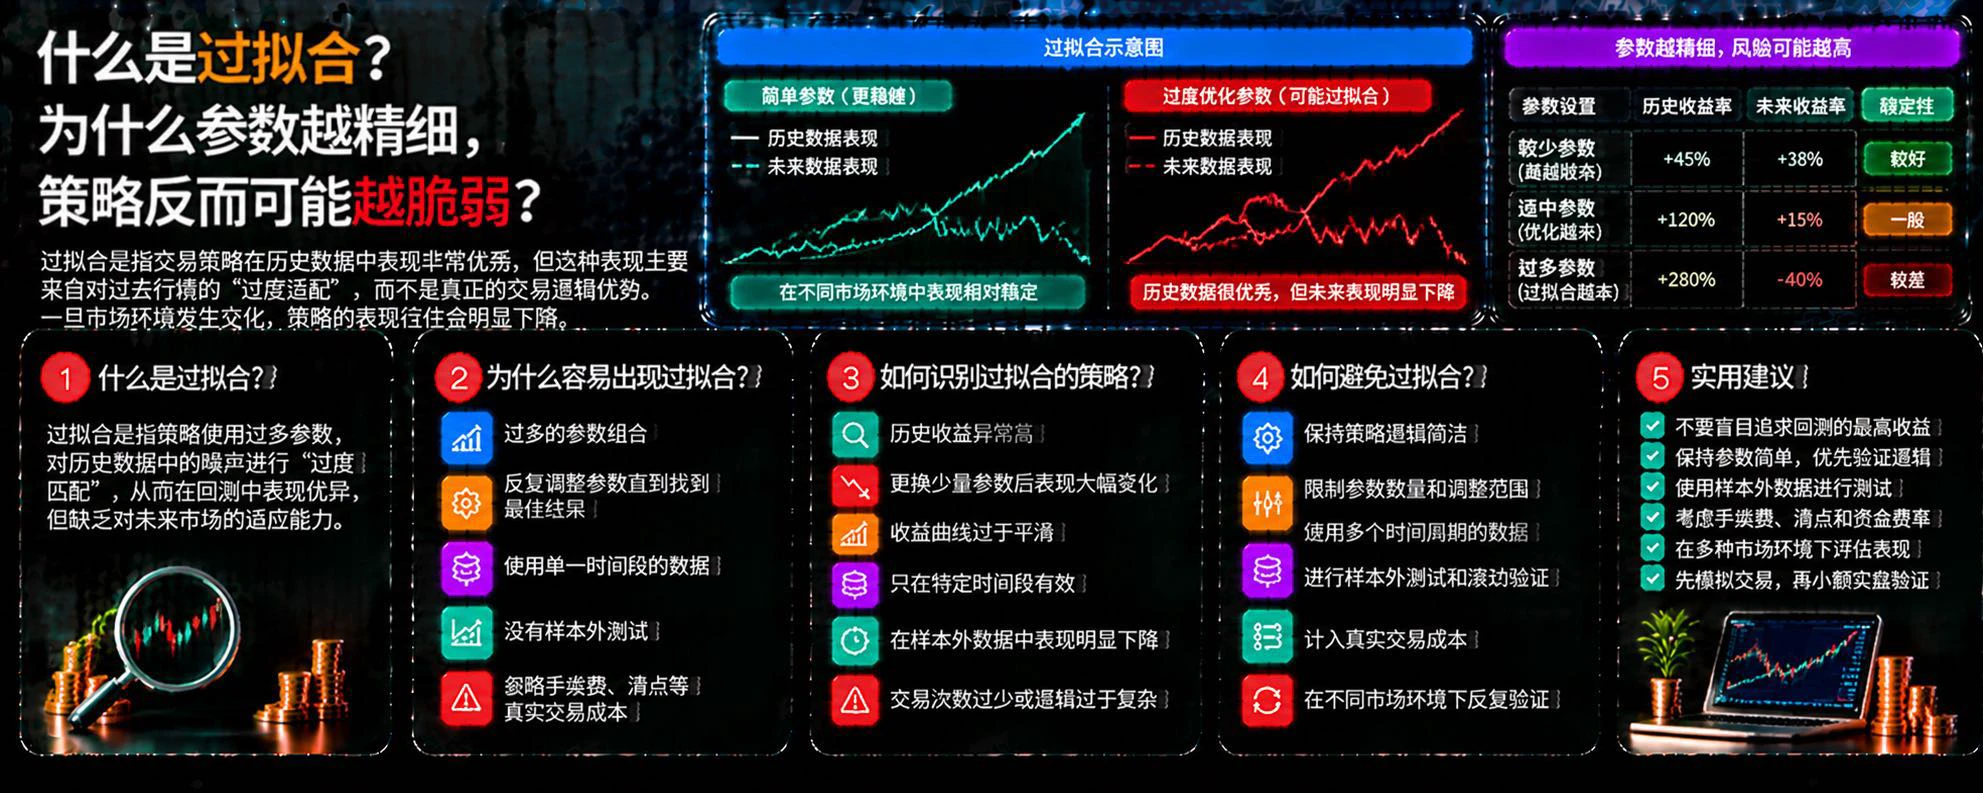
What is look-ahead bias? Why can accidentally using future information in a backtest make an ordinary strategy look exceptionally good?

In cryptocurrency quantitative trading, a strategy’s high historical returns do not necessarily mean it has a genuine trading edge. If information that was not yet available at the time is used during a backtest, it can create look-ahead bias, allowing the strategy to know in advance what will happen and produce results that cannot be replicated in real trading.

First, what is look-ahead bias?

Look-ahead bias refers to mistakenly using future information wh
post-image
NVIDIA Is in Complete Chaos Internally!

An employee went off: Bring Jensen Huang back, and the board can get lost!

Breaking: NVIDIA has descended into complete chaos internally after Jensen Huang was forced to resign over issues in his personal life.

A longtime employee went off in the company’s internal suggestion box, demanding that the board publicly disclose the investigation results, listen to employees, and formally ask everyone whether they want Huang to continue as CEO.
Dr. Han’s “StartAlone” philosophy delivers a powerful lesson: Entrepreneurship begins with individual courage,
post-image
NVDA-4.49%
⚠️ URGENT BTC PANIC SELL-OFF: Where Is Bitcoins Real Bottom? ($65K Next?)
live-cover
LIVE1,701
What Is a Long Liquidation? Why Can the Market See a Cascade of Declines When Prices Fall?

In the cryptocurrency market, prices sometimes initially pull back only slightly, then suddenly accelerate downward. In addition to selling pressure in the spot market, one possible cause is long liquidations.

Understanding the liquidation mechanism helps traders recognize leverage risks and analyze why certain market moves can become unusually volatile in a short time.

First, what is a long liquidation?

Long traders buy assets or open bullish contract positions, expecting prices to rise. When using
post-image
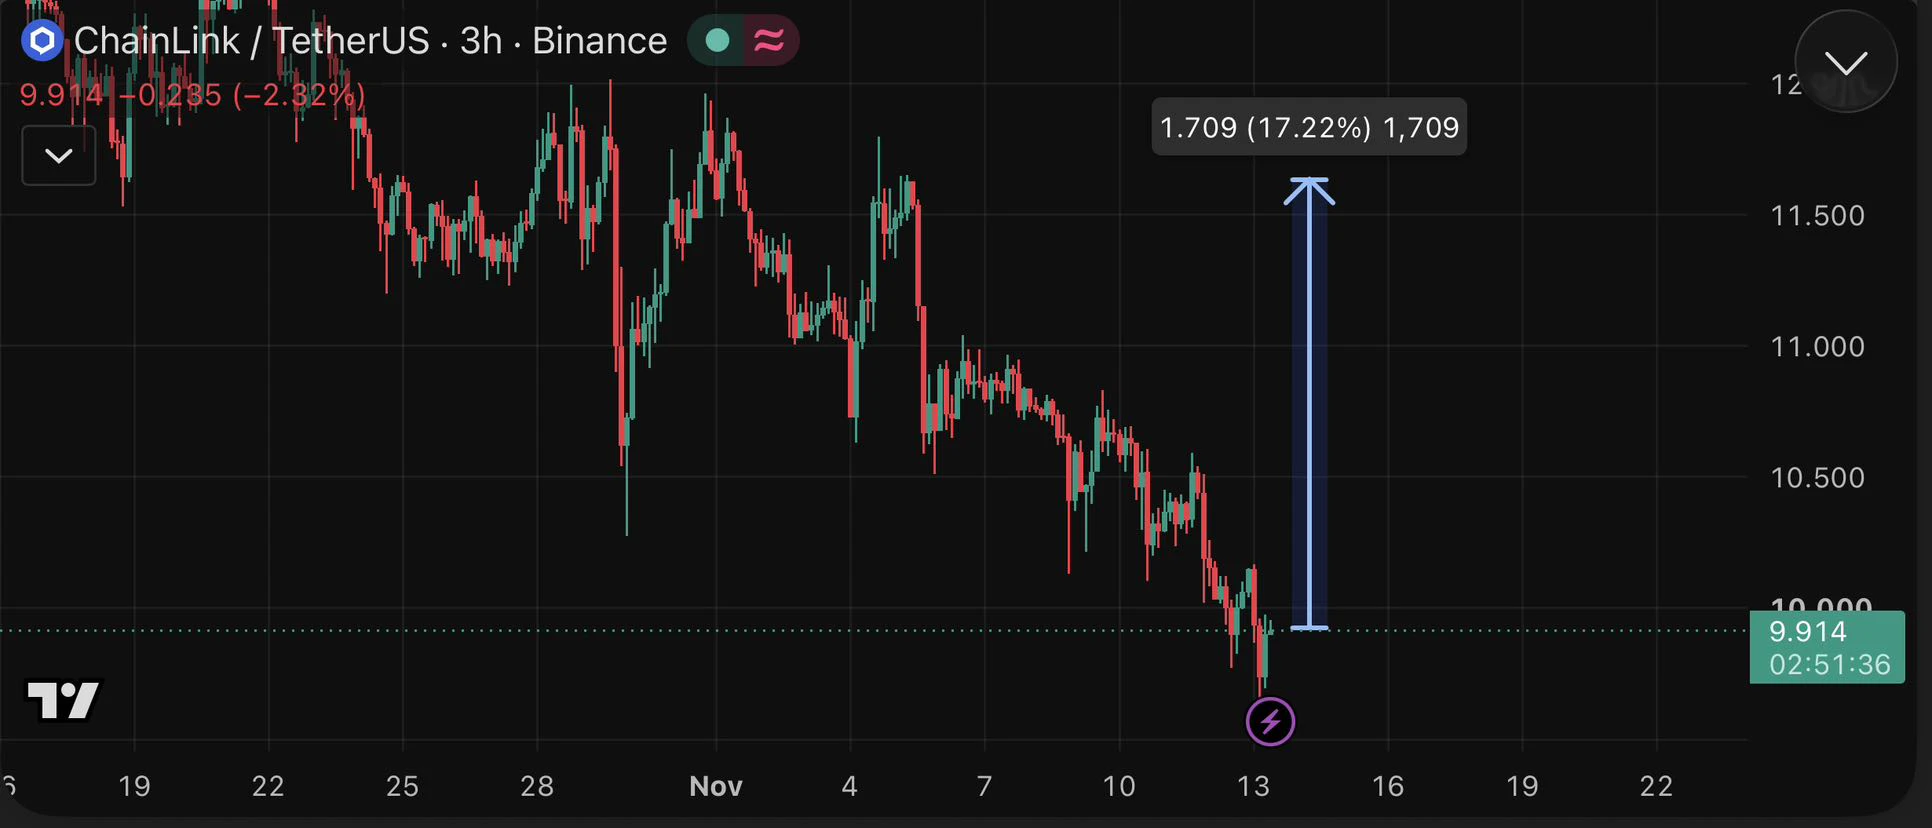
$LINK buyers are defending the $9.90 zone!

A bounce toward $10.50 could be the first recovery signal, with $11.62 as the bigger target.

Can bulls turn things around?

#LINK #Chainlink #Crypto
post-image
LINK-0.18%
  • 2
  • 1
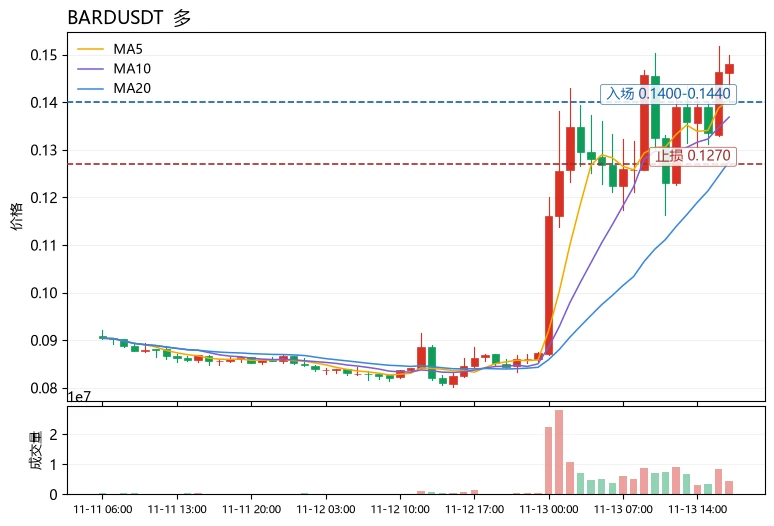
$BARD Current price 0.1481, 24h gain +73.42%, trading volume 19.8M USDT, while $ONE fell 10.90% and $UNI fell 6.42% over the same period, with sector funds clearly concentrating on BARD alone. Technically, MA5=0.14056 has crossed above MA20=0.12757, forming a bullish alignment; the MACD histogram at +0.000752 remains positive; RSI=66.8 has not yet entered overbought territory; and the price is trading between the Bollinger upper band at 0.159459 and the middle band, indicating strength but not an overstretched setup. What is truly noteworthy is the funding rate of -1.9034%: the price has su
post-image
BARD-1.24%
ONE-1.19%
UNI+3.05%
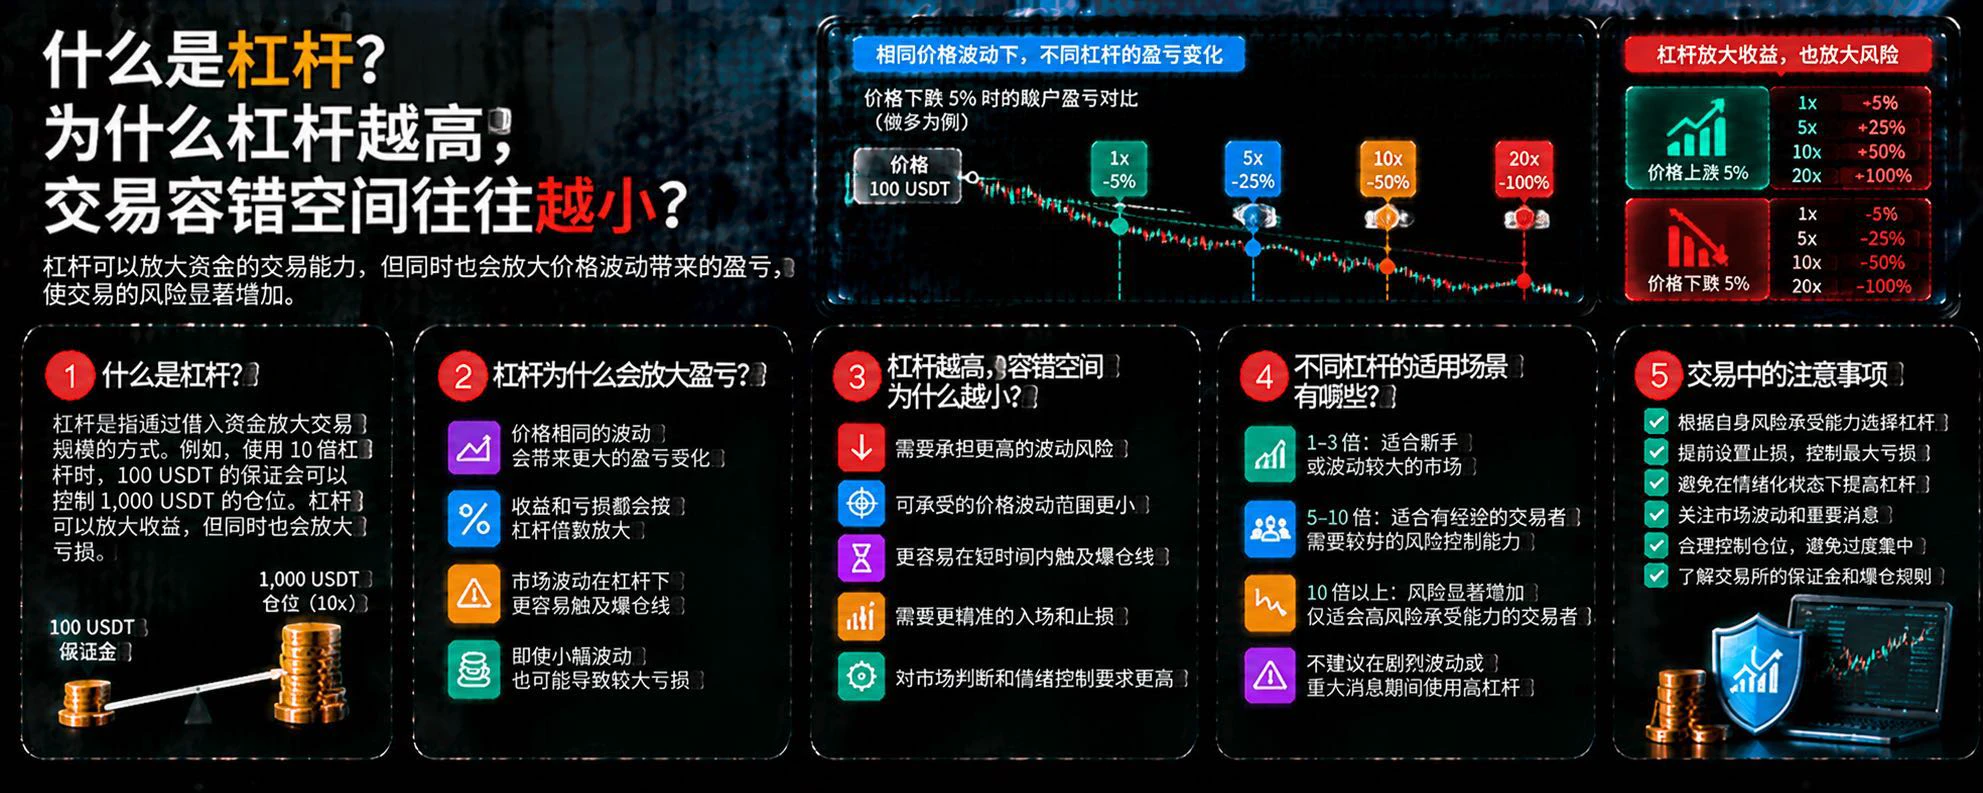
What Is Leverage? Why Does Higher Leverage Often Leave Less Room for Error?

In cryptocurrency trading, leverage allows traders to control a larger position with less margin, but it does not make market risk disappear. On the contrary, the higher the leverage, the greater the impact a price move of the same magnitude usually has on margin.

First, what is leverage?

Leverage is a way to control a larger trading position using margin. For example, ignoring other factors, with 10x leverage, 100 USDT in margin can be used to open a position with a notional value of about 1,000 USDT. But this does
post-image
Load More

Join 40 M users in our growing community

⚡️ Join 40 M users in the crypto craze discussion

💬 Engage with your favorite top creators

👍 See what interests you

Trending Topics

JensenHuangResigns

514.6K Views8K Discussing

Jensen Huang has resigned as NVIDIA CEO and stepped down from the board. CFO Colette Kress will serve as interim CEO while NVIDIA considers internal and external successors. $NVDA fell more than 10% in premarket trading following the announcement. With one of AI’s most influential leaders stepping aside, markets are now reassessing NVIDIA’s leadership stability, AI strategy, and long-term valuation.

GateIPOAccessAnthropic

279.6K Views2.6K Discussing

Dr.HanOxfordUnionSpeech

144.5K Views448 Discussing

View More