Square
Following
Hot
News
Notifications
Profile
Share your thoughts
placeholder
Article
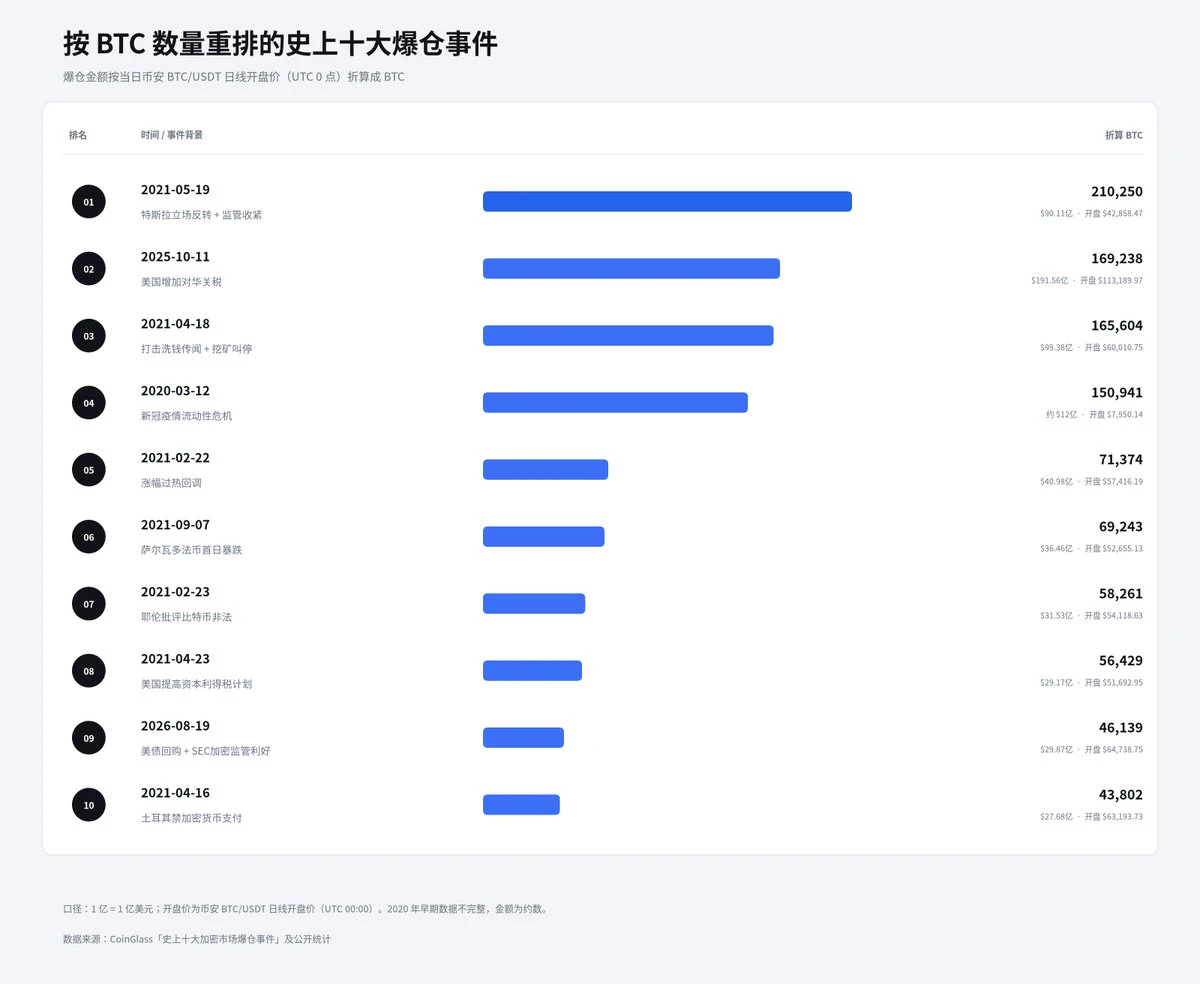
I calculated the top 10 liquidation events based on BTC’s opening price on each corresponding day
Number one was surprisingly 5/19, with 210k liquidated. The next ones, 10/11, 4/18, and 3/12, each saw around 160k liquidated
As shown in the chart, 2021 was really rough. Seven of the top 10 were from that year
post-image
BTC-0.65%
$BTC
Even whales can't take it anymore

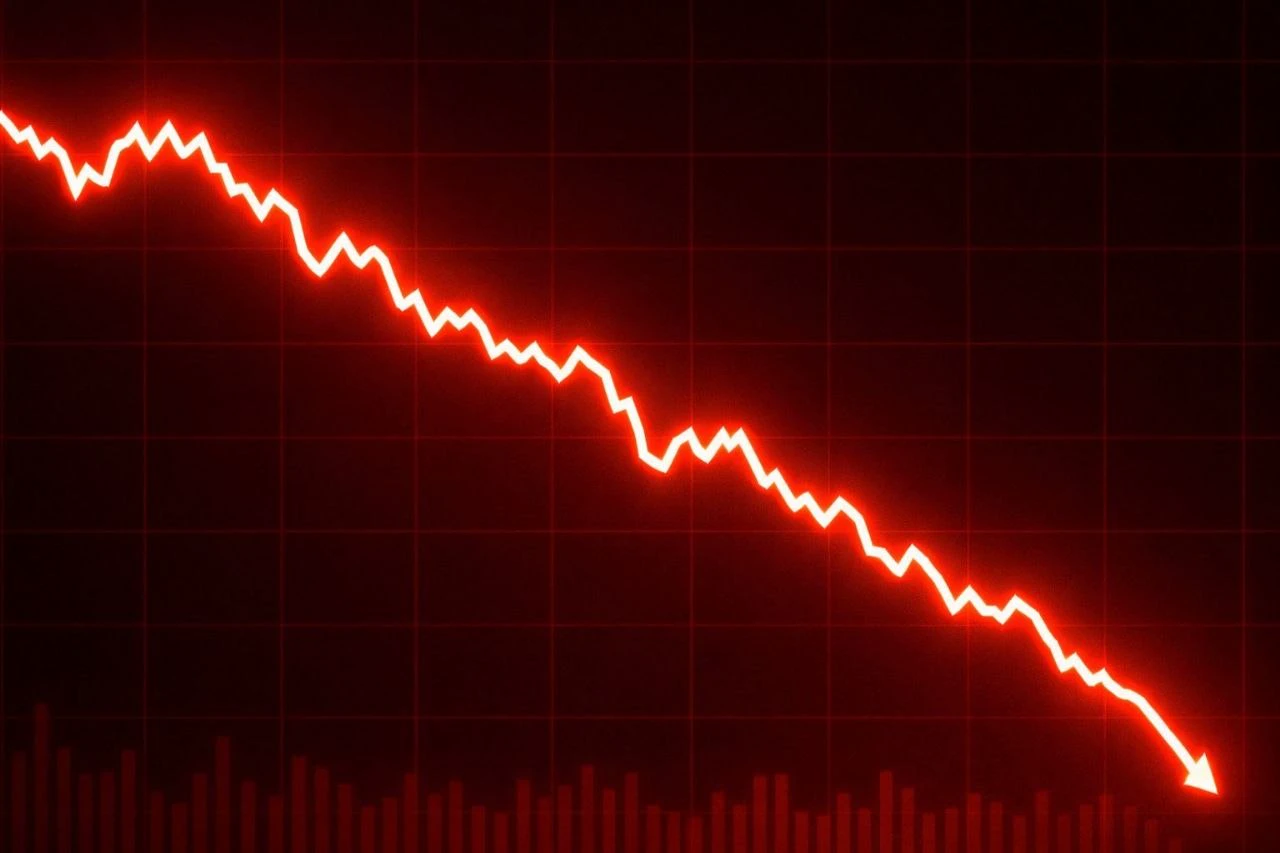
The crypto market suddenly plunged

This time, even the rich got wiped out

Damn

Guys

The crypto world is once again putting on a spectacular display of wealth vanishing

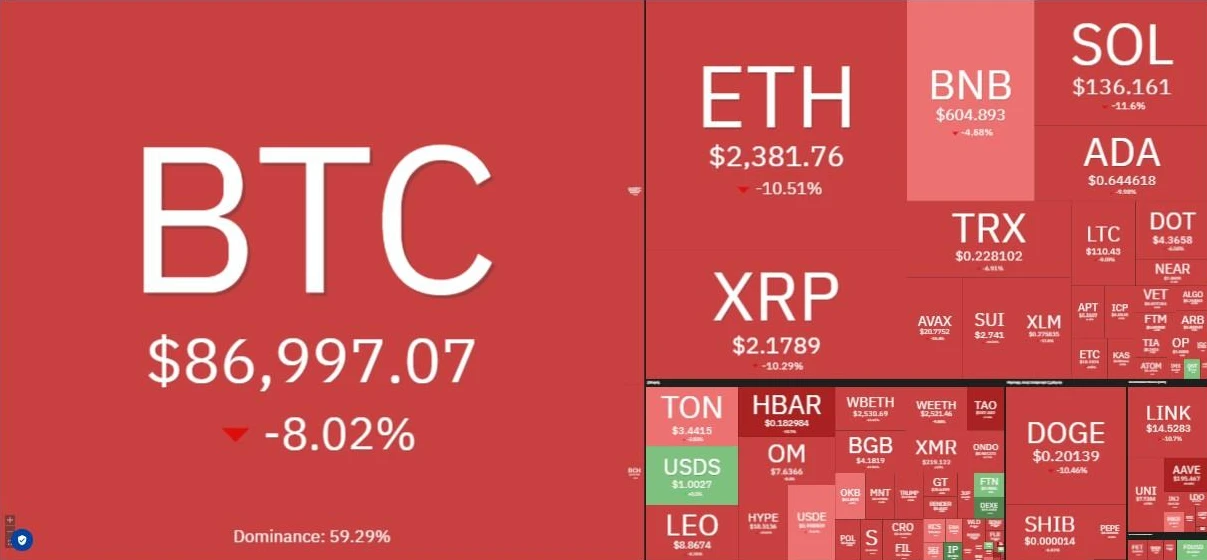
The crypto market has recently seen a significant pullback

BTC, ETH, and a host of altcoins are all under pressure

The derivatives market is especially lively

According to the latest liquidation data

Over the past 24 hours, liquidations in the crypto derivatives market at one point exceeded $800 million

More than 140k positions were forcibly liquidated

Long positions accounted
post-image
BTC-0.65%
Trenches
mihao
m
bade
b
mihao
4Cxj...pump
Market Cap
$.
Change
.
24h Vol
$.
Holders
.
Snoopy
S
bade
b
Snoopy
7mEh...47Cn
Market Cap
$.
Change
.
24h Vol
$.
Holders
.
AGT
A
bade
b
AGT
0x5d...e274
Market Cap
$.
Change
.
24h Vol
$.
Holders
.
PIEVERSE
P
bade
b
PIEVERSE
0x0e...25a9
Market Cap
$.
Change
.
24h Vol
$.
Holders
.
IDOL
I
bade
b
IDOL
0x3b...ab07
Market Cap
$.
Change
.
24h Vol
$.
Holders
.
$SOXL ‌
The chart framework maps out a clear macro-downtrend transitioning into a volatile consolidation phase. The 1D timeframe establishes the primary structure, originating from a high of 169.83 and descending into a structural base around the 38.82 to 54.87 range.

The 1H and 15M charts zoom in on the current micro-structure, detailing a recent localized push from a 52.45 support level up to a 55.77 local resistance, followed by a current retracement. The moving averages (MA5 and MA10) on all timeframes are tightly clustered, indicating a period of compressed volatility and market indec
SOXL-1.16%
  • 1
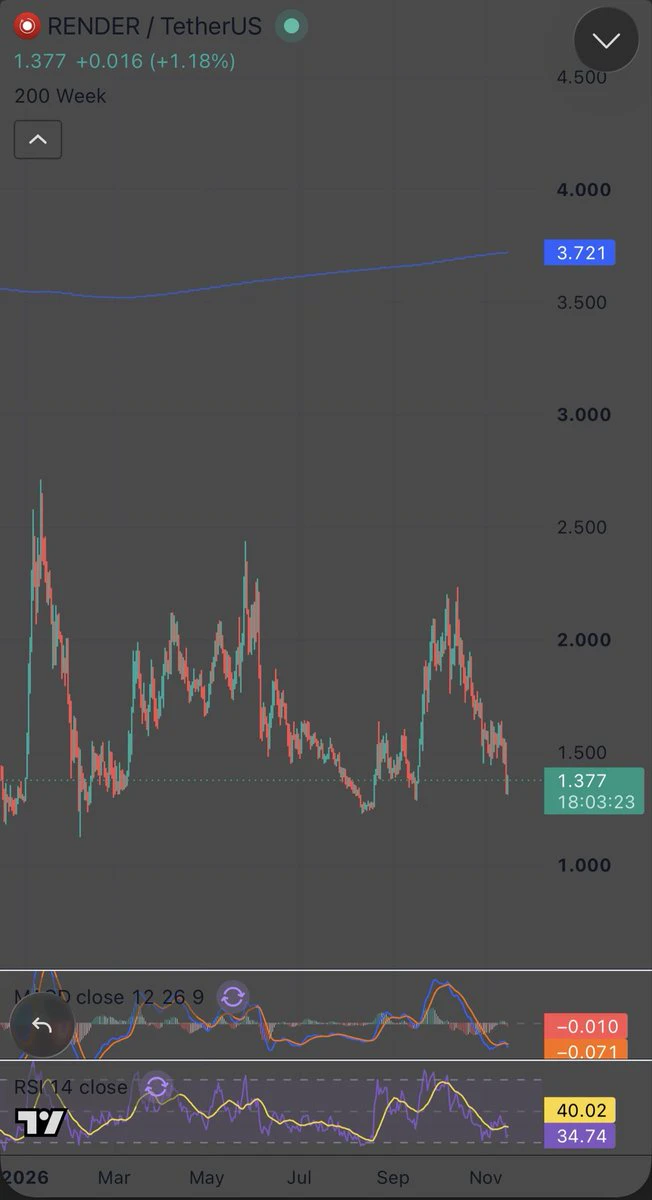
Every $RENDER rally this year has died lower than the one before it.
January topped near $2.70.
May topped near $2.40.
October topped near $2.25.
And every single time, price fell back to the same floor it is sitting on right now.
Here is what the chart is actually saying, and the one level that decides what comes next.
Start with the floor. Since February, buyers have stepped in between $1.15 and $1.35 at least four separate times.
That is real demand. Someone keeps buying this zone.
Now look at the ceiling. Each rally gives up earlier than the last one, so the highs keep sliding down while t
post-image
RENDER+0.47%
$SOPH Bullish strategy is in place

Target: 0.003870; defense level: 0.001500
The current pullback is an opportunity to get in, and the potential upside in the subsequent rally is worth looking forward to. Anyone joining me in a long?
Not investment advice. Entry link 👉🏻 $SOPH
SOPH+24.04%
Risk warning: The above is for sharing my personal views only and does not constitute any investment advice. Contract trading carries extremely high risks. Please strictly manage your positions and bear all gains and losses yourself.
post-image
SOPH-4.34%
@Jason60704294
Target Brother saw his unrealized profit fall from $110 million to $19 million—over $90 million in profits gone just like that. Everyone was shouting that he’d lost $100 million; one long lower wick, and the group chat was saying he was done for.
The numbers are certainly shocking, but this was a profit drawdown, not a loss of principal.
And around 67,000, he also said he’d closed all his leveraged positions at this level and would lie low for now. He closed his 2,615 $BTC long positions, which looks more like he closed them himself—not the liquidation people were claiming.
But
BTC-0.65%
$PENGU It crashed sharply by 17.79% in a single day and is now trading at 0.0049. The 24h low hit 0.0046, with trading value at 98.6M—this isn’t a pullback; it’s a stampede.
The group got the alert right away: risk-off sentiment is clearly evident in US stocks today, Nasdaq futures are weakening, and the dollar index is on the strong side. That combination is a liquidity drain for high-beta altcoins. I checked the correlations: the 30-day rolling correlation between meme coins like PENGU and Nasdaq futures has stayed above 0.6 lately. In other words, when US stocks sneeze, this market goes str
PENGU+0.40%
NAS100-0.07%
USIDX+0.00%
MEME-0.94%
BTC-0.67%
  • 2
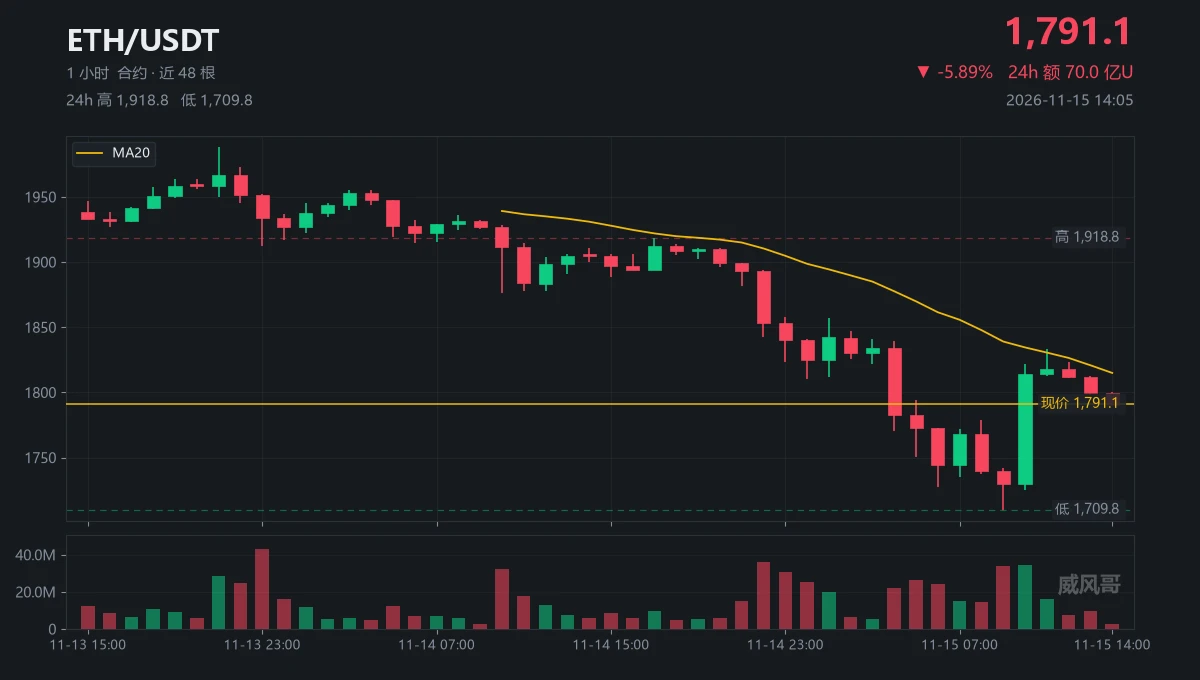
Volume, price, position, time—once I’ve scored all four columns, I’ll shut up.
Volume: the 10:00 candle traded 34.21 million contracts, 1.91 times the average volume. One point.
Structure: after 1833.49, the lows of four consecutive candles kept breaking lower. Zero points.
Position: $ETH 1791, with MA20 at 1814.92 overhead. Zero points.
Time: one candle pushed the price up, while three candles gave it back. Zero points.
One point. Four-point scale; three to pass.
The rebound’s tally: from 1729.74 to 1833.49, a gain of 103.75.
Gave back 44.89, or 43%.
Volume hasn’t contracted; money is changin
post-image
ETH-1.23%
  • 3
  • 3
Why does it feel like my bot is getting slower and less intelligent?😅
post-image
$AKE It's rebounding, it's rebounding
AKE+6.07%
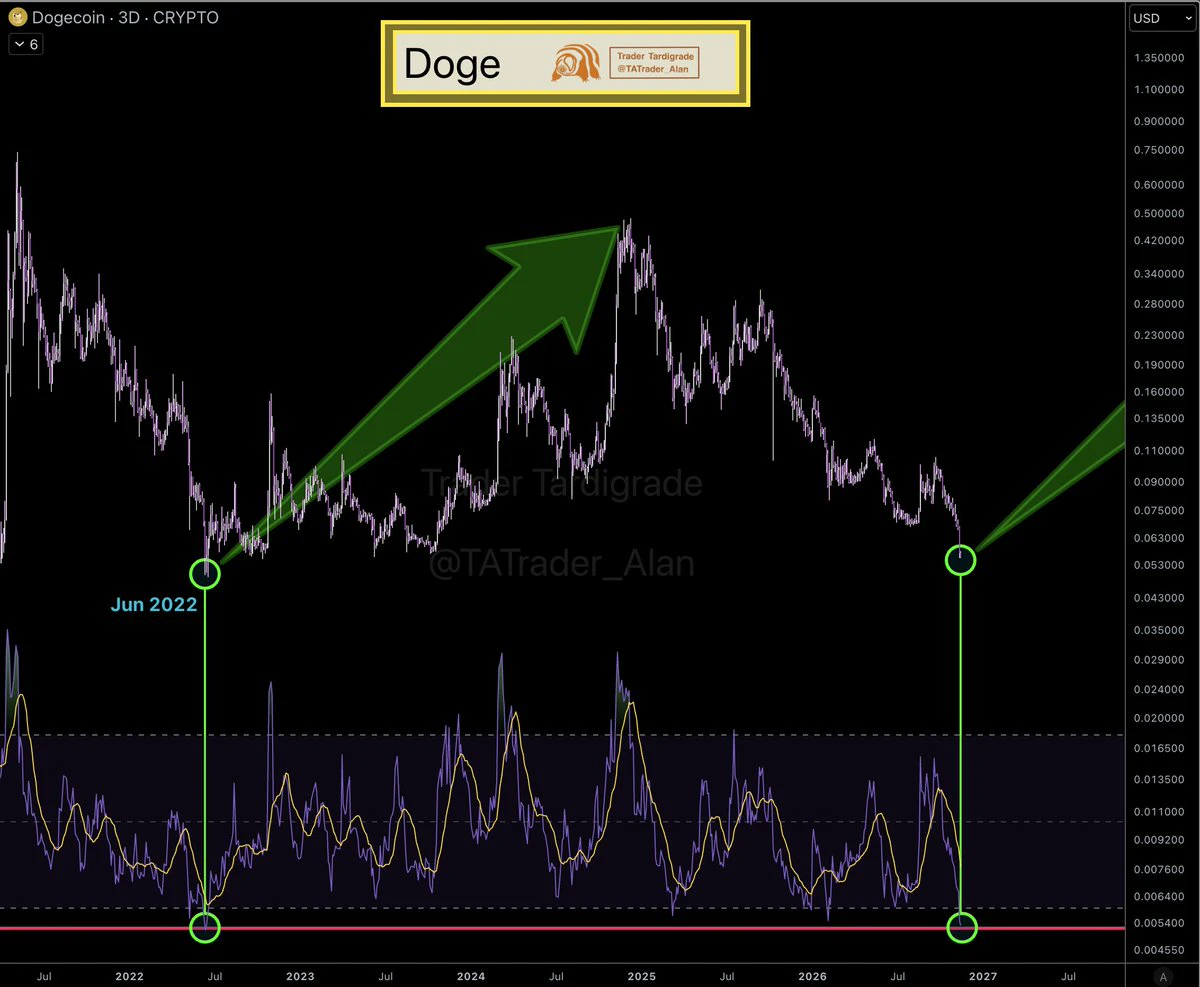
$DOGE /3D
Dogecoin RSI has dropped to the same level as June 2022 ❇️
Back then, price printed the lowest low of that cycle right at this level.
We may be standing at the same spot again. Bottom in? 👀
post-image
DOGE-0.22%
$EVAA Keep shorting! This move has run its course! Short now and take profit! Target 1.43. If you don't have a position, short at market! Welcome to the short side!
post-image
EVAA-0.49%
I'm trading on Gate, a top-tier exchange with a 13-year track record. Come join me and dive into the hottest events right now! https://www.gate.com/campaigns/6482?ref=VLARBF1YAG&ref_type=132
post-image
[ NEW STREAMER ] BTCTALK
live-cover
LIVE1,885
Crypto Market Todays Updates.
live-cover
LIVE2,810
“I don’t understand why everyone is talking about Storage being trapped at Gaixia, as if this ancient stock-market battlefield were destined to bring us more peril than good fortune. Twenty years ago, I set out from spot trading and began my second futures contract; U.S. stocks, commodities, and crypto were thus united. Wherever Storage AI went, the people welcomed it wholeheartedly—truly, it had every advantage of timing. The scene of vigorous life, with all things competing to flourish, is still vivid before my eyes. How could this place have become my burial ground in just one short year?”
post-image
NVDA-0.35%
$645,000,000 worth of crypto longs liquidated in the past 30 minutes.
post-image
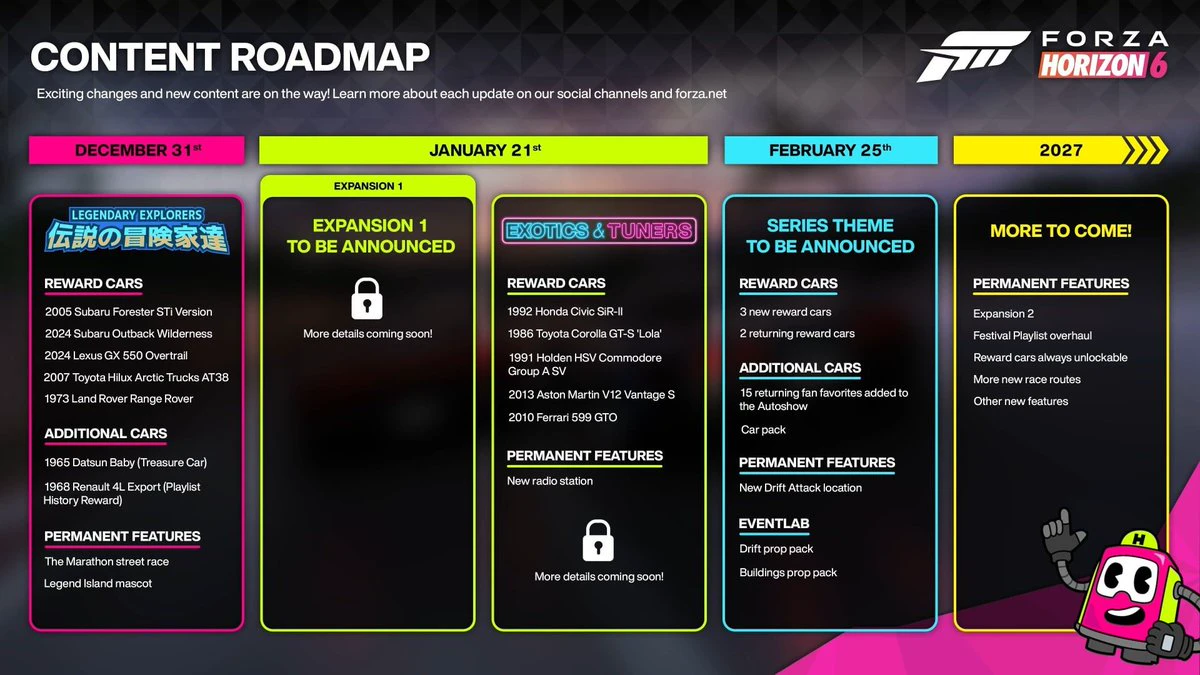
Forza Horizon 6 Update Roadmap Revealed, Highlighting the Price Gap Between Paid DLC and Free Content Updates
Racing games get updates more often than car owners change cars, and players may have to buy DLC just to experience the full game
$BTC
post-image
BTC-0.67%
The HyperHaul waitlist closes tomorrow (Monday, 16 November) at 17:00 UTC, the same time the seas open on Robinhood Chain.
Top 100 on the leaderboard share the $3,000 prize pool.
Top 300 receive a whitelist spot for the 3,333 free-mint Captains NFT.
Everyone who joins receives Founding Captain status (numbered badge, Founder title, and golden wake).
To join the HyperHaul waitlist you only need to:
1: Connect your X account
2: Add the EVM wallet you will play with
Complete the simple tasks (follow, like, repost, reply)
3: Claim your boarding pass
That’s it. Once you’re in, you can invite
HOOD+0.00%
With the same 1000U, some people think $APT can double after this drop, while others get cut in half and exit—the difference comes down to these five matchups today.
First matchup: price vs. sentiment. $APT is currently at 0.4537, down 12.5% over 24 hours, with a high of 0.5196 and a low of 0.4271; trading volume is 64.7M. The drop is brutal, but volume hasn't surged, suggesting this is a hole created by panic selling, not a top where major players are dumping. Bears see a breakdown; I see sentiment hitting rock bottom after a sharp drop on declining volume.
Second matchup: entry point vs. ris
APT-1.51%
Load More

Join 40 M users in our growing community

⚡️ Join 40 M users in the crypto craze discussion

💬 Engage with your favorite top creators

👍 See what interests you

Trending Topics

GateIPOAccessAnthropic

341.9K Views2.7K Discussing

Gate IPO Access Phase 3 features Anthropic (ANT), with USDT subscription interest starting from 100 USDT. Successful allocations will be delivered as real shares to Gate Stock Accounts. Indicative price: $70–$78/share Subscription: Nov 12–17 (UTC+8) Allocation is not guaranteed. Please manage risk accordingly.

Dr.HanOxfordUnionSpeech

150.8K Views510 Discussing

USOctoberPPIBelowExpectations

478K Views1.4K Discussing

View More