Square
Following
Hot
News
Notifications
Profile
Share your thoughts
placeholder
Article
Strategy expanded its Bitcoin treasury and bought back preferred stock following a multi-million-dollar common stock.
• Bitcoin Acquisition: Purchased 1,036 BTC for $81.9 million (at an average price of roughly $79,012 per bitcoin) between November 2 and November 8, 2026. This brings Strategy’s total holdings to 850,364 BTC.
• STRC Buyback: Spent $188.3 million buying back STRC (Variable Rate Perpetual Stretch Preferred Shares Series A).
• Source of Funds: Financed the transactions primarily by selling 2.05 million MSTR shares for $283.8 million, with $13.6 million allocated to cash.
‍#Shar
post-image
BTC-0.67%
STRC+0.18%
MSTR-2.54%
Trenches
牛逼
牛
bade
b
牛逼
0x96...7777
Market Cap
$.
Change
.
24h Vol
$.
Holders
.
PIEVERSE
P
bade
b
PIEVERSE
0x0e...25a9
Market Cap
$.
Change
.
24h Vol
$.
Holders
.
BTC
B
bade
b
BTC
C5xp...pump
Market Cap
$.
Change
.
24h Vol
$.
Holders
.
STONK
S
bade
b
STONK
6GmA...UNgx
Market Cap
$.
Change
.
24h Vol
$.
Holders
.
ON
O
bade
b
ON
0x0e...1d48
Market Cap
$.
Change
.
24h Vol
$.
Holders
.
Anthropic released Fable 5.2 ahead of its IPO and also gave away two remastered 😂
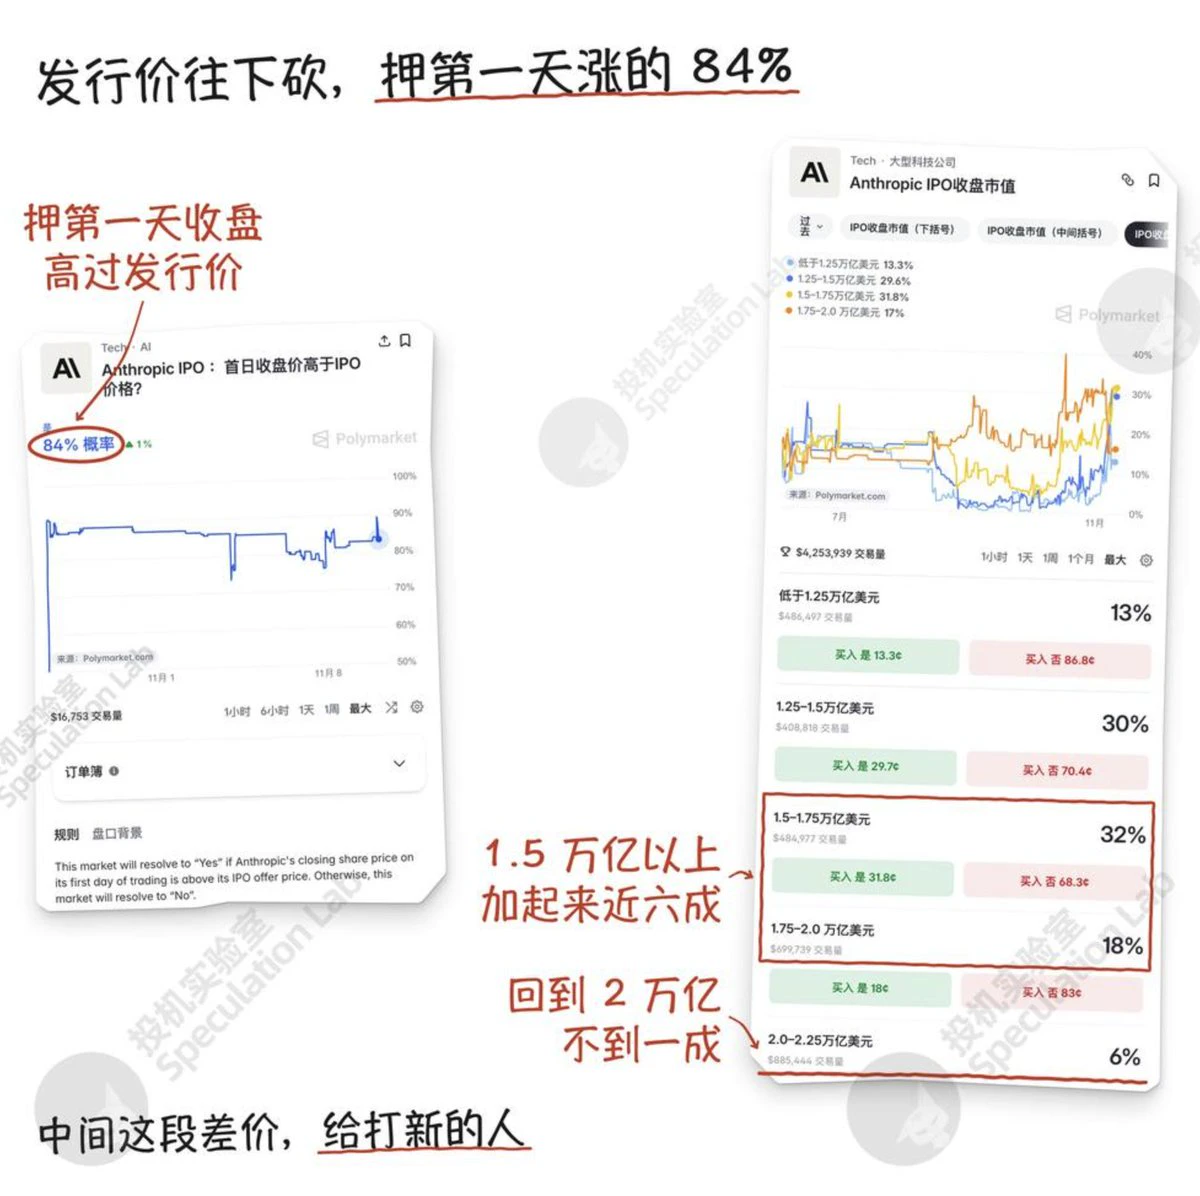
Buyers have sharply marked down Anthropic's offering price. Polymarket gives an 84% chance that it will close above its offering price on its first day of trading🤑
Buyers have valued it at $1.2 trillion to $1.3 trillion in recent days, down from the $2 trillion figure floated in early October.
I went through more than a dozen Anthropic markets on Polymarket.
In the market on its IPO valuation, the most popular range is $1.25 trillion to $1.5 trillion, at 49%.
The market on its market cap at the end of its first
post-image
Anthropic released Claude Fable 5.2 and Claude Mythos 5.2, built on the same underlying model: Fable is for general users and includes safeguards for cybersecurity and biosafety, while Mythos is for vetted cybersecurity and life sciences organizations; Fable 5.2 API pricing is 20% lower than 5.1, with generation speeds up to 30% faster.
Splitting the same model into a public version and a professional version both lowers usage costs and restricts access to high-risk capabilities, showing that providers are beginning to treat capability deployment and safety boundaries as a single product chall
BTC-0.67%
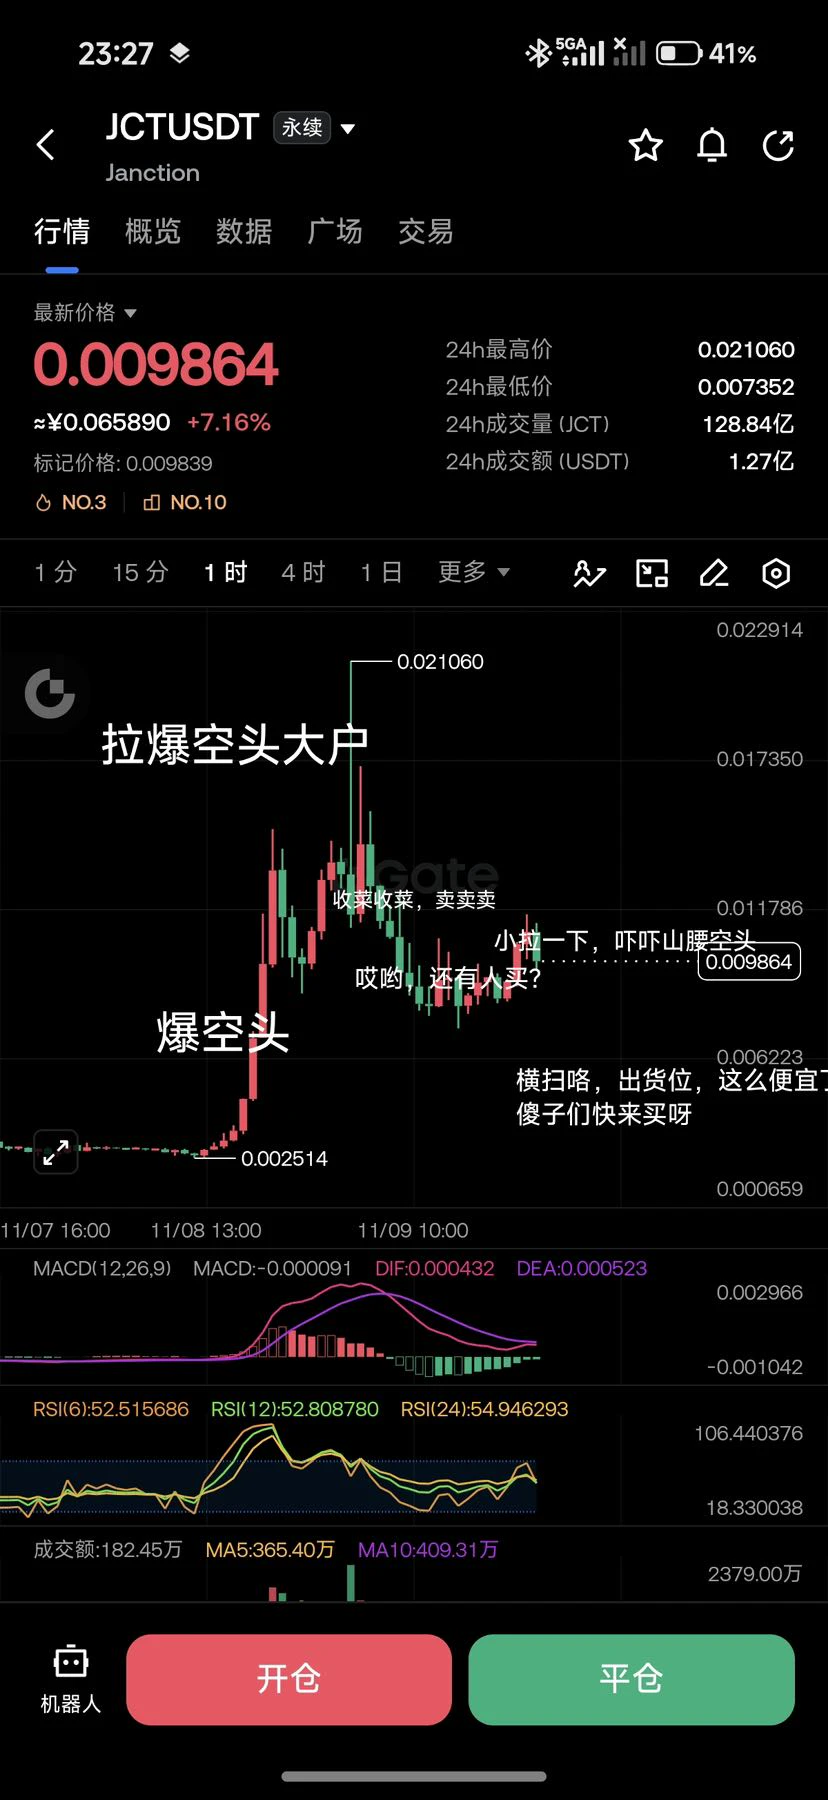
$JCT Just saw this. So funny
post-image
JCT-3.26%
Headwinds mount: The Jensen Huang incident continues to escalate, with the board launching an independent review by external counsel. Huang will brief Congress behind closed doors on November 18 about the handling of sensitive information.
U.S.-listed NVDA plunged 4.27% on Monday, closing at $178.67. Its market cap shrank by more than $190 billion in a single day, making it almost the only constituent of the Philadelphia Semiconductor Index to weaken sharply.
Tokenized XNVDA is now trading at $180.14, down about 1.0% over 24 hours, with a trading volume of approximately 16.85 million USDT. It
post-image
XNVDA
XNVDASPACEXNVDA
Pump.Fun
MC:$2.79KHolders:1
0%
NVDA-4.34%
NAS100-0.07%
AMD+13.35%
$BTC - Update‼️The bounce from the 1D support zone looks quite strong, and buyers have begun to regain control. If buyers maintain their momentum, we can expect a wave of relief buying to push the price toward $81,500.
post-image
BTC-0.67%
Layout: Bitcoin, Ethereum, Dogecoin
live-cover
LIVE910
  • 1
$KORU B I got in at the lowest price, didn’t I, you little Korean? 😏 I’ve posted about Koru and helped everyone get positioned—we’re already on a six-win streak
post-image
KORUB
KORUBSouth Korea Bull
Four.meme
MC:$3.67KHolders:1
0%
KORU+10.82%
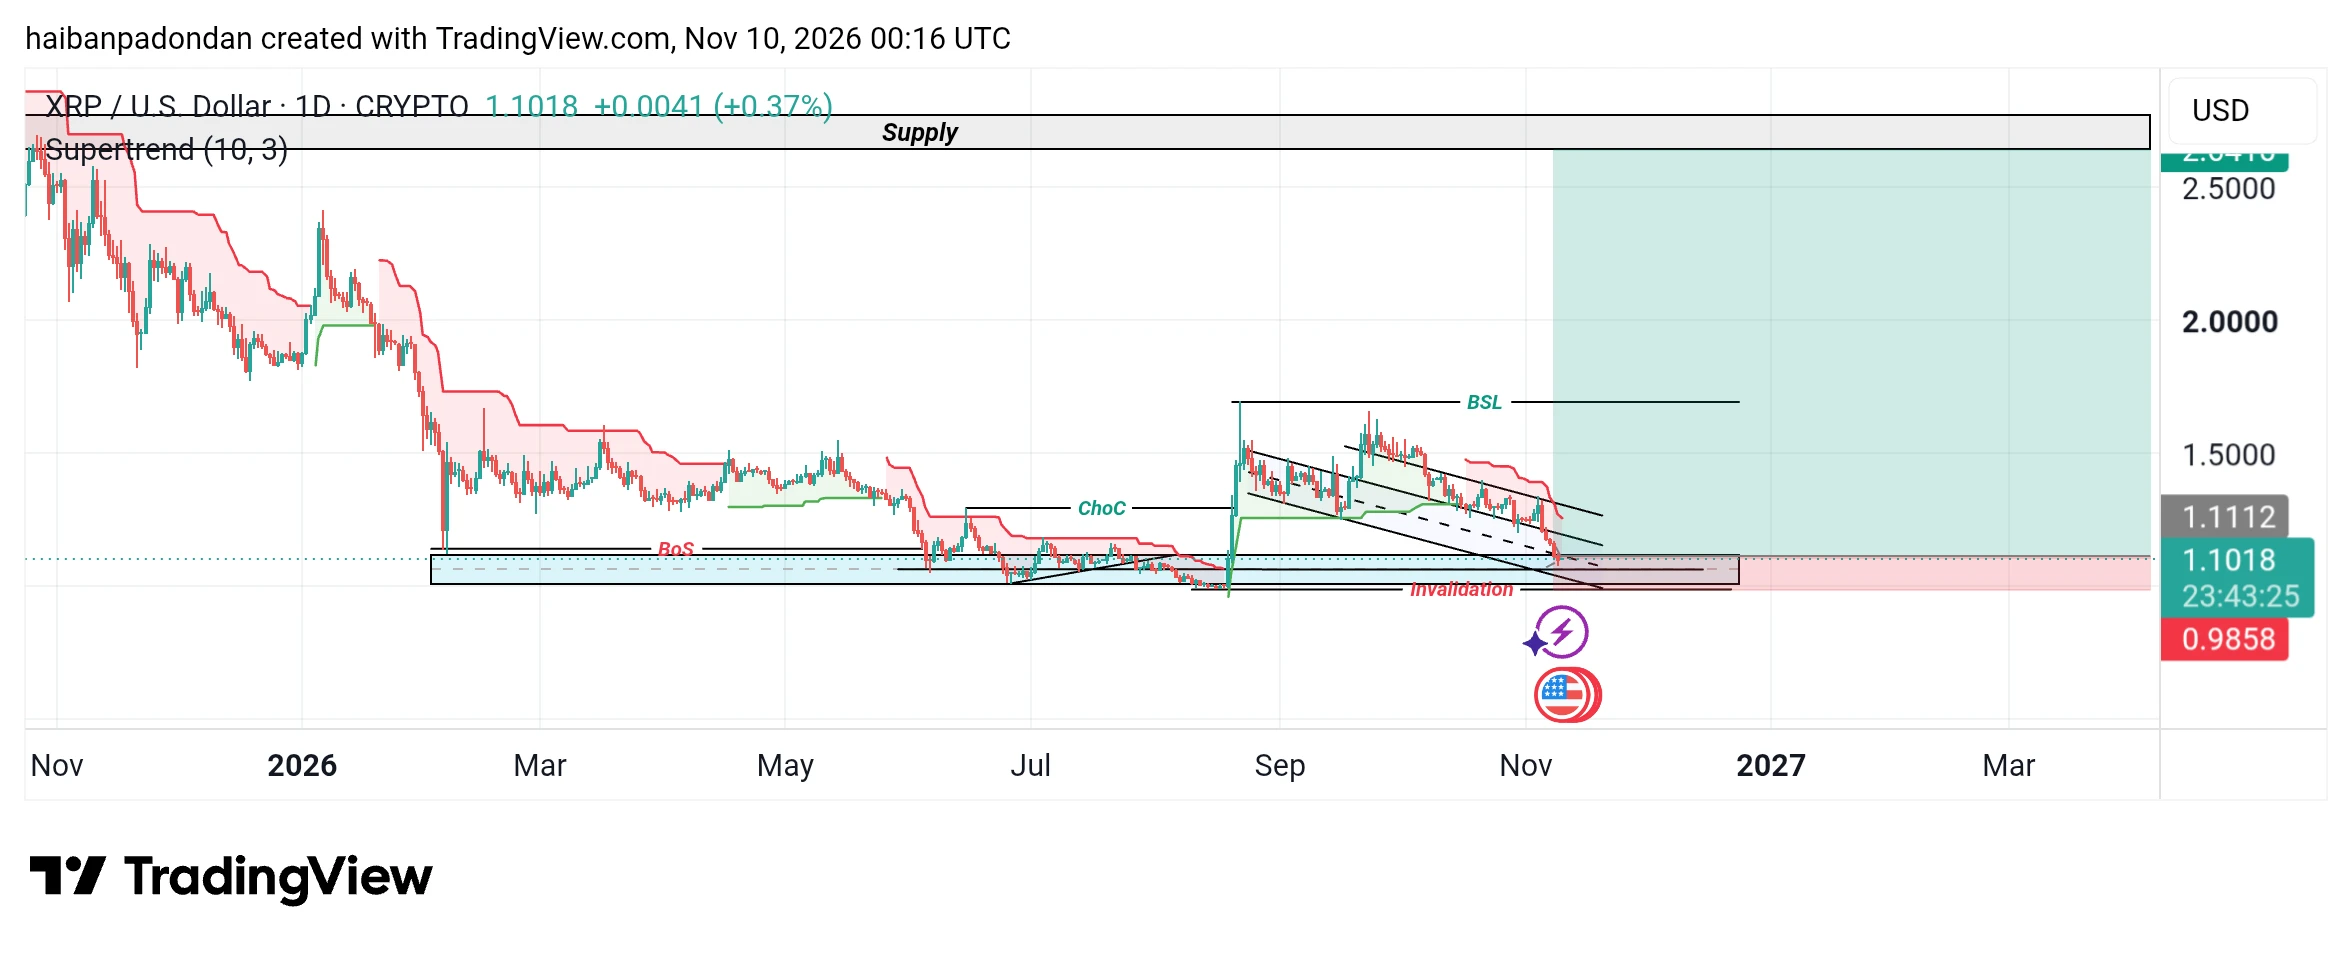
$XRP ‌Reason for entry: The price has returned to a demand area that was swept prior to the previous price surge. As long as the invalidation level remains untouched, the bullish scenario from the prior price surge stays valid.
post-image
XRP-1.15%
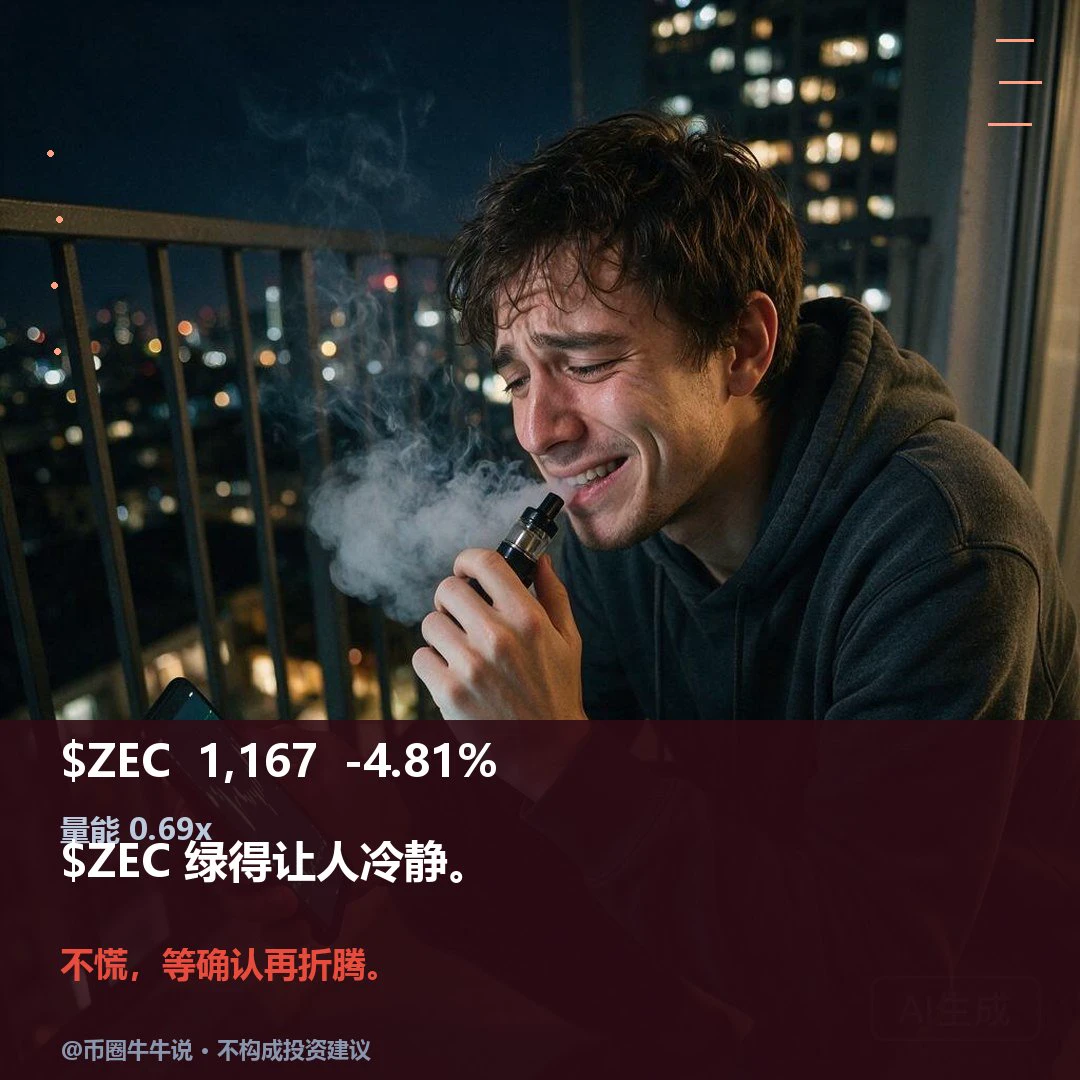
$ZEC Currently trading at 1166.68, down 4.81% over 24H. Both the 1H and 4H charts are weak, with price below the EMA20 and RSI around 30 on both timeframes. Resistance is at 1249.69, and support is at 1153.5. If price holds above 1249.69, watch for a rebound; a break below 1153.5 would signal further short-term weakness. 1H volume is only 0.69x the average, indicating low participation. The 4H structure is also weakening, with the EMA20 above price at 1238. Review whether price can hold above 1249.69. The setup is invalidated if price breaks below 1153.5 and fails to recover. Market volatility
post-image
ZEC+1.16%
  • 1
$PI You're investing in the future; add another 20,000
post-image
PI-0.60%
  • 9
Crypto Market update
live-cover
LIVE1,991
$STAMP Why did auto-deleveraging happen? I set the auto take-profit at 0.004, but it was $2,000 short
STAMP+52.30%
  • 15
Are chips a bubble? Yesterday at Stanford, after hearing SiddharthMehta (formerly of Anthropic) speak about AI Infra Economics, the takeaway was:
Chips aren’t a bubble; inefficiency is. In the agent era, what’s scarce isn’t models, but an OS that brings power, chips, utilization, contracts, and tokens together and charges based on outcomes. Enterprise GPUs average just 5% utilization—a $3 GPU-hour actually costs $60 to deliver one hour of useful compute. By 2030, inference demand will reach 93GW, exceeding training’s 62GW, while grid connections take 5 years. What will really get squeezed out
📊 Macro Financial Calendar | 11.10 (Beijing Time)

2026.11.10
⭐⭐⭐ Extremely high impact
✅ 21:30 U.S. October CPI and Core CPI [Today's top-tier data]

Directly affects future Fed rate expectations. Market volatility can spike sharply at release, with sudden wicks. Be sure to strictly manage position sizes and use stop-losses.

⭐⭐ Medium impact
✅ 17:00 Fed Governor Waller speaks publicly
✅ 22:35 Dallas Fed President Logan (FOMC voting member) speaks
✅ From 13:01: Continue suspending additional tariffs on some U.S. goods, retaining a 10% tariff rate for 2 months

⭐ Regular watch
✅ 07:50 Summar
What Is Expected Shortfall (ES)? Why Can It Complement VaR by Revealing Tail Risks That VaR Misses?

In crypto markets, risk is not only about how much an account might lose, but also how large losses could become during extreme market conditions. Value at Risk (VaR) can estimate a loss threshold, but it cannot directly show the average loss beyond that threshold. This is where Expected Shortfall (ES) is valuable.

First, what is ES?

ES measures the average level of tail losses when losses exceed a specified VaR threshold. For example, at the same time horizon and 95% confidence level, ES foc
post-image
【ETH | Short-Term Strategy】
Current price: 2125.41
Timeframes: 1-hour chart for direction | 15-minute chart for candlesticks | 1-minute chart for entry
Pivotal level: 2150
✅Long: Go long if price holds near 2081 on a pullback, target 2135-2150, stop-loss below 2076
❌Short: Go short if price faces resistance at 2150 on a rebound, target 2100-2082, stop-loss above 2156
Profit/loss target: $15–20
Note: The market is range-bound at low levels, with longs and shorts alternating. Focus on waiting for tonight's CPI data release; volatility will increase after the data comes out. Always use a stop-los
ETH-1.26%
Load More

Join 40 M users in our growing community

⚡️ Join 40 M users in the crypto craze discussion

💬 Engage with your favorite top creators

👍 See what interests you

Trending Topics

USCPIDataIncoming

46.12k Views2.08k Discussing

The U.S. October CPI report will be released on November 10 at 8:30 a.m. ET. September CPI came in at 3.7% year over year, and markets will be watching closely for signs that inflation is cooling, especially in core CPI. A softer-than-expected reading could strengthen rate-cut expectations, while hotter inflation may pressure risk assets through higher Treasury yields and a stronger dollar. How do you think this CPI print will move $BTC, U.S. stocks and gold?

RedBullDoublePodiumInBrazil

11.5k Views30.6k Discussing

BTCFlashCrash

247.71k Views66.63k Discussing

View More