
Share your thoughts
placeholder
Article
For a market on whether the Strait of Hormuz will remain open to normal shipping during a specified period, the contract rules could be set as follows: if the event occurs, each contract pays out $1. As users continue buying and selling, the market price becomes a probability indicator, reflecting the collective assessment of all traders regarding the likelihood of the event occurring.
post-image
This return has me feeling nervous, afraid the market will come to its senses tomorrow and blacklist me. 😅

Before bed, $BTC was still pretending to be strong at a high level, with relatively low trading volume as sell orders quietly piled up. I saw 77967.7 struggling to break higher and judged that there would be no buyers on the way up, so I directly suggested a short-selling strategy: Don’t chase it; wait for it to weaken. Bullish

While everyone was still waiting on the sidelines, the price had already fallen from 77967.7 to 77252.1, with floating profit at +159.51%. This was purely th
post-image
BTC-1.14%
SNDK-3.46%
BNB-0.81%
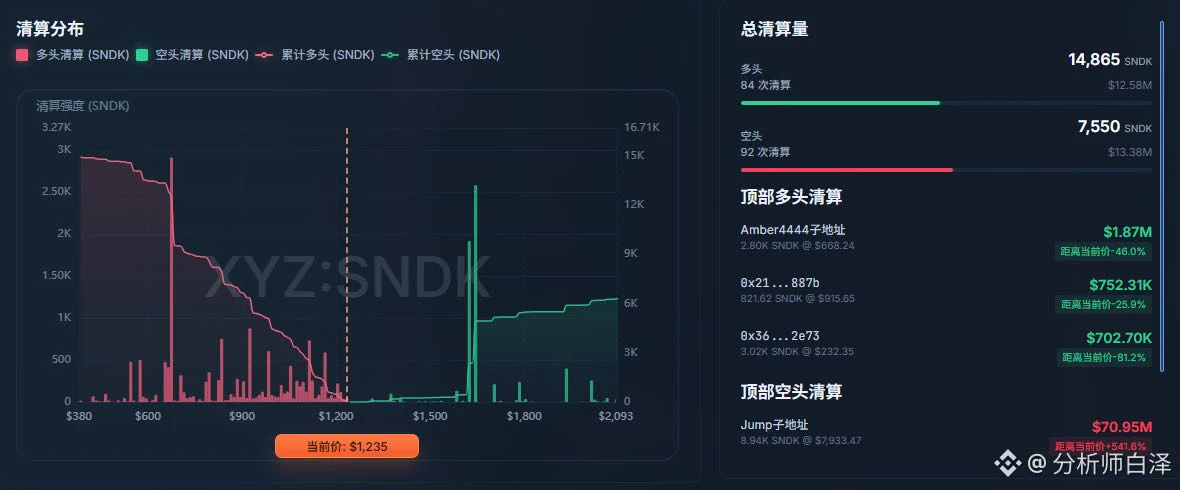
The three storage giants are pulling back from their highs—is it time for US stocks to correct too?
Today's short-term first-trade profit is secured
Following the morning strategy, we went long. The zec trend is relatively clear, so we tried going long. zec itself is correlated with BTC, and its price movement is similar to ETH, but perhaps because it is an altcoin, its wicks are not as severe as ETH's. Relatively speaking, it is more stable and easier to trade.
$ZEC Entered at 1059 and took profit at 1090
Captured 31 points, banking $577
BTC's market is currently holding at 774, while ETH is at 2470. For zec, it seems resistance remains above 1110. We will see whether
post-image
ZEC-8.70%
Bitcoin’s buy-the-dip long strategy played out perfectly. I emphasized last night that I personally still leaned bullish. It dipped to support around 76,400 in the early session, stabilized, and rebounded; it has now reached a high of 77,400, delivering exactly 1,000 points of upside. Stay flexible and keep the rhythm going, folks. $BTC
BTC-1.14%
9.11 Gold Afternoon Outlook: Gold bottomed and rebounded, surging nearly $60! An oversold rebound is underway, with 4360 as the bull-bear dividing line

Spot gold formed a bottoming-and-rebound pattern on the 10-minute chart during the day. After falling to the early-session low of 4300, the price stabilized, then concentrated buying pushed it higher amid fluctuations, successively breaking through several key resistance levels at 4314 and 4337, and reaching around 4360 at its highest. It is currently trading near 4352, with strong short-term bullish rebound momentum as market sentiment gradu
post-image
XAUT-1.54%
Nobody is talking about the SYMO entry that just armed itself.

$TAO /USDT - LONG

Trade Plan:
Entry: 235.3 – 236.9
SL: 225.8
TP1: 243.8
TP2: 249.0
TP3: 256.7

Why this setup?
Why now? The 1h price sits at 236.1, perfectly inside the entry zone of 235.3 to 236.9, giving us a precise risk-defined long. The 15m RSI at 50.78 shows the market is neither overbought nor oversold, leaving room to run before exhaustion. The 1h ATR of 3.306447 tells us that a 3.30 move is routine, so the 7.7-point distance to TP1 at 243.8 is a realistic first target. The daily trend is range, which often produces sh
TAO-6.59%
#Web3安全指南 #辣妹儿李嘉欣
Who can't draw this fucking thing?
The streamer can draw it, I can draw it, and you can actually draw it yourself too.
Once the streamer has drawn it, they don't know whether it can be reached, nor whether it can break out once reached—they simply know how to draw it.
Once I've drawn it, I won't tell you whether I know if it can be reached, nor will I tell you whether it can break out once reached. I'm not just drawing it—I don't take action after drawing it, and I don't analyze specifically whether it can break out.
You drew it and, just like the streamer, don't know whethe
post-image
Market trends are never fixed: cut losses promptly when wrong, hold on when right and follow the trend, and respond flexibly to seize opportunities amid volatility. #8月CPI今晚公布 #黄金
post-image
GLDX-1.39%
PAXG-1.54%
XAU-1.56%
#LAPTOPDown99%tFromPeak
LAPTOP Down 99% From Peak — What Really Happened?
LAPTOP has experienced one of the most extreme launch-to-crash moves in recent memecoin markets.
From the highest Gate print of $LAPTOPto around $0.853,LAPTOP has lost approximately 99.75% of its peak value. Other market trackers show different highs — around $316.75on DexScreener and $199.51on CoinGecko — but the bigger conclusion remains the same: almost the entire launch premium has disappeared.
The interesting part is not simply how far the price fell.
It is how the market reached
From $0.05to $344.77
Trading began
  • 1
This $ZEC sell-off can be summed up in one word—brutal.
It surged from around 1000 to 1299, rising too fast and completely igniting market sentiment. But after reaching the highs, it couldn't hold on. As more people started selling, the longs below began hitting stop-losses and getting liquidated, creating a stampede-like cascade lower.
Look at it now: from 1299 all the way down to around 1080. This is no longer a normal pullback—it is clearly a sign that high-level holders are starting to unload.
But I don't think we should call $ZEC dead just because of a sharp drop. After such a powerful ra
ZEC-8.70%
Most traders are about to miss a quiet breakout in $ZEC /USDT that is already printing higher highs.

$ZEC /USDT - LONG

Trade Plan:
Entry: 1098.88 – 1112.58
SL: 1039.94
TP1: 1155.07
TP2: 1187.96
TP3: 1237.30

Why this setup?
Why now? The 1d trend is bullish, the 1h price is sitting at 1105.73, and the 15m RSI at 49.38 shows room to run before overbought. The 1h ATR of 27.411048 confirms the move has real momentum behind it, while the entry zone between 1098.88 and 1112.58 is already being respected. Targets sit at TP1 1155.07 and TP2 1187.96, with the invalidation level at 1072.03 acting a
ZEC-8.70%
September 11 Jinman Gold Midday Review:
Spot gold bottomed out and rebounded in the afternoon, staging a corrective recovery. The latest quote is 4352.50, up 36.02 points on the day, or 0.83%. Prices opened lower and moved higher intraday, with an opening price of 4316.31 and an intraday low of 4300.89. Buying at lower levels then drove prices higher, with the high reaching 4360.96. Overall, the market showed an oversold rebound.
On the hourly chart, after the previous consecutive declines, bearish momentum has weakened somewhat. Prices have gradually rebounded and moved higher from low levels
post-image
BTC-1.16%
ETH-0.26%
Fourth intraday account-flipping update: So far, $1,439 secured!
#黄金 #BTC跌破77000美元 $BTC $ETH
post-image
BTC-1.16%
ETH-0.26%
Yesterday, jobless claims came in at 206,000, steady as a rock;
PPI rose 5.4% year over year, crushing expectations.
Once those two data points came out last night, BTC immediately plunged.
Tonight at 20:30, CPI will be released.
The market expects 3.4% year over year, with core CPI at 2.4%.
But the real killer isn’t the numbers themselves—it’s the rate-hike probability. CME data has already surged to 72.4%, up from just 49% a week ago.
In other words, the market has already priced in that “this time, they might really make a move.”
Why does PPI matter? Because prices at the production end eve
post-image
BZ+3.38%
BTC-1.14%
ETH-0.26%
$ETH Shocking reversal! Is the massive sell-off at 2400 actually a golden opportunity? Retail investors, don’t get shaken out!
The market always erupts in despair, and bloodied chips are the most tempting!
Nearly 300 million in ETF outflows sparked panic? Don’t be fooled by appearances! Look at the fund flows in Chart 3: 76.66 million swept in within 1 hour, surging to 242 million within 4 hours. The FLOW SCORE reached as high as +72, showing that major players are secretly accumulating aggressively. In Chart 2, the 1-hour chart dipped to 2403 and left a long lower wick, indicating extremely s
ETH-0.24%
Layout for Bitcoin, Ethereum, and Dogecoin
live-cover
LIVE1,582
I was just about to go to the forum and rant, but then I looked at my account and thought, forget it—the market is always right. During the intraday bottoming grind, I almost thought this trade would drag on until next quarter.

The logic wasn't complicated: buying pressure was strengthening, and someone was catching the sell-offs—it was just moving slowly. I went long around 453.65, and I said at the time, the longer it grinds, the more explosive the move.

Sure enough, $DELL is now at 513.63, with +637.18% in hand. It was truly sluggish at first, but the payoff feels great.

I'd rather mi
post-image
DELL-4.18%
ZEC-8.70%
LAB-0.91%
Load More

Join 40 M users in our growing community

⚡️ Join 40 M users in the crypto craze discussion

💬 Engage with your favorite top creators

👍 See what interests you

View More