




















#BTC跌4% #Gate直通IPO第三期Anthropic Bitcoin Breaks Below $70K: BTC at $68,663, the $67K Support Test and the Search for a Real Bottom
Bitcoin's correction has entered a more important technical phase. The $70,000 psychological level has given way, and the latest price reference of $68,663 puts BTC close to a major weekly support zone. This is no longer simply a question of whether buyers can defend a round number. The market needs to prove that demand is strong enough to absorb selling, ETF withdrawals and forced derivatives liquidations.
From the $80,000 area mentioned in the earlier market update to $68,663, Bitcoin has declined approximately 14.17%. Compared with the previous quoted reference of $73,662, it is lower by approximately 6.79%. The exact 24-hour percentage changes with the exchange and timestamp, but the broader move confirms that selling pressure has accelerated.
The chart has shifted from correction to a bearish structure
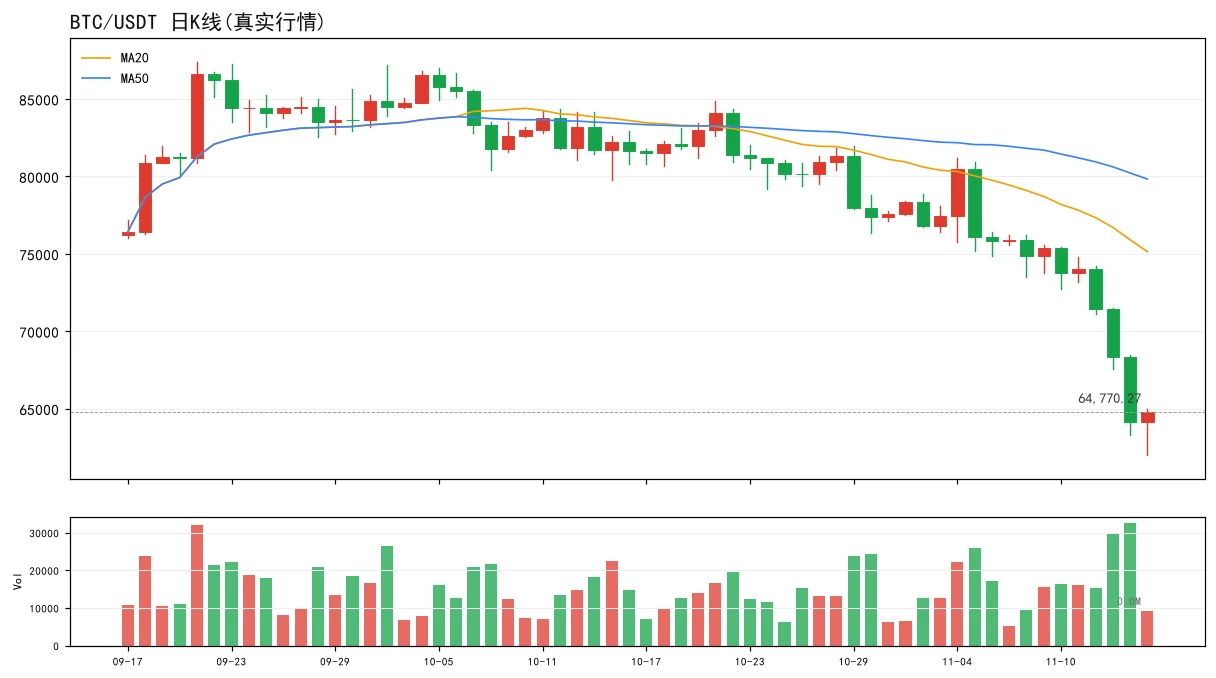
The most important technical development was the loss of the daily 200-day simple moving average, previously around $73,150. That level had acted as an important support area from mid-August into early November. Once price moved below it, the former support became a potential resistance zone.
The November 12 daily technical snapshot showed:
- RSI (14): 29.3, in oversold territory.
- MACD: -2,125.81, below its signal line at -1,631.56.
- MACD histogram: -494.25, confirming negative momentum.
- Stochastic: 1.9 / 9.1, deeply oversold.
- Daily 20-day SMA: approximately $77,333.
- Daily 50-day SMA: approximately $80,943.
- Daily 200-day SMA: approximately $73,136.
BTC was trading below all eight tracked 20-, 50-, 100- and 200-day SMA/EMA readings in that snapshot. This is a broad bearish alignment, not merely a short-term pullback.
The RSI reading below 30 indicates that selling has become stretched. But oversold does not automatically mean undervalued or ready to reverse. A strong downtrend can remain oversold while price continues falling. The MACD remaining below its signal line means a confirmed momentum reversal had not yet appeared in that dated reading.
Where is Bitcoin finding support now?
With BTC around $68,663, the following price zones deserve attention:
- $67,300–$68,000: The immediate major support area, combining the reported weekly S3 pivot near $67,333 and weekly 200-day moving average near $67,937.
- $66,000–$67,000: A deeper historical breakdown zone if the weekly support area fails.
- $63,000–$65,000: A broader previous summer consolidation region.
- $57,877: The reported July 1 cycle low and a deeper historical reference, not an immediate price target.
The first resistance is now the reclaimed $70,000 area. Above it, traders need to watch $71,150–$71,300, followed by the former daily 200-day average near $73,150.
A recovery above $70,000 alone would not establish a bullish reversal. A stronger signal would require BTC to regain $71,300 and then close convincingly above $73,150, ideally with improving volume and momentum.
Derivatives reveal how much leverage is being removed
The sell-off has also affected futures positioning. CoinGlass data around November 13 showed:
- BTC futures open interest: approximately $49.42 billion.
- 24-hour open-interest change: -3.13%.
- 24-hour futures volume: approximately $71.56 billion.
- 24-hour liquidations: approximately $478.84 million.
- Long liquidations represented approximately 96% of the reported total.
- Weighted funding rate: approximately +0.0077% per eight hours.
The combination of falling price, declining open interest and heavy long liquidations indicates that leveraged positions were being closed or forced out. This can intensify a decline as liquidation orders add to market selling.
Funding remained slightly positive in that snapshot, meaning longs were still paying shorts on average. That suggests positioning had not necessarily become uniformly bearish or completely reset. It is also a reminder that a positive funding rate during a falling market can leave leveraged long positions vulnerable.
ETF demand is another important weakness
Institutional demand has not yet provided a convincing counterweight to the selling.
U.S. spot Bitcoin ETFs recorded approximately $1.44 billion in cumulative net outflows across five consecutive sessions through November 11, according to CoinDesk's November 12 market report. The November 11 session alone saw approximately $299.9 million leave the funds, with BlackRock's IBIT accounting for around $269.7 million of that outflow.
The November tracker also showed approximately $1.9 billion in net outflows for the month through its November 11 update.
ETF redemptions do not mean every institutional investor has abandoned Bitcoin, but persistent withdrawals weaken an important source of spot-market demand. A meaningful improvement would involve several sessions of reduced outflows or renewed net inflows, rather than relying on one positive day.
Why the pressure is spreading across markets
The October U.S. CPI report added another macroeconomic headwind. Headline inflation rose 0.4% month over month against expectations of 0.3%, while core CPI increased 0.3% against the 0.2% forecast.
Treasury yields jumped after the release, and market expectations shifted toward a potentially more restrictive Federal Reserve. Higher yields and a stronger dollar can reduce appetite for risk-sensitive assets, including cryptocurrencies.
The December 8–9 FOMC meeting is therefore a key event to monitor. Market-implied rate expectations are not a confirmed Fed decision, and future inflation and employment releases could change the outlook.
Bitcoin has also been trading in a cautious broader technology-market environment. Weak ETF demand, leveraged positioning and macroeconomic uncertainty have combined rather than operating as separate isolated events.
Three scenarios for the next move
**Bullish recovery:** BTC holds the $67,300–$68,000 region, recovers $70,000, and then reclaims $71,300–$73,150 with stronger spot demand. A daily RSI recovery above 30–35 and a narrowing negative MACD histogram would add confirmation.
**Bearish continuation:** A decisive daily close below $67,300, followed by a failed recovery, would weaken the weekly support structure. The $66,000–$67,000 area would become the next important zone, with $63,000–$65,000 as a deeper historical reference.
**Sideways stabilisation:** BTC may trade between approximately $67,300 and $71,300 while leverage cools and ETF flows improve. This would be a consolidation phase, not proof that the market has already formed a bottom.
The real test: price recovery must be supported by demand
At $68,663, Bitcoin is approximately 14.17% below the $80,000 reference, and the $70,000 breakdown has made the weekly support zone more important. RSI is oversold, MACD remains bearish, moving averages show a negative trend, ETF flows have been weak and derivatives liquidations have been dominated by longs.
That combination explains why a quick rebound is possible but not yet confirmed.
The strongest evidence of a durable recovery would be a defence of $67,300–$68,000, a reclaim of $70,000 and $73,150, improving spot volume, reduced ETF withdrawals and a healthier derivatives position.
For now, the market is testing whether long-term buyers are willing to step in after the leverage-driven selling. **The bottom is not confirmed by an oversold RSI or a round-number price; it is confirmed when selling loses control and buyers demonstrate sustained demand.**
Technical note: $68,663 is the price you supplied. RSI, MACD, moving averages and derivatives figures are dated market snapshots from November 12–13, not calculations made at that exact price. Levels are reference zones, not guaranteed support or price targets.
Bitcoin's correction has entered a more important technical phase. The $70,000 psychological level has given way, and the latest price reference of $68,663 puts BTC close to a major weekly support zone. This is no longer simply a question of whether buyers can defend a round number. The market needs to prove that demand is strong enough to absorb selling, ETF withdrawals and forced derivatives liquidations.
From the $80,000 area mentioned in the earlier market update to $68,663, Bitcoin has declined approximately 14.17%. Compared with the previous quoted reference of $73,662, it is lower by approximately 6.79%. The exact 24-hour percentage changes with the exchange and timestamp, but the broader move confirms that selling pressure has accelerated.
The chart has shifted from correction to a bearish structure
The most important technical development was the loss of the daily 200-day simple moving average, previously around $73,150. That level had acted as an important support area from mid-August into early November. Once price moved below it, the former support became a potential resistance zone.
The November 12 daily technical snapshot showed:
- RSI (14): 29.3, in oversold territory.
- MACD: -2,125.81, below its signal line at -1,631.56.
- MACD histogram: -494.25, confirming negative momentum.
- Stochastic: 1.9 / 9.1, deeply oversold.
- Daily 20-day SMA: approximately $77,333.
- Daily 50-day SMA: approximately $80,943.
- Daily 200-day SMA: approximately $73,136.
BTC was trading below all eight tracked 20-, 50-, 100- and 200-day SMA/EMA readings in that snapshot. This is a broad bearish alignment, not merely a short-term pullback.
The RSI reading below 30 indicates that selling has become stretched. But oversold does not automatically mean undervalued or ready to reverse. A strong downtrend can remain oversold while price continues falling. The MACD remaining below its signal line means a confirmed momentum reversal had not yet appeared in that dated reading.
Where is Bitcoin finding support now?
With BTC around $68,663, the following price zones deserve attention:
- $67,300–$68,000: The immediate major support area, combining the reported weekly S3 pivot near $67,333 and weekly 200-day moving average near $67,937.
- $66,000–$67,000: A deeper historical breakdown zone if the weekly support area fails.
- $63,000–$65,000: A broader previous summer consolidation region.
- $57,877: The reported July 1 cycle low and a deeper historical reference, not an immediate price target.
The first resistance is now the reclaimed $70,000 area. Above it, traders need to watch $71,150–$71,300, followed by the former daily 200-day average near $73,150.
A recovery above $70,000 alone would not establish a bullish reversal. A stronger signal would require BTC to regain $71,300 and then close convincingly above $73,150, ideally with improving volume and momentum.
Derivatives reveal how much leverage is being removed
The sell-off has also affected futures positioning. CoinGlass data around November 13 showed:
- BTC futures open interest: approximately $49.42 billion.
- 24-hour open-interest change: -3.13%.
- 24-hour futures volume: approximately $71.56 billion.
- 24-hour liquidations: approximately $478.84 million.
- Long liquidations represented approximately 96% of the reported total.
- Weighted funding rate: approximately +0.0077% per eight hours.
The combination of falling price, declining open interest and heavy long liquidations indicates that leveraged positions were being closed or forced out. This can intensify a decline as liquidation orders add to market selling.
Funding remained slightly positive in that snapshot, meaning longs were still paying shorts on average. That suggests positioning had not necessarily become uniformly bearish or completely reset. It is also a reminder that a positive funding rate during a falling market can leave leveraged long positions vulnerable.
ETF demand is another important weakness
Institutional demand has not yet provided a convincing counterweight to the selling.
U.S. spot Bitcoin ETFs recorded approximately $1.44 billion in cumulative net outflows across five consecutive sessions through November 11, according to CoinDesk's November 12 market report. The November 11 session alone saw approximately $299.9 million leave the funds, with BlackRock's IBIT accounting for around $269.7 million of that outflow.
The November tracker also showed approximately $1.9 billion in net outflows for the month through its November 11 update.
ETF redemptions do not mean every institutional investor has abandoned Bitcoin, but persistent withdrawals weaken an important source of spot-market demand. A meaningful improvement would involve several sessions of reduced outflows or renewed net inflows, rather than relying on one positive day.
Why the pressure is spreading across markets
The October U.S. CPI report added another macroeconomic headwind. Headline inflation rose 0.4% month over month against expectations of 0.3%, while core CPI increased 0.3% against the 0.2% forecast.
Treasury yields jumped after the release, and market expectations shifted toward a potentially more restrictive Federal Reserve. Higher yields and a stronger dollar can reduce appetite for risk-sensitive assets, including cryptocurrencies.
The December 8–9 FOMC meeting is therefore a key event to monitor. Market-implied rate expectations are not a confirmed Fed decision, and future inflation and employment releases could change the outlook.
Bitcoin has also been trading in a cautious broader technology-market environment. Weak ETF demand, leveraged positioning and macroeconomic uncertainty have combined rather than operating as separate isolated events.
Three scenarios for the next move
**Bullish recovery:** BTC holds the $67,300–$68,000 region, recovers $70,000, and then reclaims $71,300–$73,150 with stronger spot demand. A daily RSI recovery above 30–35 and a narrowing negative MACD histogram would add confirmation.
**Bearish continuation:** A decisive daily close below $67,300, followed by a failed recovery, would weaken the weekly support structure. The $66,000–$67,000 area would become the next important zone, with $63,000–$65,000 as a deeper historical reference.
**Sideways stabilisation:** BTC may trade between approximately $67,300 and $71,300 while leverage cools and ETF flows improve. This would be a consolidation phase, not proof that the market has already formed a bottom.
The real test: price recovery must be supported by demand
At $68,663, Bitcoin is approximately 14.17% below the $80,000 reference, and the $70,000 breakdown has made the weekly support zone more important. RSI is oversold, MACD remains bearish, moving averages show a negative trend, ETF flows have been weak and derivatives liquidations have been dominated by longs.
That combination explains why a quick rebound is possible but not yet confirmed.
The strongest evidence of a durable recovery would be a defence of $67,300–$68,000, a reclaim of $70,000 and $73,150, improving spot volume, reduced ETF withdrawals and a healthier derivatives position.
For now, the market is testing whether long-term buyers are willing to step in after the leverage-driven selling. **The bottom is not confirmed by an oversold RSI or a round-number price; it is confirmed when selling loses control and buyers demonstrate sustained demand.**
Technical note: $68,663 is the price you supplied. RSI, MACD, moving averages and derivatives figures are dated market snapshots from November 12–13, not calculations made at that exact price. Levels are reference zones, not guaranteed support or price targets.