

Share your thoughts
placeholder
Article
#BTC重回80K #BTCRetakes80K
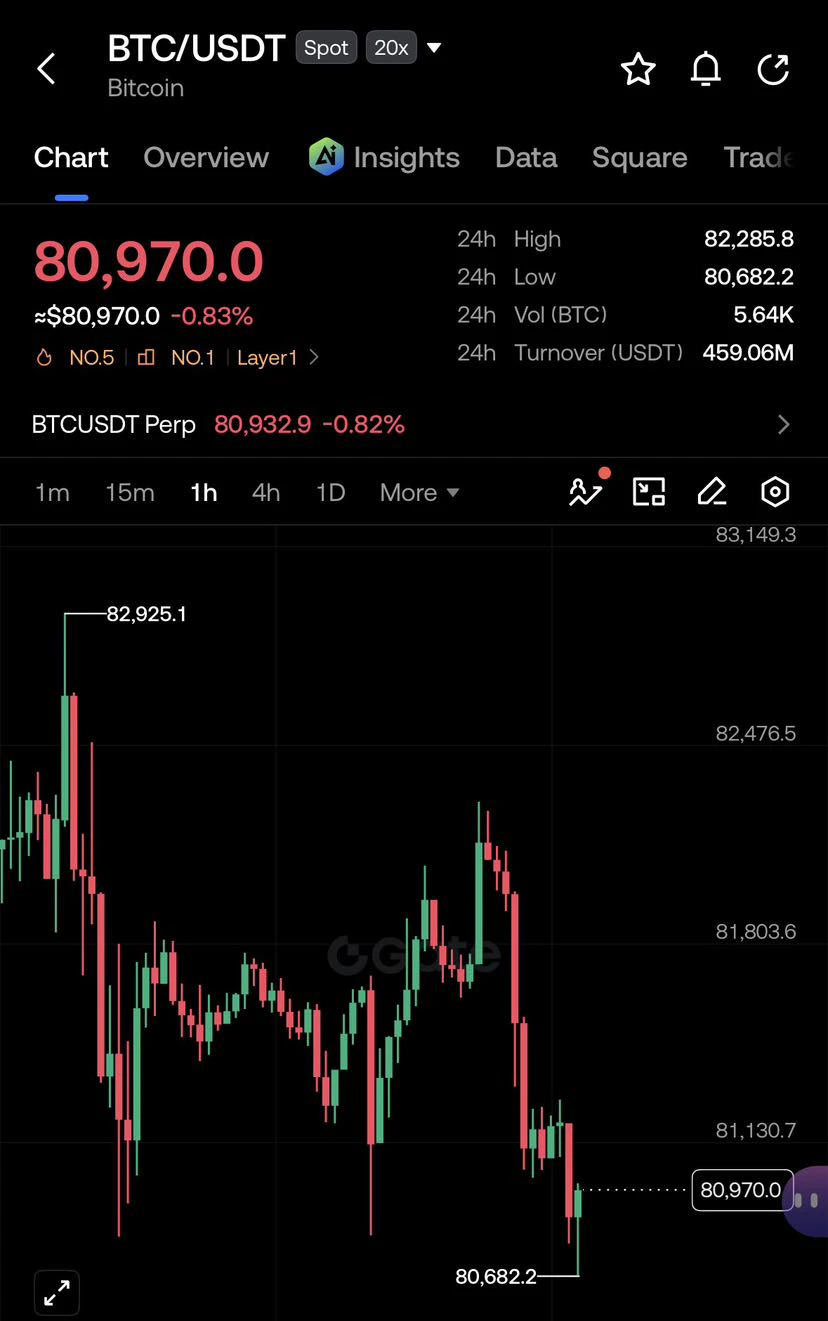
Bitcoin is retaking the $80,000 area, but this move needs to be read carefully.
BTC is currently around $80,360, after reaching a 24-hour high near $81,944 and then falling to a 24-hour low around $80,130. The recovery from that low is why the market is talking about Bitcoin “retaking” $80K again. The important question now is whether buyers can turn this recovery into a stable base or whether $80K becomes another level of rejection.
THE $80K BATTLE
The price action is giving us a clear short-term range.
BTC pushed toward $81,944, but sellers appeared before the marke
post-image
BTC-1.12%
  • 3
Most traders are ignoring the hidden trap forming inside $ONE /USDT right now.

$ONE /USDT - SHORT

Trade Plan:
Entry: 0.003702 – 0.003970
SL: 0.005122
TP1: 0.002871
TP2: 0.002228
TP3: 0.001263

Why this setup?
Why now? The 1h price is sitting at 0.003840 inside a daily range, the 15m RSI reads 45.66 showing balanced pressure, and the 1h ATR of 0.000536 signals the current volatility can fuel a sharp move. The entry zone between 0.003702 and 0.003970 aligns with the short bias at 0.003836, while TP1 at 0.002871 and TP2 at 0.002228 define the measured targets on the way down. The invalidatio
ONE+79.82%
🚨 Garrett Jin Holds $320M in ZEC! 🐋💰
Garrett Jin reportedly holds around 202,080 ZEC, valued at approximately $320 million at the reported price of $1,580. Meanwhile, a 38,000 ZEC short position worth about $60M on Hyperliquid is being described as a potential partial hedge against his spot holdings. �
gate.com
👀 Whale activity is heating up around ZEC!
📊 Spot holdings: ~$320M
🔻 Short position: ~$60M
⚡ Market watching closely for the next move
Ice Trader 🧊📈
#GarrettJin #ZEC #Zcash #CryptoMarket #IceTrader
ZEC-6.23%
  • 4
  • 2
ETH fell 2.59% over the past 24 hours to $2,570, breaking below the 7/30-hour moving averages, with MACD turning negative and ADX pointing downward, indicating clear short-term pressure; however, the funding rate remains near zero, and staking demand is 13.6 times withdrawals, with on-chain and institutional demand still present. With bullish and bearish factors intertwined, ETH may continue to trade sideways in the short term, with ETF flows and macro risks in focus.#MSTR领涨纳指100
post-image
ETH-2.42%
MSTR+16.35%
JUST IN: AAII shows US retail bearishness at 53% as oil rebounds and 10-yr yields hover near 5%; sentiment is nearing a contrarian rebound zone. $SPY (market implication: potential near-term volatility or shift as contrarian crowd positions)
post-image
SPY-0.10%
  • 1
By the way | Bullish bias 🟢 | 15-minute trend pullback/continuation · Confidence: 95/100 Watch: 0.6273 Invalidation line: 0.605391 (3.49%) Targets: 0.654686 / 0.671117 / 0.693026 RSI14: 65.3 · ADX14: 45.7 · Volume: 1.49x If the 15-minute candlestick closes below this invalidation line, the setup is considered invalid. For educational purposes only; this does not constitute financial advice. Leverage carries extremely high risk. $BT
post-image
BTC Update
live-cover
LIVE1,903
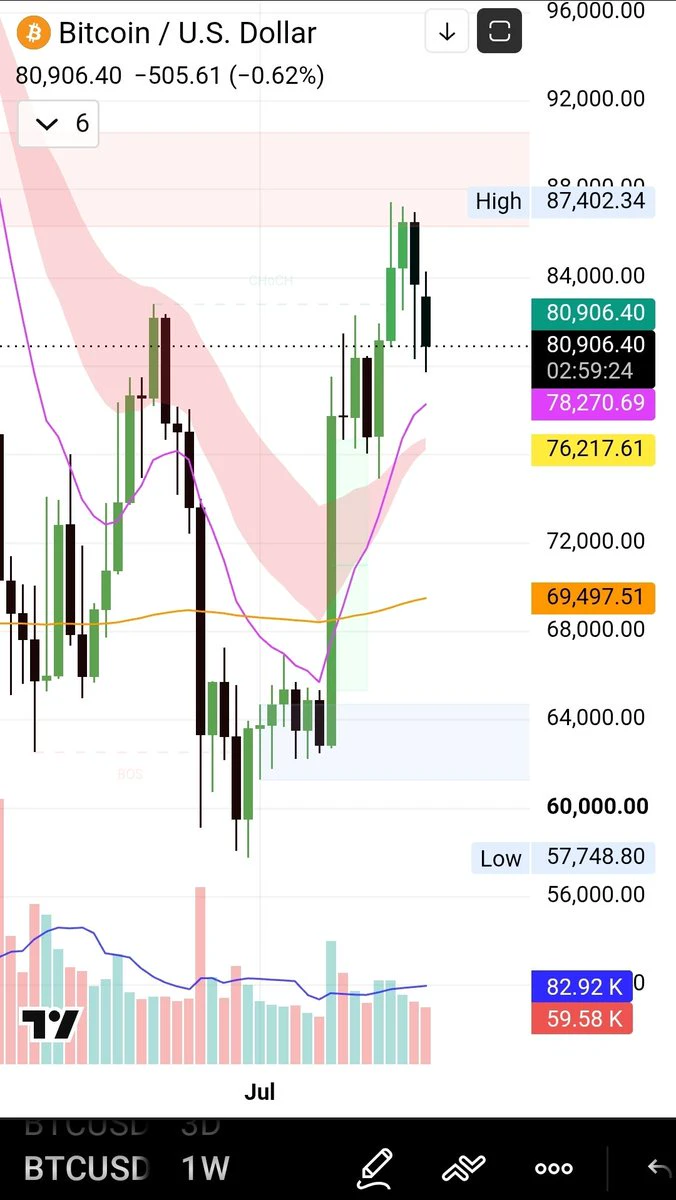
$BTC is at a key decision point 👀
Price is getting rejected from the supply zone so far.
The 50MA is the main level I’m watching below.
🔻 Rejection continues → 50MA retest possible
🔺 Breakout above supply → more upside could follow
No need to guess the next move.
Let BTC confirm it. 👀
#BTCRetakes80K
post-image
BTC-1.08%
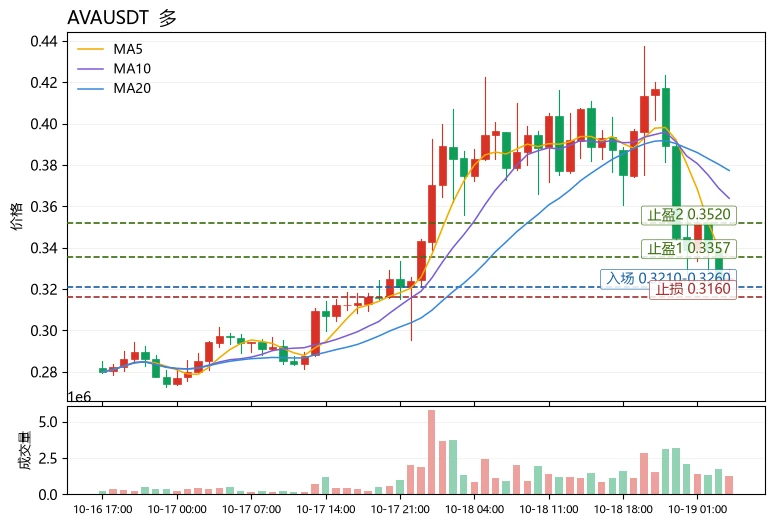
Everyone is sleeping on SYMBOL while the 1D trend turns bullish and the 1h ATR screams volatility is about to explode.

$SOL /USDT - LONG

Trade Plan:
Entry: 108.2 – 108.6
SL: 106.2
TP1: 110.0
TP2: 111.1
TP3: 112.7

Why this setup?
Why now? The daily trend is firmly bullish, which aligns with a 95% confidence long bias, and the 1h price is sitting right at the 108.4 entry reference. The 15m RSI at 49.46 shows room to run without being overbought, while the 1h ATR of 0.905855 confirms that a sharp move is baked into the setup. The target zones of 110.0 and 111.1 represent the first and secon
SOL-3.04%
Bitcoin is back above $80,000. But here’s the catch: institutional positioning isn’t moving in one direction.
The price breakout looks strong on the chart, yet the money behind the move is sending a much more complicated message.
Recent positioning data shows leveraged funds reduced their net short exposure by around 7,275 BTC-equivalent, while asset managers cut their net long exposure by approximately 4,733 BTC. At the same time, U.S. spot Bitcoin ETFs finished the week with only around $6.1 million in net inflows.
That creates an interesting disconnect.
On one side, leveraged traders are be
post-image
BTC-1.08%
🚨 SEPTEMBER IS BREAKING BITCOIN’S HISTORY?
September has historically been one of Bitcoin’s weaker months.
According to the chart, September’s historical average return is around -2.60%, with a median of -2.44%.
But 2026 is looking different so far.
Bitcoin is currently showing a +3.7% September return, putting this month firmly above its historical September average.
The interesting part is that September has often struggled while October and November have historically been much stronger months.
So the real question is:
Is Bitcoin finally breaking the September pattern, or is the month still
post-image
BTC-1.12%
The early-session update five hours ago advised continuing to hold the 2656 short position. It can still be held, with the stop moved to breakeven #BTC重回80K .
YounasTreder
post-image
BTC-1.12%
The most interesting part of @DeriveXYZ V3 has very little to do with people trading directly on Derive.
It’s about distribution.
Hyperliquid already showed what can happen when an exchange becomes infrastructure for other apps:
• Wallets like Phantom and Rabby own the frontend and the user relationship.
• Hyperliquid provides the trading infrastructure.
• The apps get paid for bringing the flow.
And I think this is one of the more interesting ways to think about Derive V3.
Derive doesn’t necessarily need every future options trader to become a direct Derive user either. It can become the opti
post-image
DRV-3.79%
HYPE-1.44%
ETH-2.42%
#晒出我的持仓收益 $Niu Lai, a coin that rides hot trends, can rise sharply in the short term because of the hype, but it is inevitable that it will go to zero when the hype fades.
post-image
牛来-8.38%
$ZEC Key levels first: support below at 1425, first resistance above at 1463, and second resistance at 1501. The current price is 1435.2, trading right along the lower Bollinger Band at 1425.29, down 6.75% over 24h, indicating a weak downward move.
Technically, MA5=1440.08 has crossed below MA20=1463.16, with the short- and medium-term moving averages arranged bearishly. The price is trading below MA5, so any rebound will face resistance. The MACD histogram at -2.412 remains bearish and expanding, with no signs of convergence, and momentum still favors further downside. RSI=30.6 is approaching
post-image
ZEC-6.23%
APT-1.68%
XLM-1.95%
CRYPTO UPDATES
live-cover
LIVE1,545
#MSTR领涨纳指100 MSTR (MicroStrategy)'s recent surge is essentially the result of the combined effects of “Bitcoin price + leverage effect + market sentiment.” There is no absolute time limit for how long this rally can last; it depends entirely on Bitcoin's subsequent performance, changes in MSTR's capital structure, and the evolution of market risk appetite.
I. Core Drivers of This Rally
1. Bitcoin Correlation and Leverage Effect: MSTR is essentially a “leveraged Bitcoin-holding platform.” Its stock price is highly correlated with Bitcoin, and its volatility is far greater than Bitcoin's. Bitcoi
NAS100+0.81%
  • 4
Good afternoon, hope you're all enjoying the weekend and not panicking about illiquid moves on weekends and over trading your positions.
post-image
#美股AI概念股全线反弹
#Gate广场中秋团圆局
US AI Stocks Rebounded Across the Board: The Start of a New Leg Higher or Just a Short-Term Bounce?
Thursday, September 17, 2026 was the session that reset the mood on Wall Street. The Dow Jones Industrial Average added 316.14 points, equal to 0.61%, to close at 51,778.04. The S&P 500 rose 1.14% to 7,637.76. The Nasdaq Composite jumped 1.69% to 26,418.30, its strongest single-day advance of the month. All three major indexes closed higher together, and the leadership came from artificial intelligence rather than defensive sectors. Friday added a quieter follow-throu
post-image
  • 8
  • 1
$MORPHO Short-term bearish, but it has entered an oversold recovery window and is actually more worth watching than its peers in the same sector.
Conclusion first: Among the active coins in the same batch, $C rose +10.71% against the trend while MACD remained negative, indicating an emotional impulse; $LSK fell 15.03%, with a funding rate of -0.1051%, showing the highest short-side crowding; meanwhile, $MORPHO fell 10.26%, with an RSI of 36.5, matching LSK, but its funding rate remained positive at +0.0050%, indicating that longs have not capitulated and the leverage structure is cleaner—o
post-image
MORPHO-6.96%
LSK-14.73%
Load More

Join 40 M users in our growing community

⚡️ Join 40 M users in the crypto craze discussion

💬 Engage with your favorite top creators

👍 See what interests you

Trending Topics

MSTRTopsNasdaq100

73.81k Views2.84k Discussing

Strategy (MSTR) has gained about 48% over the past month, making it the best-performing stock in the Nasdaq 100, while Bitcoin rose roughly 12% over the same period. The company holds 845,050 BTC with a cumulative cost basis of about $63.73B. MSTR is not a pure Bitcoin proxy — its price swings can be more extreme. Can this rally last?

Gate Tops 24H Net Inflows Among Exchanges

26.33k Views3.67k Discussing

BTCRetakes80K

56.85k Views60.31k Discussing

View More