




Share your thoughts
placeholder
Article
Everyone’s chasing TAO’s green candles, but the 4h tape is screaming something they refuse to hear.

$TAO /USDT - SHORT

Trade Plan:
Entry: 267.0 – 269.4
SL: 283.5
TP1: 256.7
TP2: 249.1
TP3: 237.6

Why this setup?
- RSI on the 15m is overheated at 69.6—buyers are exhausted right as price tags the 268.2 reference.
- ATR (1h: 4.89) shows volatility is compressing; a snap back toward 256.7 (TP1) is the path of least resistance.
- 1D trend is range-bound, so fading the top of the range (269.4) with a 77.4 confidence short isn’t a gamble—it’s statistical edge.

Debate:
If TAO rejects 269 an
TAO+10.87%
The market humbles everyone eventually, but this time it has been pretty gentle with me.
When it plunged intraday, 1.117 looked like it was about to collapse, but it ultimately couldn’t push any lower. Volume dried up completely—those who were going to run had already done so, leaving only the ones who didn’t want to move.
When I checked the chart after lunch, the price had already started quietly climbing back. I had just one thought at the time: at this level, set a stop-loss and take a shot at a rebound.
Now at 4.532, with a +14729.64% return, the guys on board should be waking up laughing,
post-image
SNDK+1.12%
XRP+0.32%
#HYPEBreaks88HitsNewAllTimeHigh HYPE BREAKS $88 AND HITS A NEW ALL-TIME HIGH!
The Hyperliquid ecosystem is once again taking center stage as HYPE pushes into fresh price-discovery territory. The token recently broke above the $88 level and went on to print a new record high near $89.6, confirming one of the strongest rallies in the crypto market.
A Powerful Breakout
HYPE had already been showing remarkable strength throughout the recent market recovery, but breaking above previous highs is a different story. Once an asset enters price discovery, there are no major historical resistance level
post-image
HYPE+2.36%
BTC+0.29%
#美国8月非农超预期 | U.S. August Nonfarm Payrolls Beat Expectations
The U.S. labor market delivered a major upside surprise in August, adding 162,000 nonfarm jobs, far above the market expectation of roughly 53,000–56,000 jobs. The unemployment rate remained steady at 4.1%, showing that the American labor market is proving more resilient than many investors had anticipated.
Why does this matter?
A stronger-than-expected jobs report can significantly influence the Federal Reserve's interest-rate decisions. When employment remains strong, the Fed has less pressure to support the economy through lower
post-image
BTC+0.29%
NFP+1.64%
My hand trembled when I set the stop-loss a few days ago, only to realize this morning that the filial piety was unnecessary. 😌

As the market repeatedly swung intraday, the price kept grinding around 91.82, with the volume shrinking more and more noticeably. Someone stepped in to buy every dip. I watched it for half a day; this kind of level is more of an opportunity than a panic signal, so I cautiously took a shot.

The price has now climbed to 104.92, giving a floating profit of +687.56%. We caught the rhythm of this move perfectly, and everyone is feeling great.

Don't lose your patien
post-image
ADA+0.77%
ZEC+19.99%
A few days ago, the hand that set the stop-loss trembled slightly; this morning I realized that extra bit of filial piety was unnecessary. When $PENDLE was repeatedly fluctuating intraday, everyone was running, while I was the only one watching the key level.
The key level held, and buying support was always there. This wasn't distribution—it was shaking people out. I decisively opened a long around 1.540, and the price later reached 2.1.
A +2568.2% gain. In one sentence: that was a very satisfying bite.
The brothers on board should have woken up laughing.
Being out of the market isn't a sin;
post-image
PENDLE+4.02%
BNB-2.59%
BTC+0.27%
Beginner Trader - Real Account Live
live-cover
LIVE81
What can be the AMC top? I’m a bit conflicted.
post-image
AMC+0.67%
A few days ago, I was still calculating whether I had enough money for instant noodles this month; this morning, I was already wondering whether to add a sausage. The reason is simple: this wave of short positions delivered another big chunk of profit.

When the market was just being dumped in the early session, I watched several rounds of rebounds. Selling pressure was especially strong, while buying support was weak. The price kept grinding back and forth without moving up. As it continued to grind, an opportunity emerged. I entered at 0.09355, and the current price has already reached 0.03
post-image
SNDK+1.12%
DOGE+0.24%
A few days ago, I was still calculating whether I had enough money for instant noodles; this morning, I was already wondering whether to add sausage. 😏 This short position turned out to be a genuinely unexpected bonus.

When the screen was filled with green, I instead felt that an opportunity had arrived—the lack of buying support let sell orders push the price all the way down, and every rebound was simply a bull trap. This is the comfort zone for short positions.

Opened a short at 0.07390, now at 0.05947, +477.82%. This profit feels so good—I can finally have a proper meal. 📉

The mark
post-image
LAB-3.96%
ETH+1.06%
9、7 Morning Market Analysis and Strategy:
Gold opened lower in the morning before bottoming out and rebounding, with the current price at 4432.52. On the one-hour timeframe, the short-term moving averages are intertwined; the 5-day and 10-day moving averages are turning upward, while the 20-day moving average is pressing down on prices, indicating a corrective consolidation pattern after a sharp drop. Short-term resistance above is 4444‑4448, where the 20-day moving average is exerting pressure; the first support below is 4427, with key defensive support at 4417. If support is breached, the pu
post-image
XAUT-0.03%
Everyone is focused on Bitcoin’s weekly close $BTC
, while I’m focused on taking profits in altcoins 💲🤑
The idea of all coins forming a new bottom has become a distant dream
You took the bait, my bear-market friend... you took the bait 😘
post-image
BTC+0.29%
bitcoin:native about to take off
BTC+0.29%
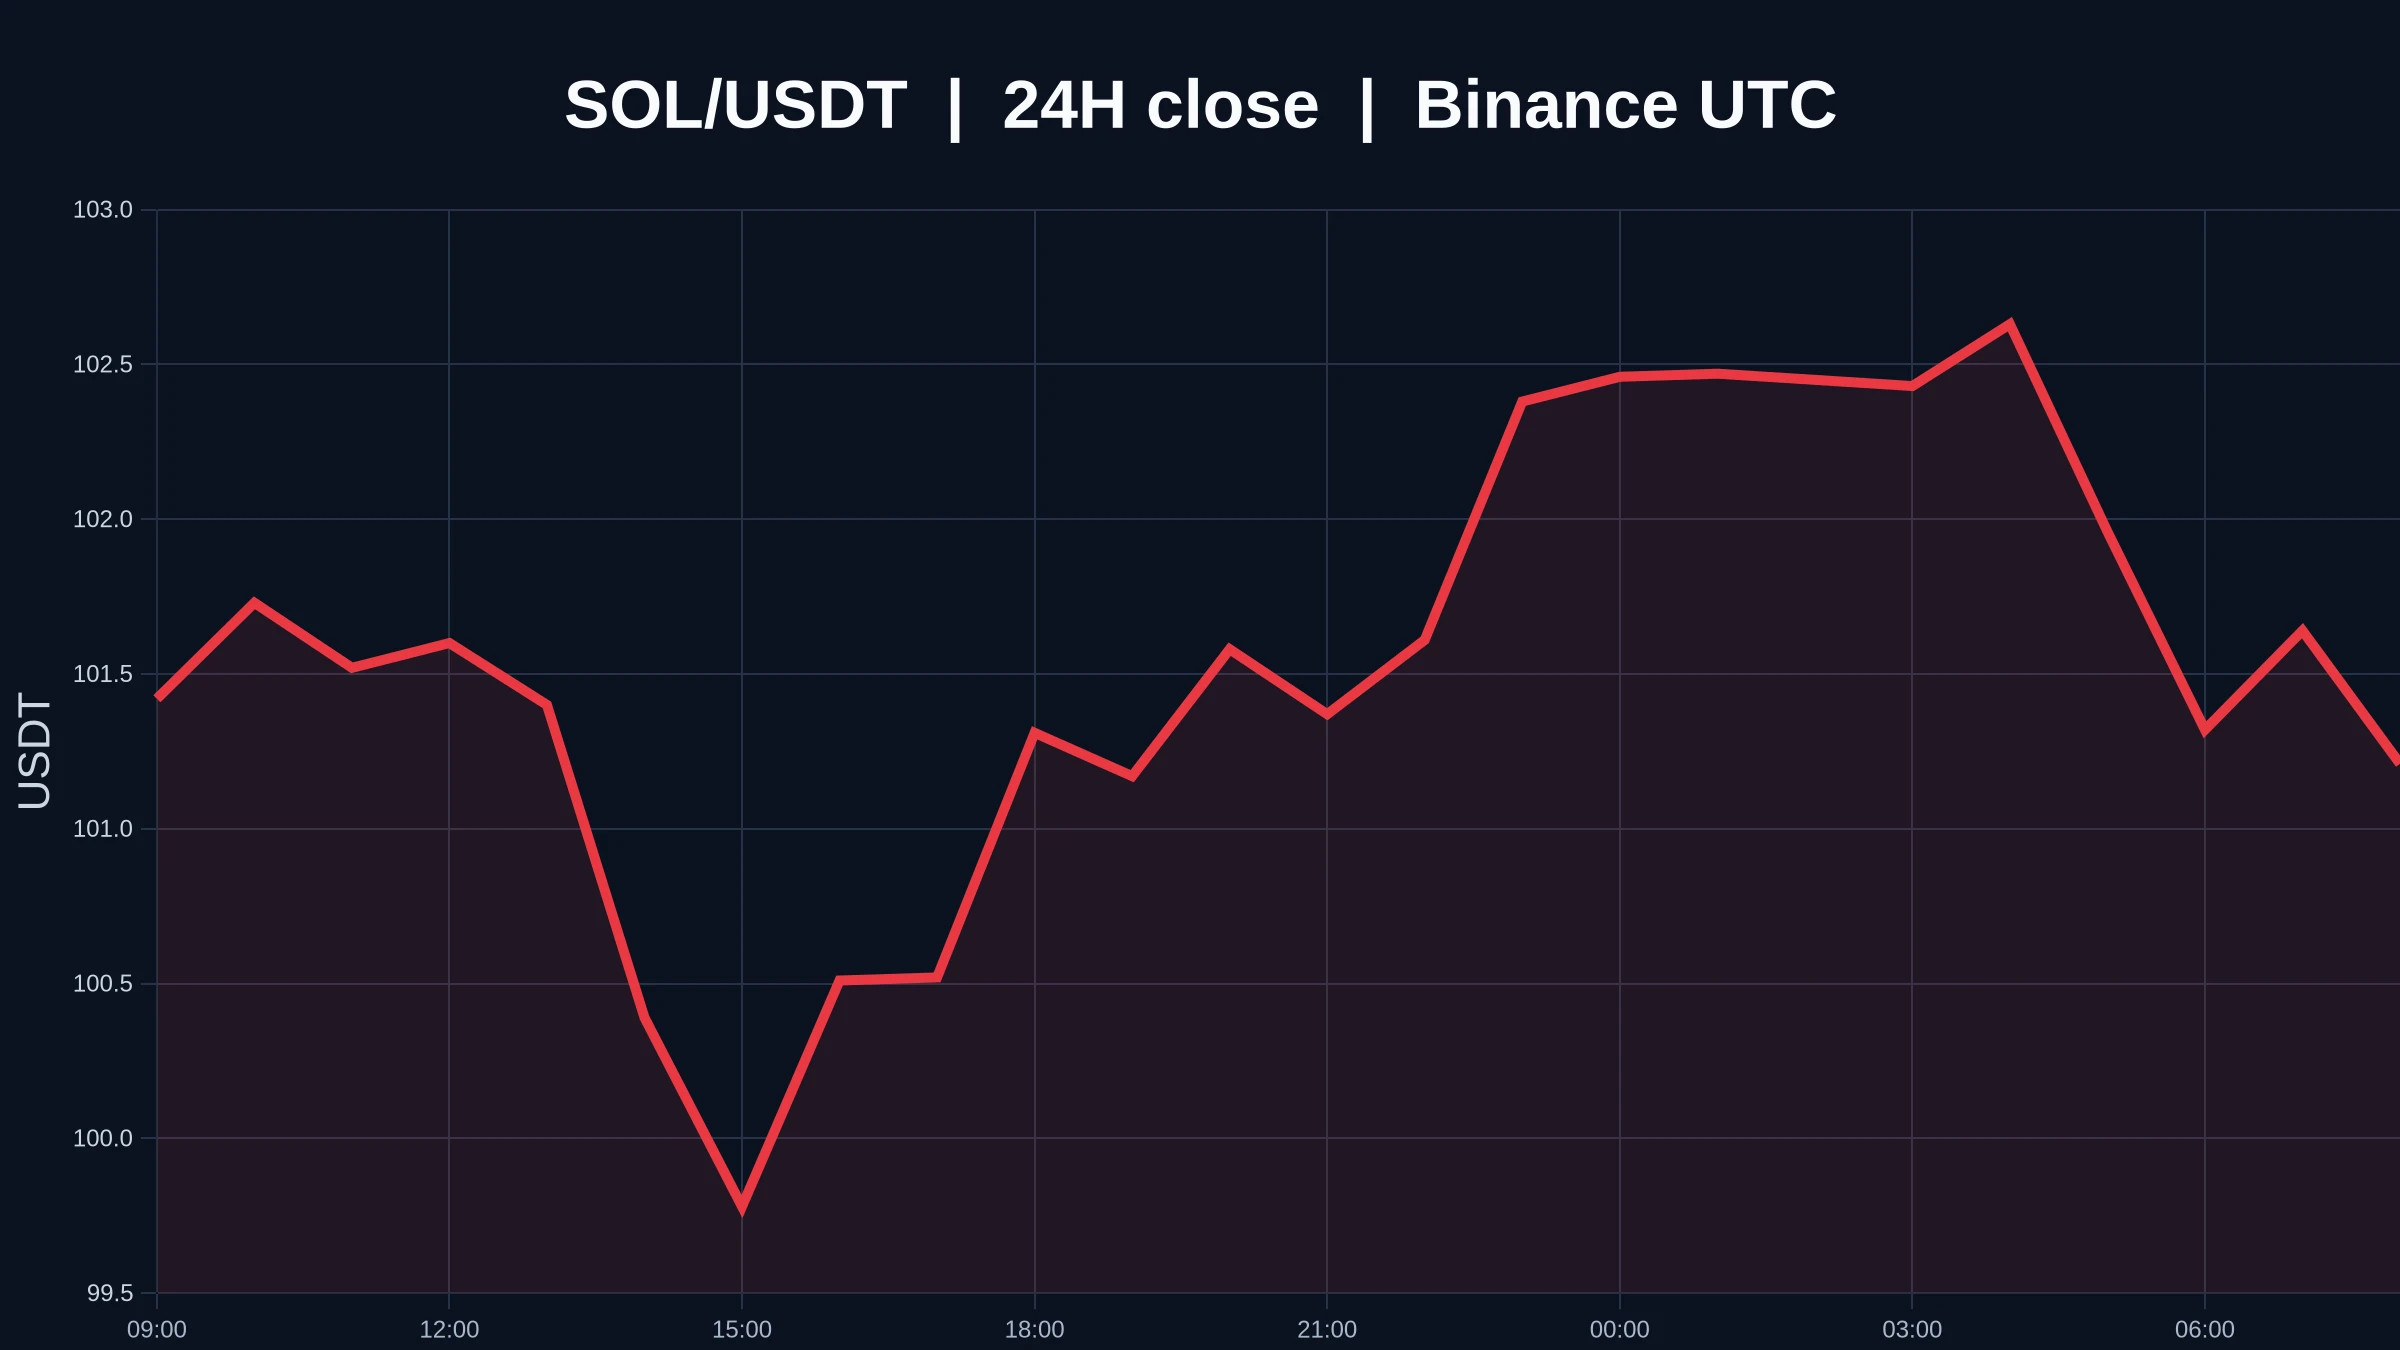
This kind of return makes me nervous, fearing the market will come to its senses tomorrow and blacklist me lol 🔥 This move was purely the market doing well on its own. A few days ago, I was still reviewing the market before bed, $SOL and the rebound that afternoon a few days ago really had something to it: every time the price surged, someone was there to buy, and the trading volume was also more genuine than before. Anyway, I gave all the warnings I needed to give and simply held the 84.84 level without moving.
When I woke up and checked my phone, wow—105.91 had practically delivered the or
post-image
SOL+2.40%
BTC+0.27%
LAB-3.96%
( new streamer) market overview
live-cover
LIVE46
This trend doesn’t even require me to think—the account is dancing on its own. Before the market had fully started, $UNI held its key level, had moved sideways at the bottom for so long, and buying pressure was strengthening. I judged this move would most likely step up to the next level, so I went long directly. Entered at 5.766, now 7.113, +1658.77%. It was truly sluggish at first, but the breakout feels great; getting the rhythm right is just comfortable. Trading-wise: Take 80% off the table first—don’t get greedy for the last bite. Move the stop-loss on the remaining 20% to the entry price
post-image
UNI+1.21%
LAB-3.96%
XRP+0.32%
Everyone’s long ZEC while the 4h chart screams distribution—who’s right?

$ZEC /USDT - SHORT

Trade Plan:
Entry: 1215.39 – 1231.17
SL: 1321.75
TP1: 1149.43
TP2: 1100.20
TP3: 1026.35

Why this setup?
- 1D trend is bullish, but the 4h setup says otherwise: SHORT bias at 84 confidence.
- Price is pinned at 1223.28 with RSI(15m) at 52—no momentum, just chop before the drop.
- ATR(1h) of 31.5 means we’re primed for a 2.5%+ move; targets sit at 1149 (TP1) and 1100 (TP2).
- Why now? The “waiting” status means the trap is set—either we sweep 1231 or dump.

Debate:
Are you fading this bullish
ZEC+19.99%
$JASMY held the horizontal support + the 50 daily moving average like a pro.
I can’t wait for tomorrow to explain how bullish this is 😊📈🚀
post-image
JASMY-0.34%
Gold Pulls Back to Build Momentum, Awaiting a Breakout Amid Rate-Hike Expectations
The four-hour chart shows that gold prices pulled back after touching a high of $4,696 and are currently trading near the middle Bollinger Band. The RSI is in neutral territory, indicating that buying and selling forces are temporarily balanced, with the short-term direction awaiting breakout confirmation.
At the news level, the market is closely focused on the Federal Reserve’s September interest-rate decision, with expectations of whether to raise rates repeatedly shifting. Various U.S. economic data continue
post-image
XAU-0.10%
This profit has me feeling both thrilled and apprehensive, afraid the market will catch on tomorrow and blacklist me😂 I opened the chart this morning and saw $SAHARA still grinding around the highs, with a weak rebound and no volume on the way up. I immediately felt something was off with the trend—it looked exactly like a bull trap😏

Right after I finished reading the bearish news, it happened to give me an entry for a short at 0.03226. I wasn't expecting to make much, but when I checked just now, the current price had already dropped to 0.00932, with +3424.49% firmly in my hands. Staying
post-image
SAHARA-0.32%
LAB-3.96%
SNDK+1.12%
Load More

Join 40 M users in our growing community

⚡️ Join 40 M users in the crypto craze discussion

💬 Engage with your favorite top creators

👍 See what interests you

View More