Square
Following
Hot
News
Profile
Share your thoughts
placeholder
Article
Getting the close I was hoping for
Time to send it 🚀🚀
post-image
Honestly, sitting here at eight in the morning makes me feel a little uneasy.
I've watched it for two hours, and that bar on the screen has traded just 205 contracts.
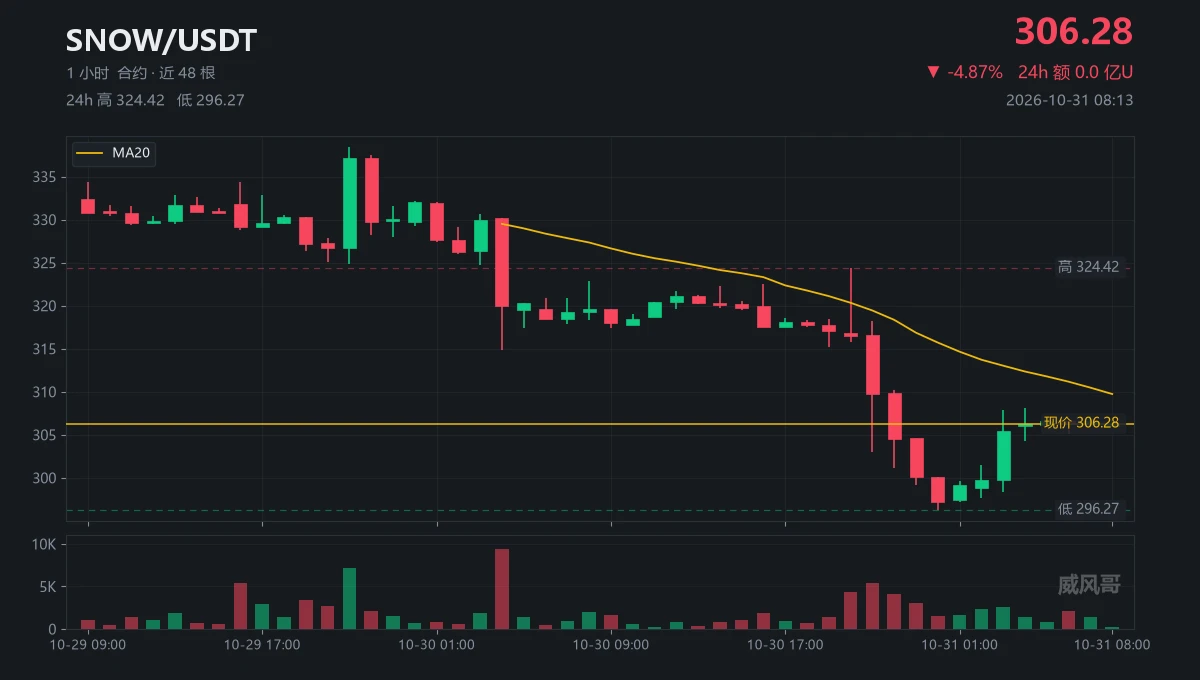
$SNOW is now at 306.28, with a 24-hour high of 324.42 and low of 296.27.
At 9 p.m. on 10-29, it was still at 338.44; 41 hours later, it reached 296.27.
$42.17, 12.5%, all in one go.
Those bars on the way down traded 5430 and 4069 contracts, one to four times the average volume.
The rebound peaked at just 2538; the latest bar traded 205.
The drop came on volume; the rise didn't.
This is a rebound, not a reversal.
MA20 is at 309.7
post-image
SNOW+0.29%
Trenches
ZIG
Z
bade
b
ZIG
0x8c...1145
Market Cap
$.
Change
.
24h Vol
$.
Holders
.
IDOL
I
bade
b
IDOL
0x3b...ab07
Market Cap
$.
Change
.
24h Vol
$.
Holders
.
SAFU
S
bade
b
SAFU
0x7c...7777
Market Cap
$.
Change
.
24h Vol
$.
Holders
.
Q
Q
bade
b
Q
0xc0...0589
Market Cap
$.
Change
.
24h Vol
$.
Holders
.
STONK
S
bade
b
STONK
6GmA...UNgx
Market Cap
$.
Change
.
24h Vol
$.
Holders
.
$BTC Don’t call it a bull run until it breaks 95,000. A Wall Street analyst said on TV that $MSTR could hit 570 by year-end, provided Bitcoin first gets above 95,000. Sounds like they’re dangling a carrot, but they’ve actually laid out the condition. A rally on low volume is suspect—sooner or later, volume needs to catch up. Be especially cautious with calls like this. What do you think?
#Bitcoin
post-image
BTC-0.67%
MSTR-7.78%
  • 11
  • 1
#BTC大跌
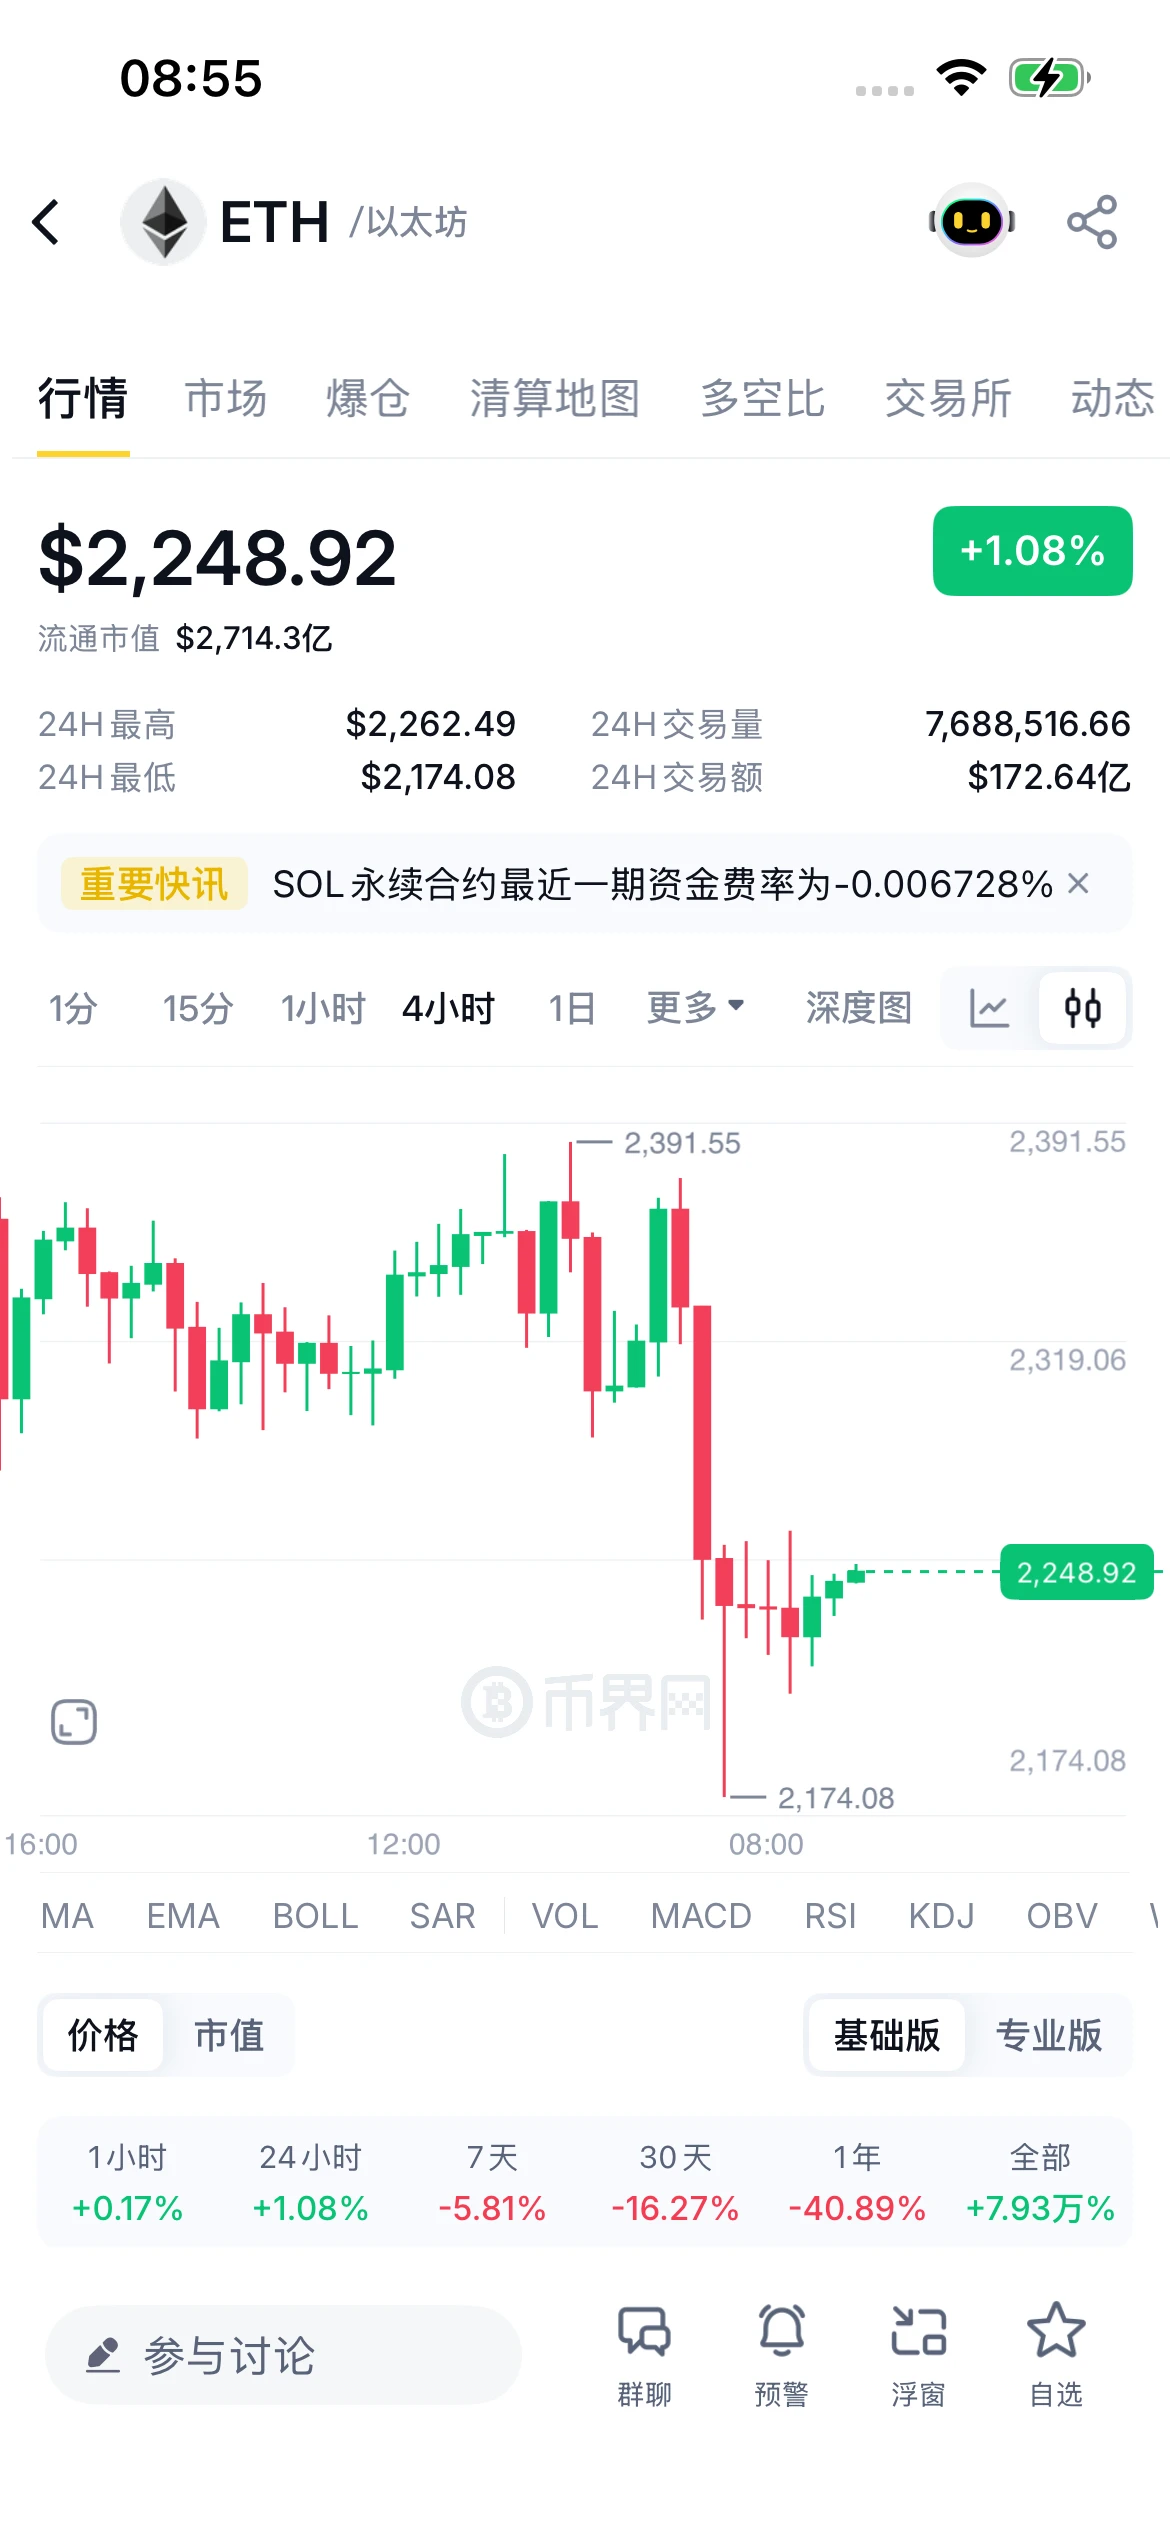
ETH 2,594 short position: current price 2,248.92, unrealized profit 345.08 🔥
⚠️ Holding above the previous low; beware stop-loss sweeps on a rebound: current price 2,248.92 remains above the previous low of 2,174.08 (24H low). A weak bounce of +1.08% from the low, with a slight intraday gain, but price remains in the bearish zone below the nearby resistance at 2,416.87; watch the 2,282–2,334 resistance zone and beware of a rebound triggering stop-losses.
Market: ETH formed a double top on the 4H chart from 2,391.55 (24H high) and pulled back, plunging to 2,174.08 before recovering to
post-image
BTC-0.67%
ETH-1.23%
SOL-0.74%
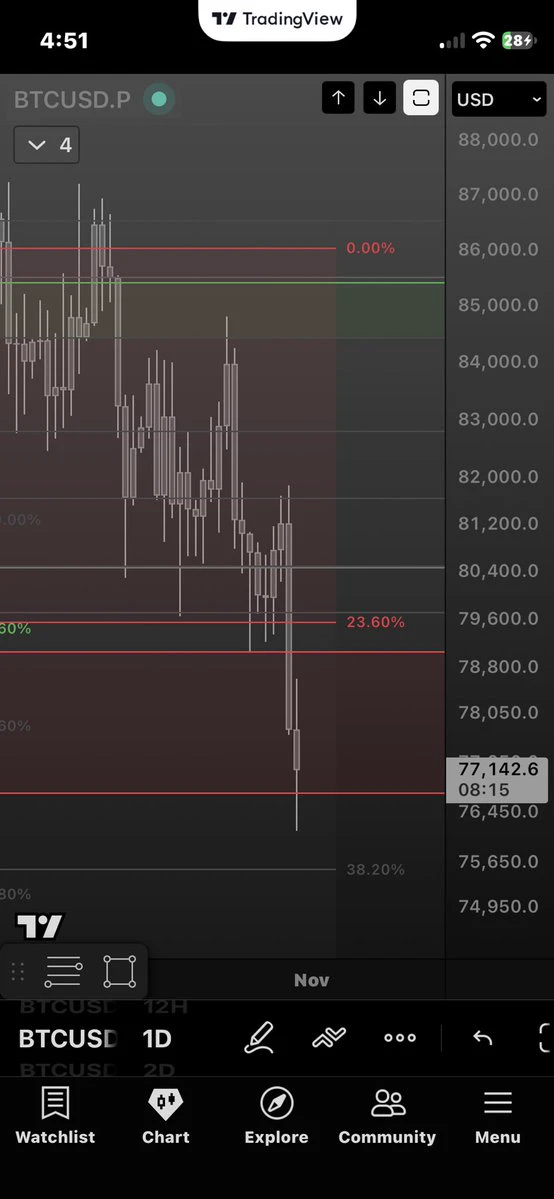
$BTC – Bulls could be preparing for a strong rebound toward higher resistance levels ₿🚀Long $BTCEntry: 77,100 - 77,500SL: 76,000TP: 78,500 - 79,500 - 81,000$BTC is approaching a potential demand zone where buyers could step in and defend the current price structure. If this area holds and buying pressure starts to build, Bitcoin may regain bullish momentum and push toward the next resistance levels. A strong bounce supported by increasing volume would help confirm this recovery scenario.**Disclaimer: "This is only my personal opinion, not investment advice, and is not intended for Vietnamese
post-image
BTC-0.67%
[NEWSTREAMER] market update
live-cover
LIVE1,262
  • 1
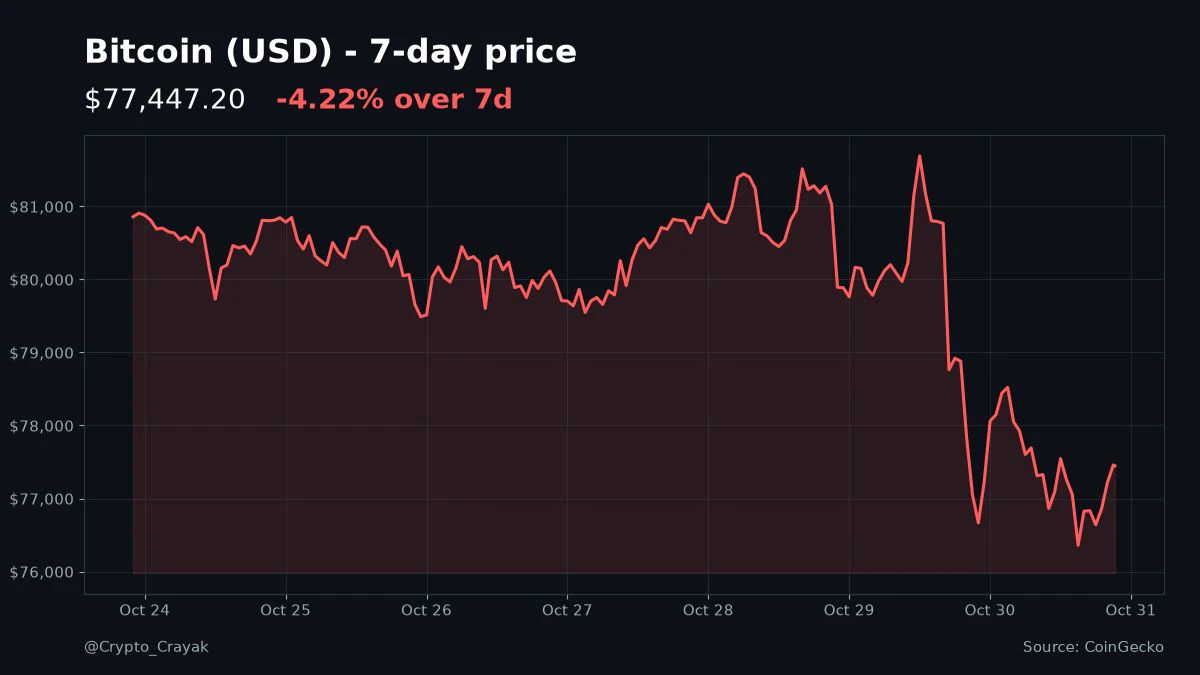
BTC slid about 4% this week and is sitting around $77.4K tonight.
Honestly, slow red weeks like this don't rattle me much. They're usually when I pay the closest attention to what's actually being built.
Anyone else just watching and waiting this weekend? #Bitcoin
post-image
BTC-0.67%
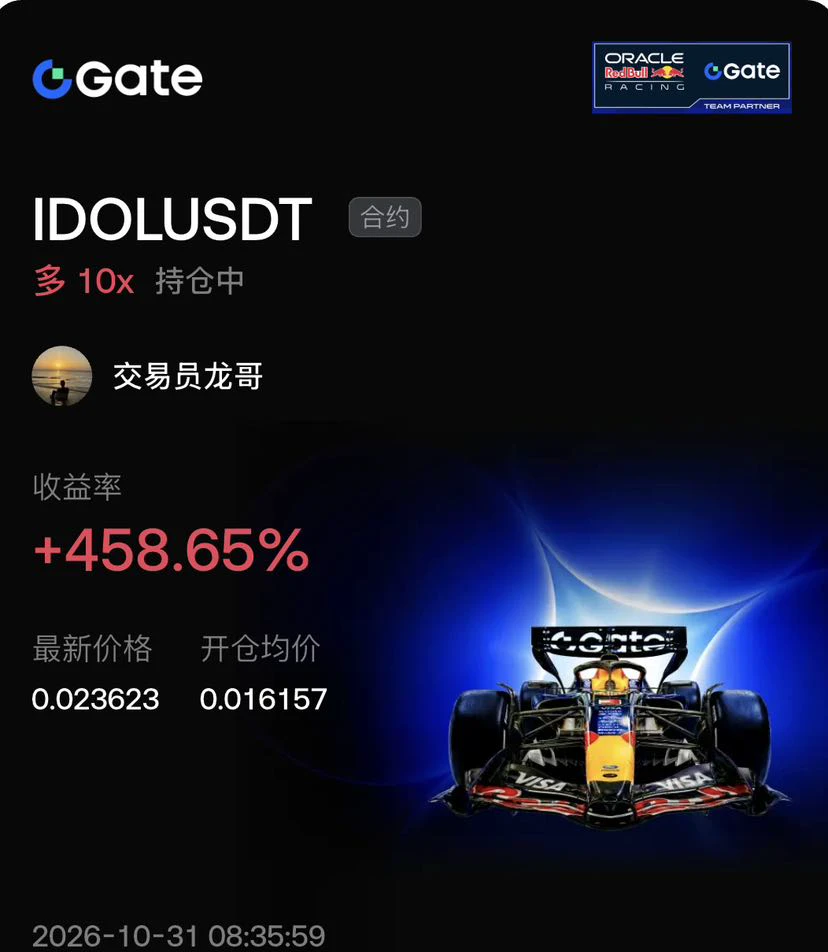
10x leveraged long position rakes in 458% returns! $IDOL Bulls keep pushing!
A precise entry at the bottom at 0.016157, with the price surging to 0.023623! Despite volatility, returns still soared to +458.65%! Bottom-held positions are rock solid, and the upside is wide open! Stop hesitating and watching from the sidelines—going long with the trend is the way to go! Want to hop aboard Brother Long’s rocket to riches? Click the pinned post now to join the group and ask about the market, get precise entry points, and reap the gains together! $BTC $ETH
#BTC大跌
post-image
IDOL-7.01%
BTC-0.65%
ETH-1.23%
#Esquerdasegueesquerda
#LulaTheGreatestInTheWorld
Brazil belongs to the people.
post-image
#AIP AIP mode officially launches—let's go for 10,000x...
  • 1
#BTC大跌
🚨 #BTC大跌 – Bitcoin Faces a Major Market Correction!
Bitcoin is currently facing strong selling pressure, and the crypto market is experiencing a difficult period. BTC has seen a significant price decline, creating uncertainty among traders and investors. This sudden movement has attracted attention across the entire cryptocurrency market.
Bitcoin is one of the most important digital assets in the world. Whenever BTC moves sharply, the impact can also be seen in Ethereum and many other cryptocurrencies. A major drop in Bitcoin can increase market fear, trigger liquidations, and create
BTC-0.67%
ETH-1.26%
  • 1
The little girl's cheeks are slightly flushed.
Does she have a fever?😳
post-image
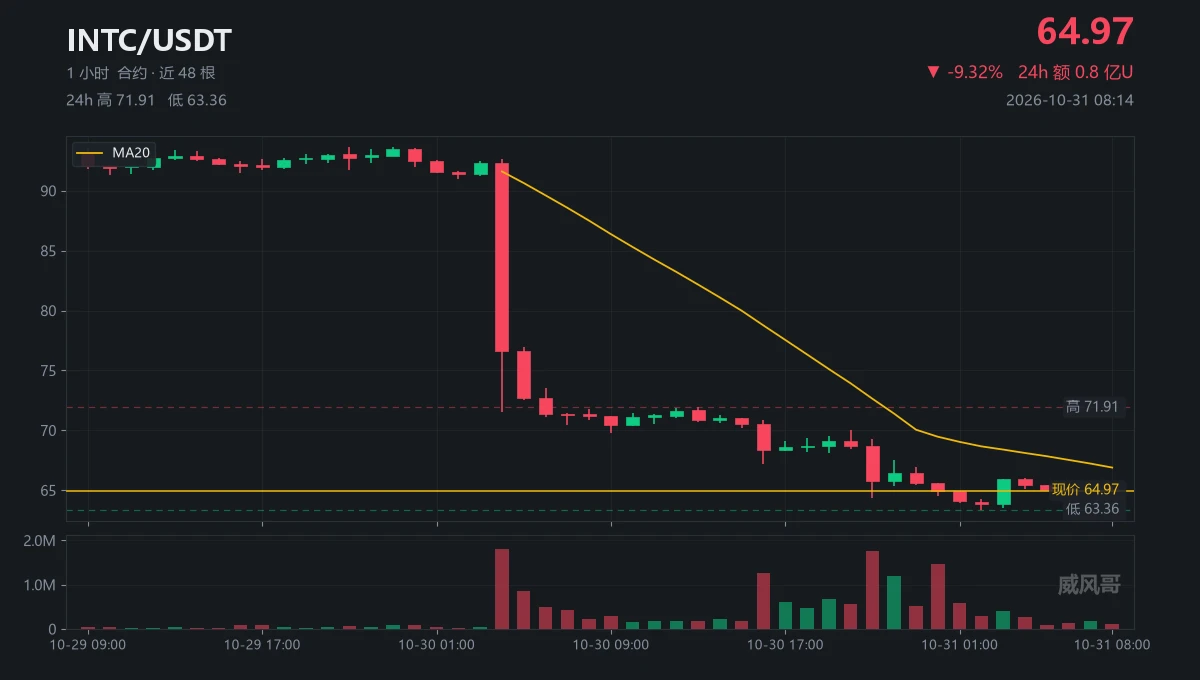
This morning, I sat down and counted all 48 hourly candles on $INTC , one by one.
When I finished, I had just one thought: this isn’t a drop—it’s a four-step staircase.
1. The candle at 92.65 crashed straight down to 71.49, with a volume of 1.79 million contracts.
2. Price moved sideways around 71 for fourteen hours, then broke below 70.90 to 67.19, with a volume of 1.26 million.
3. It broke below 69.31 again and slid all the way to 64.39, with a volume of 1.76 million.
4. One final move at 66.94 broke below 64.48 to 63.36, with a volume of 1.47 million.
Four candles, each with a lower low tha
post-image
INTC+0.05%
Why Doesn’t Price Necessarily Fall Immediately When MACD Shows Bearish Divergence?
In the crypto market, when prices keep making new highs while the highs on the MACD indicator gradually decline, bearish divergence may be forming. Many traders see this as a short signal, but bearish divergence indicates that upward momentum may be weakening; it does not mean that prices will necessarily fall immediately.
First, understand what bearish divergence means.
Bearish divergence typically occurs when price highs keep rising while the corresponding MACD highs gradually decline. This may indicate that u
post-image
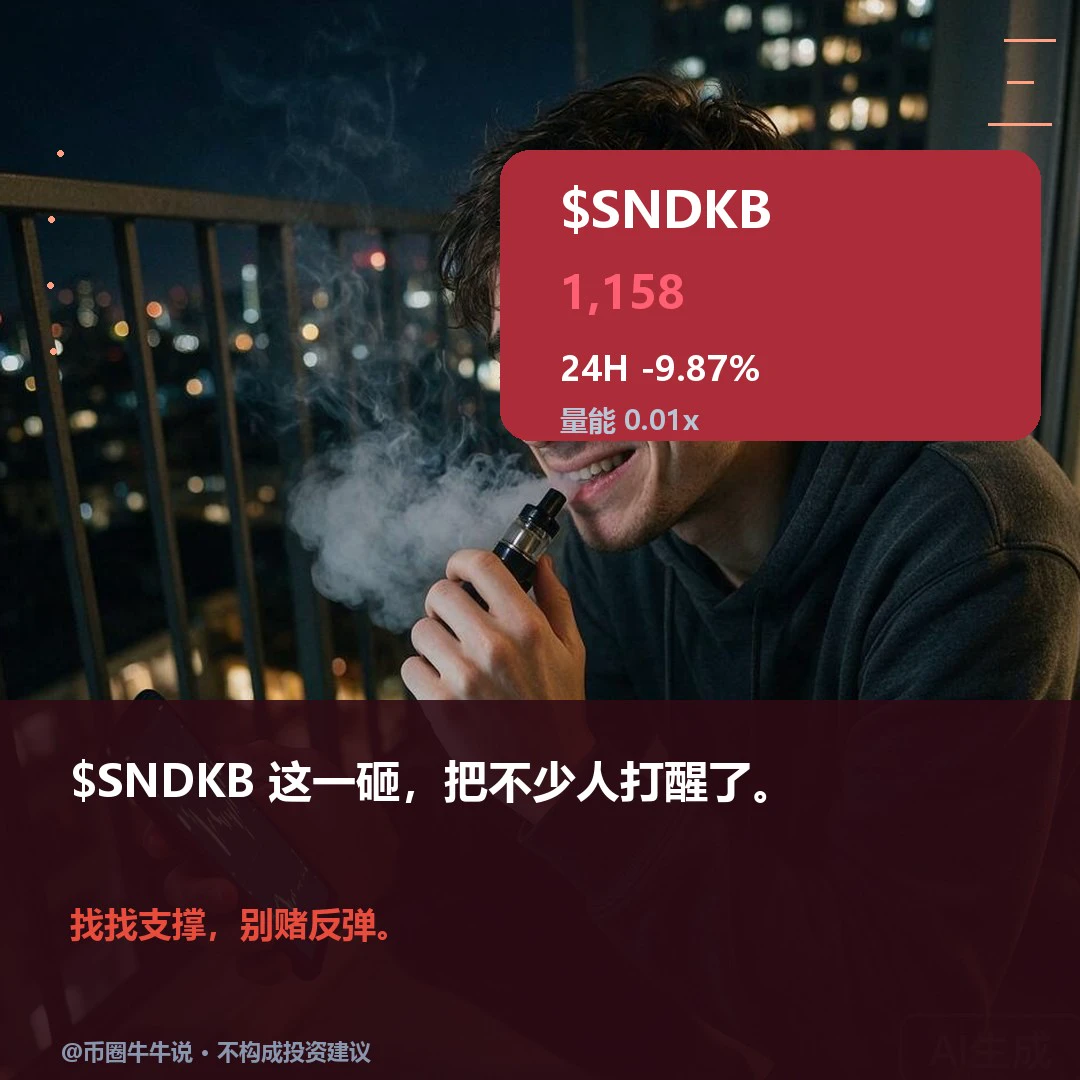
Weak. $SNDKB is currently priced at 1,158.29, with both the one-hour and four-hour trends looking weak. The RSI has entered oversold territory, but oversold only indicates that selling pressure has occurred; it doesn't mean the price is cheap, much less that anyone is genuinely defending support. The price is still some distance from the 1116.67 support, while one-hour trading volume is less than one percent of its usual level. This low-volume decline looks more like the market dragging along in place. Demand for a rebound is increasing, but a reversal still lacks one piece of evidence: only w
post-image
BTC falls below $80k, and I actually start keeping a close eye on these prices!
Bitcoin has fallen to $77k, breaking below the key $80k level, and the market has instantly switched from “the bull market is just around the corner” to “are we heading into a bear market?” I have to say, crypto investors’ emotions are even more intense than Bitcoin’s candlestick chart!
But viewed from another angle, this pullback may not be all bad. The concentrated liquidation of leveraged longs means some irrational positions are being cleared out. What’s really worth watching isn’t how much prices have fallen t
NVDA-4.16%
  • 35
Layout: Bitcoin, Ethereum, Dogecoin
live-cover
LIVE894
  • 3
GM.
Another beautiful day!
post-image
Load More

Join 40 M users in our growing community

⚡️ Join 40 M users in the crypto craze discussion

💬 Engage with your favorite top creators

👍 See what interests you

Trending Topics

BTC大跌

195.25k Views39.51k Discussing

$BTC briefly fell below $77,000 and remains under pressure around the $77K zone, with its 24-hour decline still above 4%. With risk appetite weakening and Fed uncertainty rising, where is the next key support after losing $80K?

IntelBeatsEarningsButStockPlunges

13.91k Views736 Discussing

StrategySTRCNears100ParValue

17.57k Views4.03k Discussing

View More