Square
Following
Hot
News
Profile
Share your thoughts
placeholder
Article
$NAS100 ‌
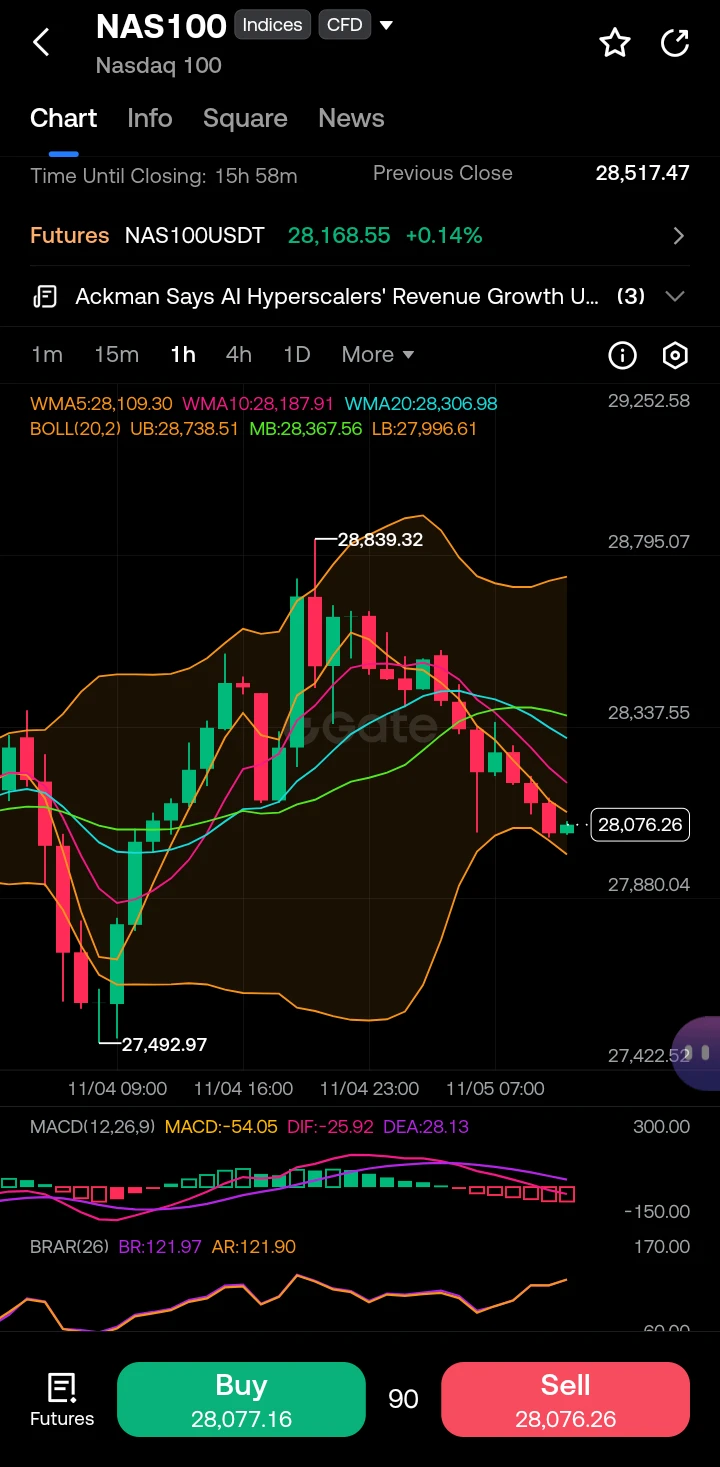
NAS100 | Bearish Momentum Builds Below Key Moving Averages; Watch Support Tests
The Nasdaq 100 is currently exhibiting a short-term bearish posture on the intraday charts, following a rejection from recent highs. Price action has shifted decidedly downward, with the index currently trading near 28,076.
On the technical front, moving averages are tilting toward a bearish alignment. The price is currently being pressured below the short-term weighted moving averages (WMA5 at 28,109 and WMA10 at 28,187), indicating that intraday rallies are facing immediate supply. Furthermore, the ind
post-image
NAS100-1.20%
  • 6
  • 2
Don't share a GPT account with friends. Remember.
post-image
Trenches
ZIG
Z
bade
b
ZIG
0x8c...1145
Market Cap
$.
Change
.
24h Vol
$.
Holders
.
BTC
B
bade
b
BTC
C5xp...pump
Market Cap
$.
Change
.
24h Vol
$.
Holders
.
HIGH
H
bade
b
HIGH
7ymF...high
Market Cap
$.
Change
.
24h Vol
$.
Holders
.
STONK
S
bade
b
STONK
6GmA...UNgx
Market Cap
$.
Change
.
24h Vol
$.
Holders
.
CORLA
C
bade
b
CORLA
0xba...7777
Market Cap
$.
Change
.
24h Vol
$.
Holders
.
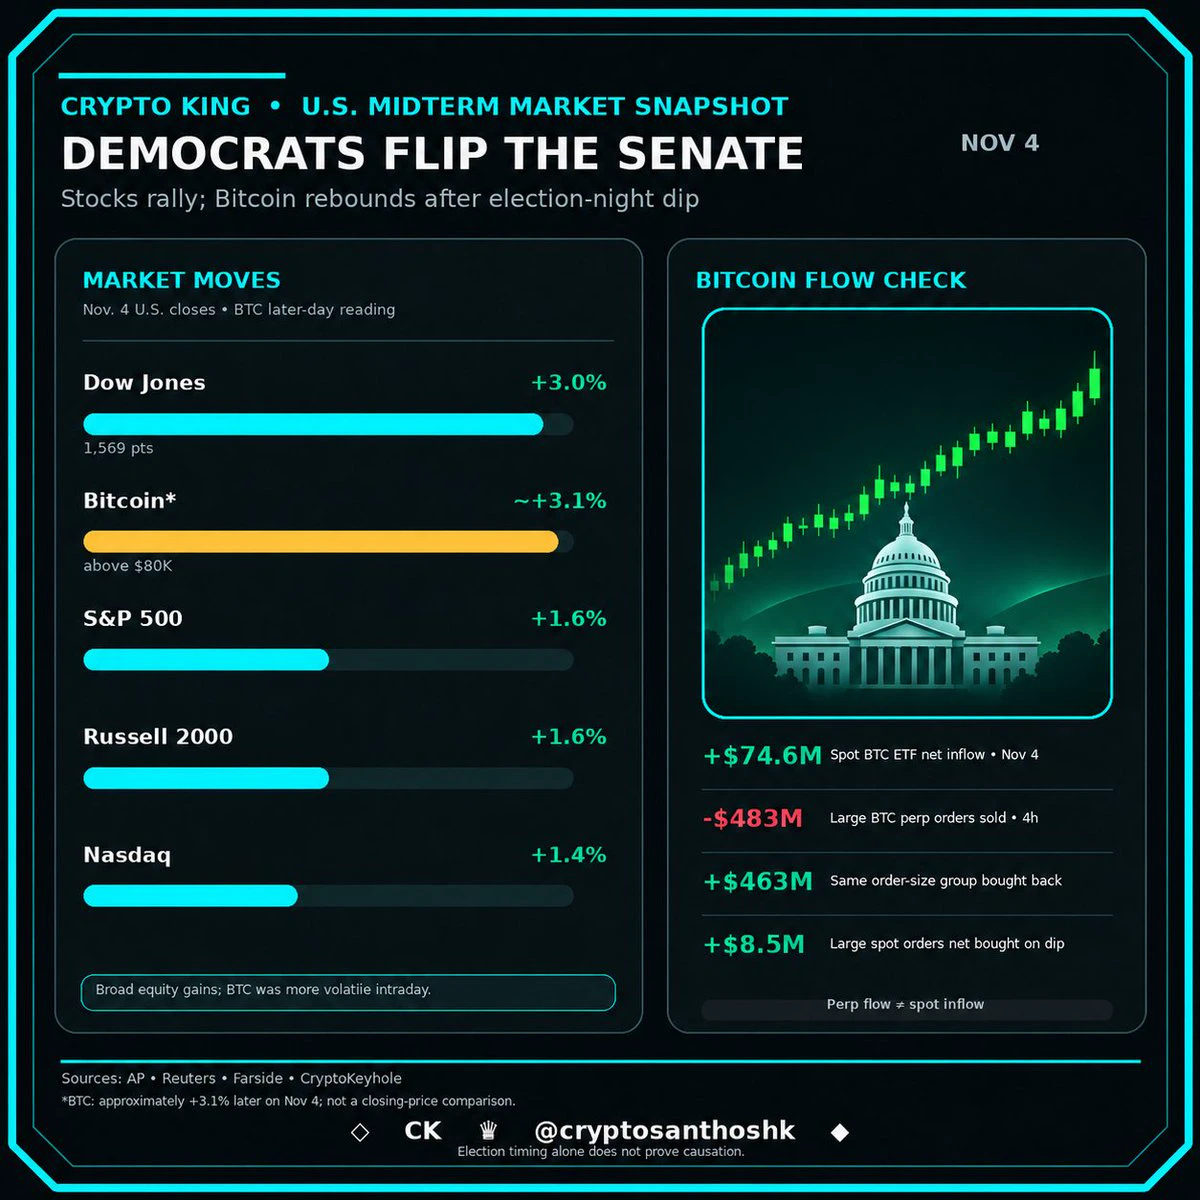
The results of democrats winning the senate elections?
Outcome is absolutely shocking. Here is how the markets reacted:
post-image
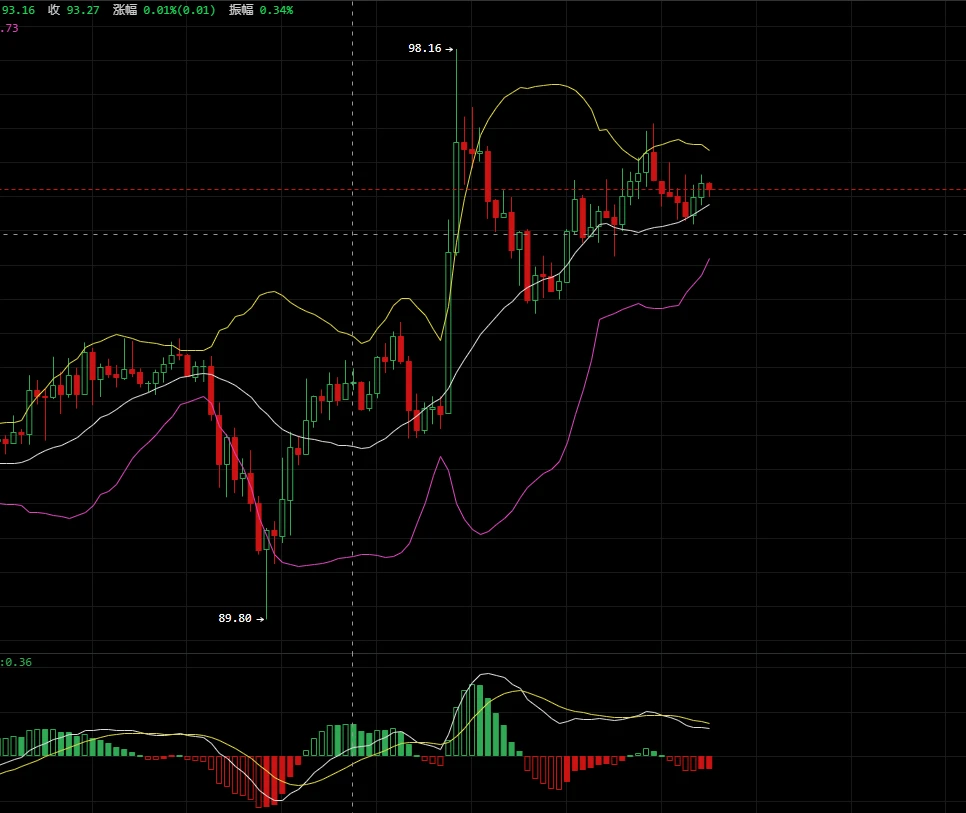
11.5 SOL Trading Plan
  SOL is in a consolidation phase within an overall uptrend. The Bollinger Bands remain open to the upside, signaling a bullish setup. The price has pulled back to near the middle band and stabilized. Key support is at 95.5, with strong support at 94.4. A break below 93.7 would invalidate the bullish structure. The first resistance is the consolidation range at 97.2-97.5, with strong resistance near the previous high of 98.16. A breakout could pave the way for a further move toward the 99.5-100 round-number level.
  Entry zone: Go long near 95.5 (middle Bollinger Band + s
post-image
SOL-0.74%
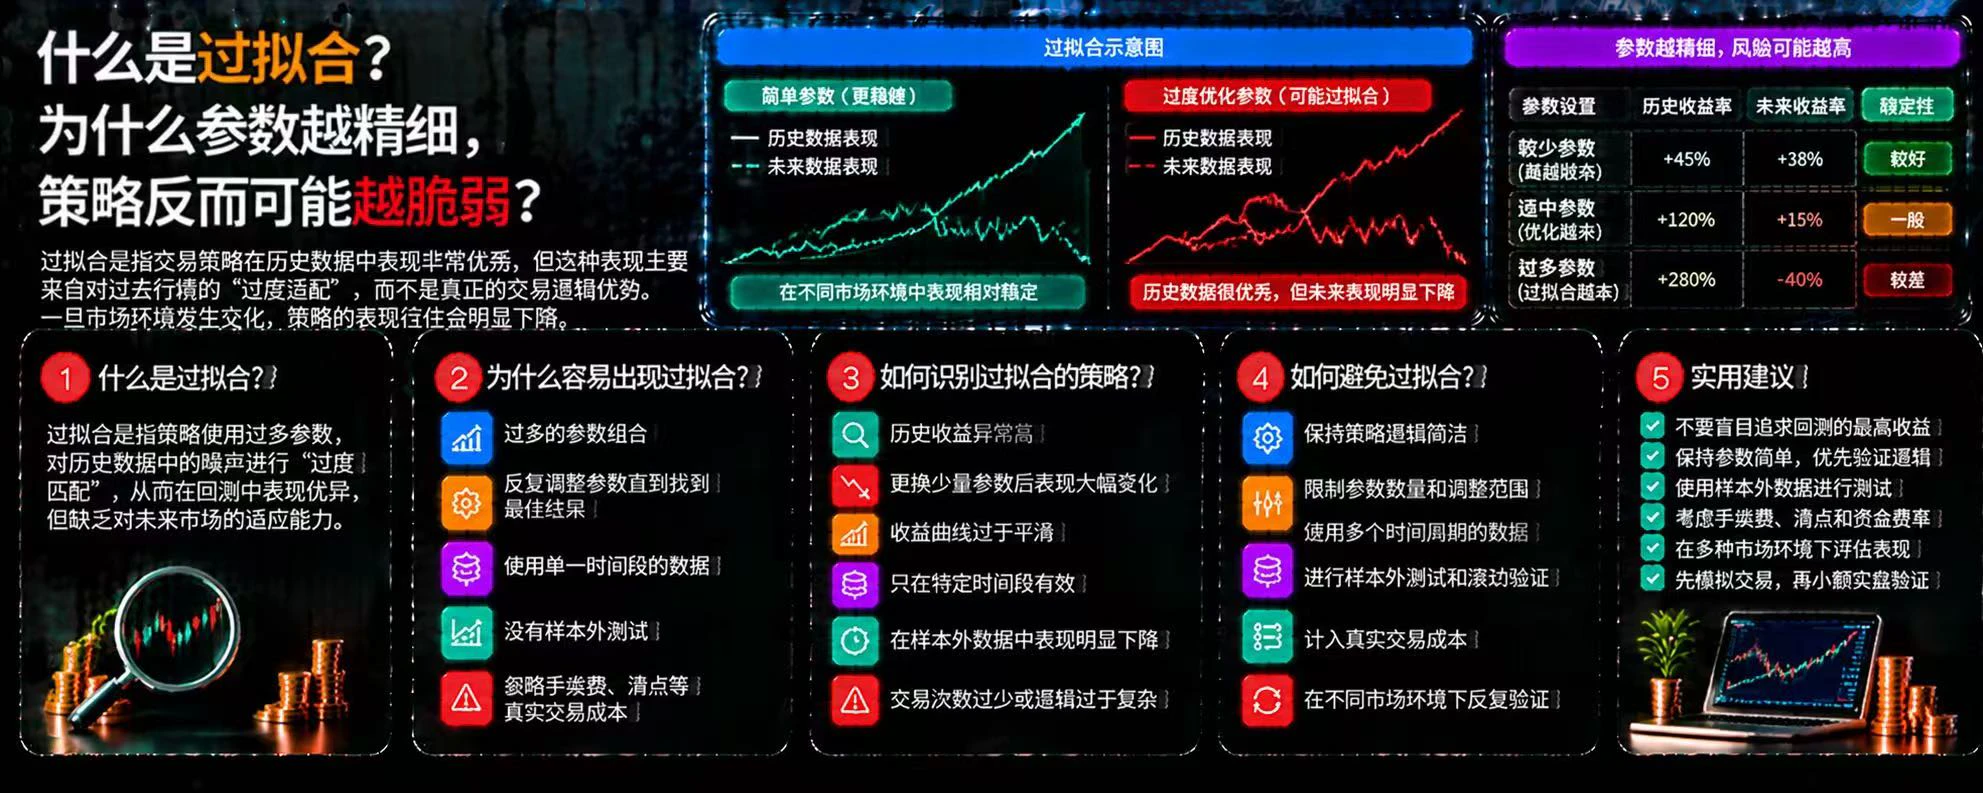
What Is Overfitting? Why Can More Fine-Tuned Parameters Make a Strategy More Fragile?
In cryptocurrency trading, some strategies show increasingly high historical returns and increasingly attractive backtest curves after repeated parameter adjustments. However, once they enter the real market, their performance may deteriorate rapidly. A common reason behind this is overfitting.
First, what is overfitting?
Overfitting occurs when a strategy adapts too closely to specific fluctuations and coincidental patterns in historical data, causing it to perform well in the past but lack the ability to ad
post-image
📡 Live signal card | Reposted—don't chase
Source: BlockchainBaller Asset: $PONS Direction: Short Entry: 0.225 Targets: 0.217 / 0.21 / 0.204 Stop-loss: 0.2355 Time: Not specified
Sis is just reposting this exactly as is; I haven't changed a single character. Whether to follow and how much to put in is up to you, babes. It's your wallet, and your hands should be your own too 👀 Personal records shared; not investment advice. #US stocks' AI sector diverges: cloud service providers gain while data center stocks come under pressure
PONS+4.32%
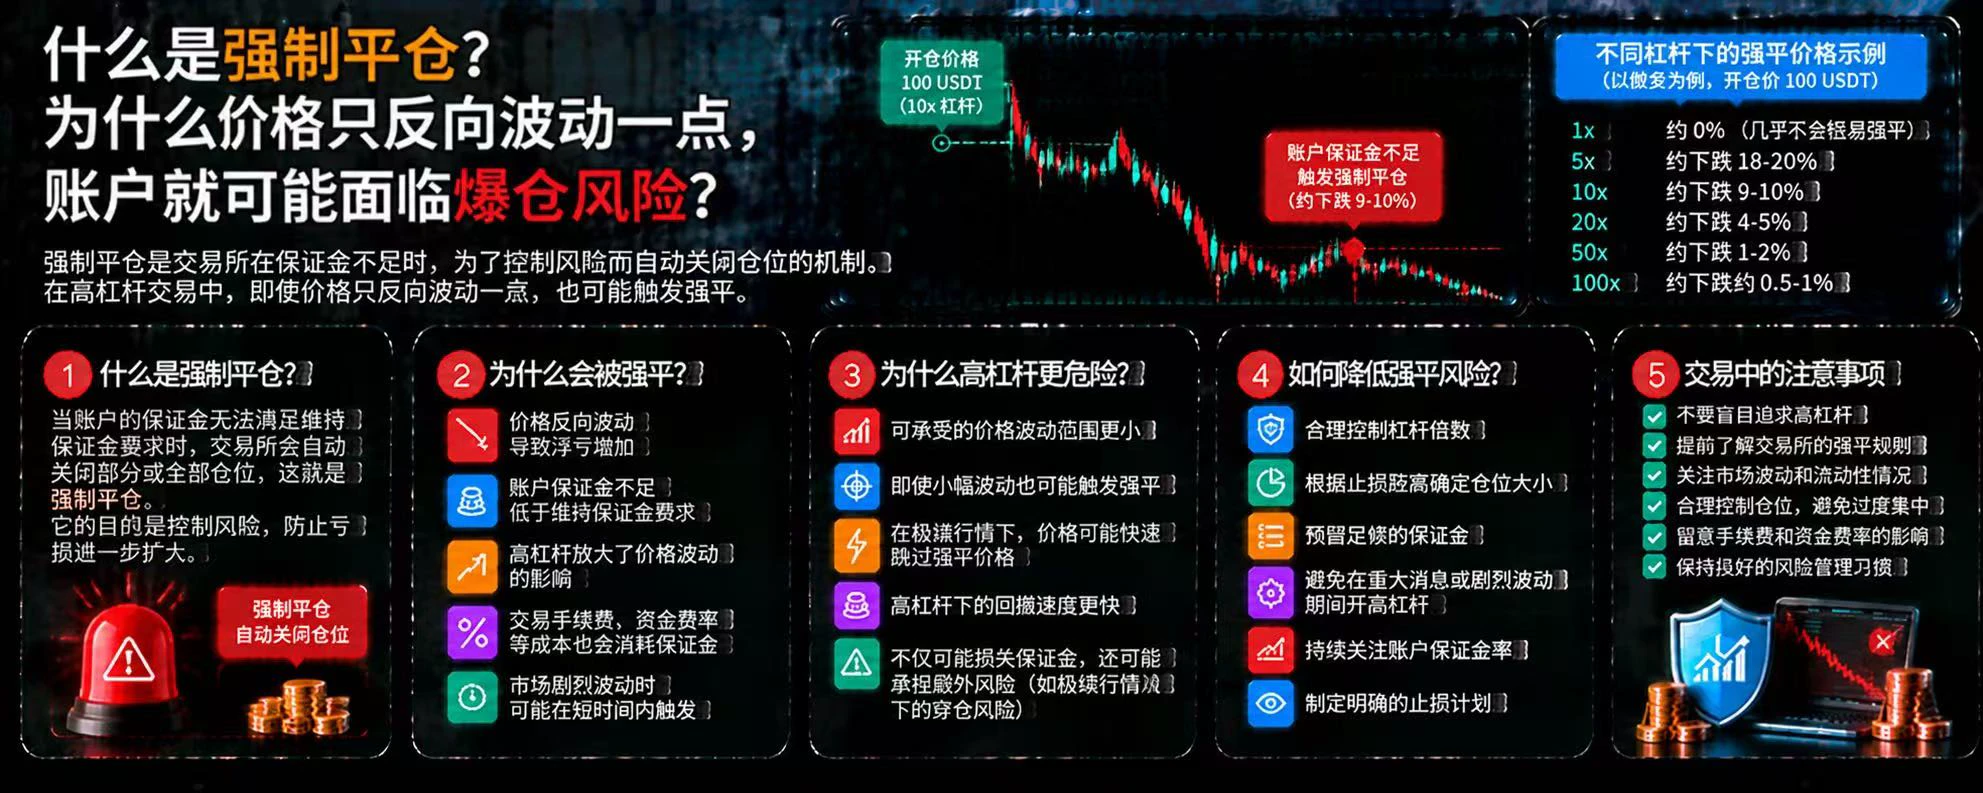
What Is Forced Liquidation? Why Can a Small Move in the Opposite Direction Put an Account at Risk of Liquidation?
In crypto futures trading, many traders focus on how much the price can rise, but overlook how much of a move in the opposite direction their account can withstand. When margin is insufficient to meet the exchange’s maintenance margin requirements, the platform may automatically close part or all of a position. This is forced liquidation.
First, why does forced liquidation happen?
After a position is opened, a price move in the opposite direction causes unrealized losses, reducing
post-image
I just started driving and found this thing. What should I do?
#WCTCS9 #$DOGE
Dogecoin is trading near 0.07527 USDT in the latest Gate spot snapshot, taken at about 09:00 UTC on November 4, 2026. Over the last 24 hours the price is up about 2.03%, and the intraday range runs from 0.07230 to 0.07573, a swing of roughly 4.7%. Over seven days DOGE is down about 4.89%, and it sits about 28.9% below its September 22 intraday high of 0.10589. Market capitalization is about 12.59 billion USD, and reported 24-hour volume is about 275.1 million USD. The short-term picture is weak but not broken. The higher timeframes still show a descending structure, and the nex
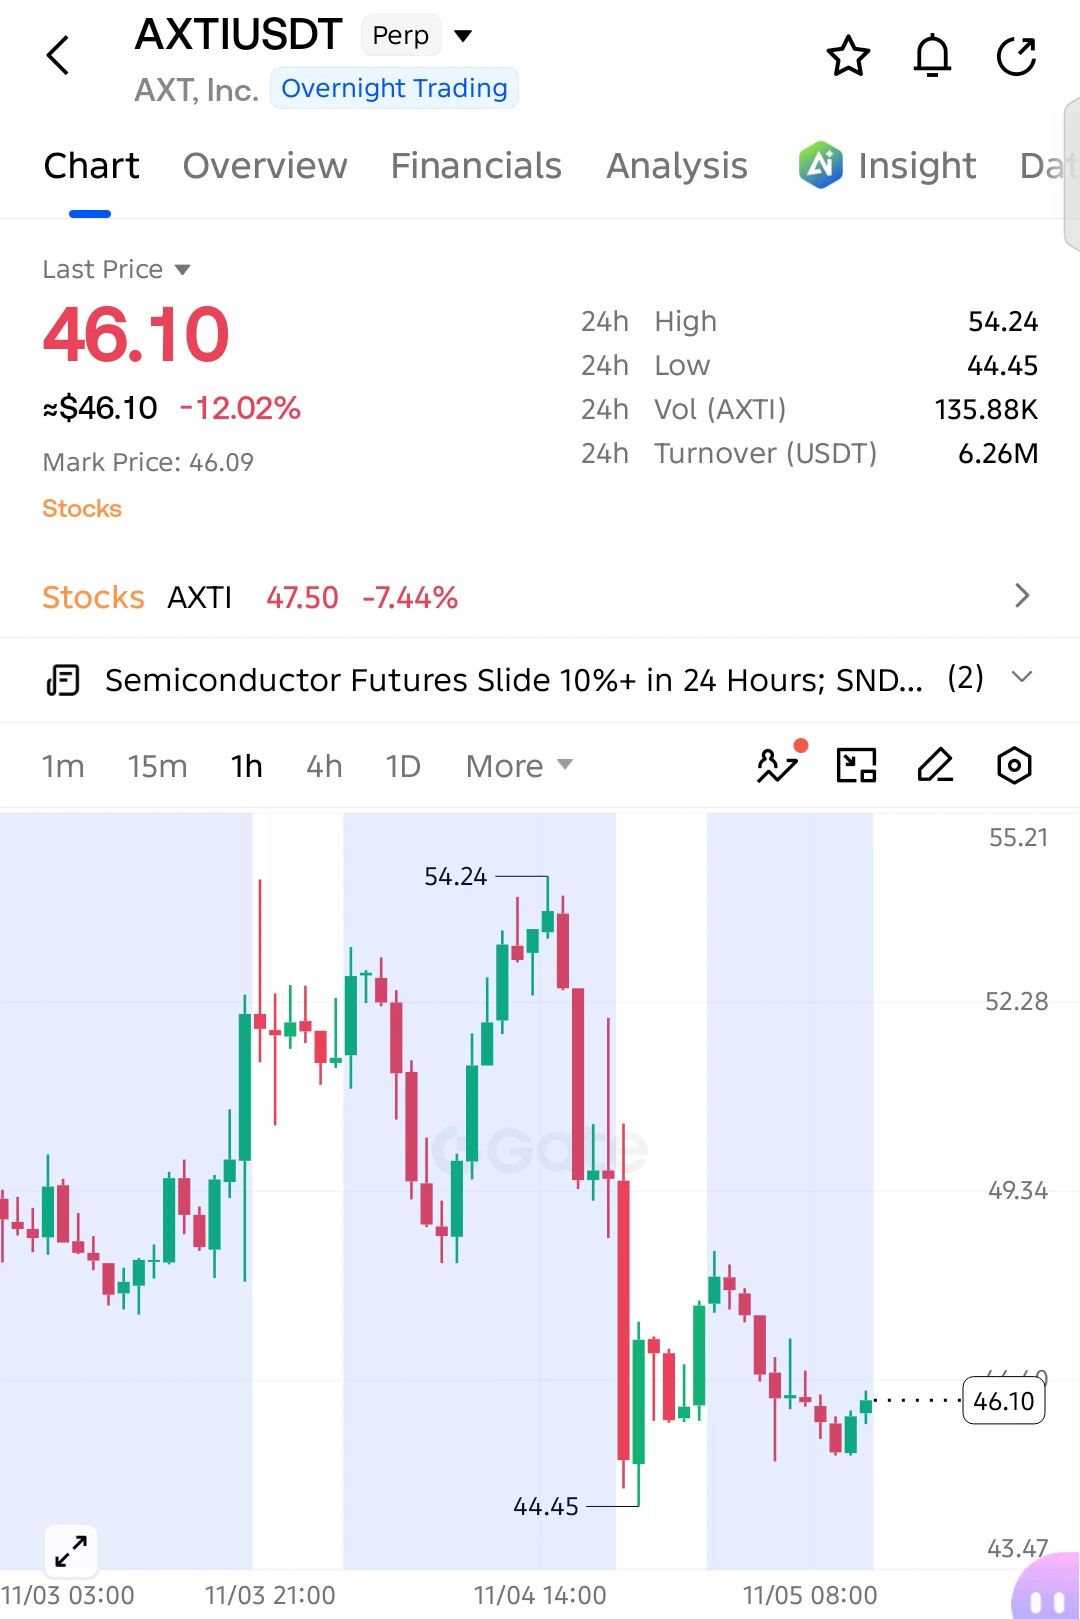
$AXTI SHORT SETUP — SELLERS STILL IN CONTROL!
$AXTI is down 12%, and the chart continues to show bearish pressure after a sharp rejection from 54.24.
Entry: 46.10
SL: 47.30
TP1: 45.30
TP2: 44.45
TP3: 43.50
Final Target: 42.00
The recent bounce looks weak, with sellers maintaining control below 47.30. Another rejection could push the price back toward 44.45, with further downside possible if that support breaks.
Invalidation: A sustained move above 47.30 weakens the bearish setup.
post-image
AXTI-7.44%
  • 4
  • 1
Listen, guys‼️ $TRUMP —will it keep falling or rebound to $2?? I think $TRUMP could recover, with the next target at $1.50, followed by $2. Do you agree? What do you think? Entry price: $1.267 – $1.272 Target price: $1.350 / $1.500 / $2.000 Stop loss: $1.200
post-image
TRUMP-0.95%
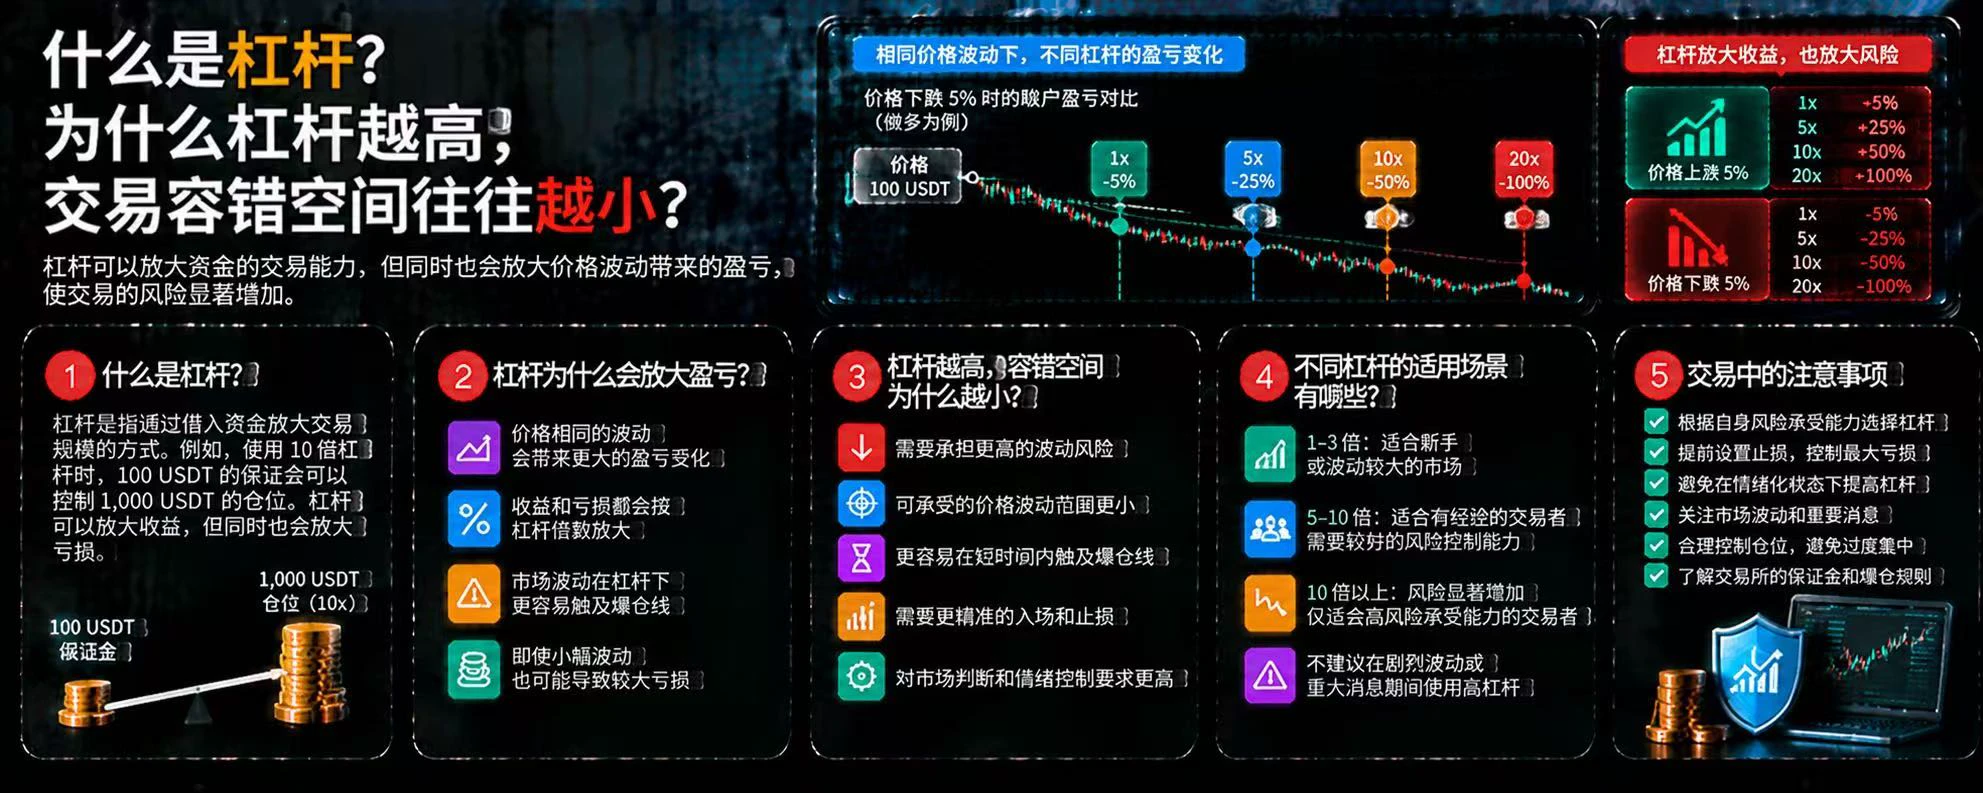
What is leverage? Why does higher leverage often mean less room for error?
In cryptocurrency trading, leverage allows traders to control larger positions with less margin, but it does not make market risk disappear. On the contrary, the higher the leverage, the greater the impact that a price move of the same magnitude usually has on margin.
First, what is leverage?
Leverage is a way to control a larger trading position using margin. For example, ignoring other factors, 10x leverage lets you open a notional position of about 1,000 USDT with 100 USDT of margin. But this does not mean your actua
post-image
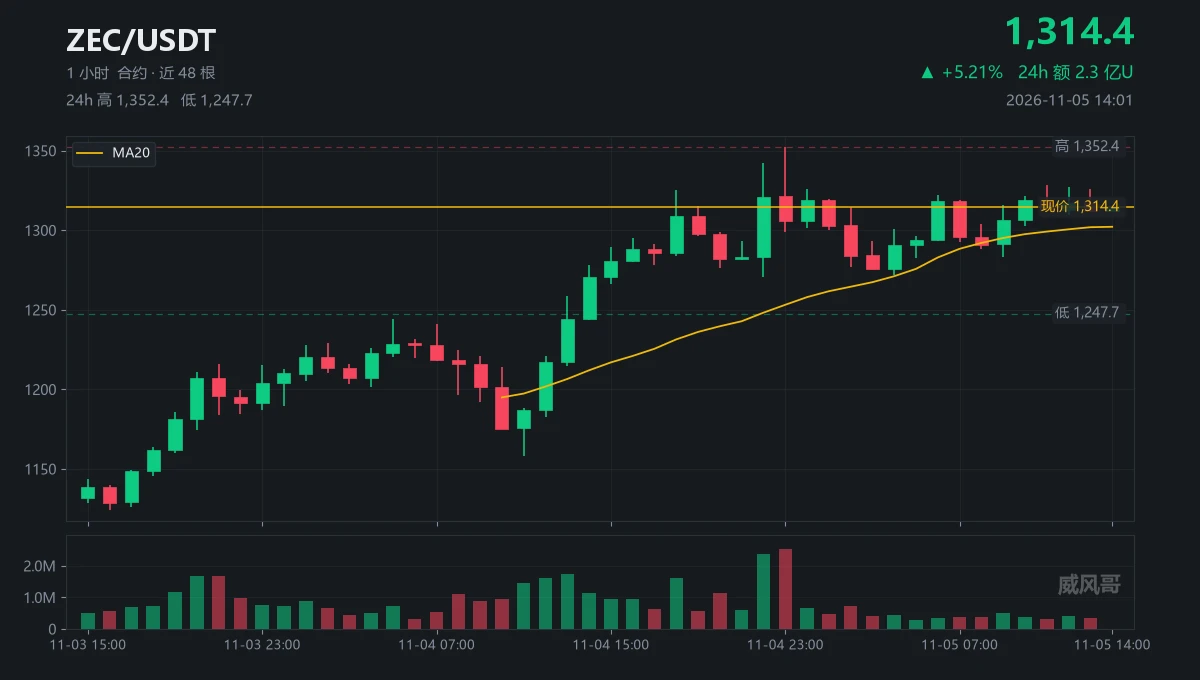
In a long position, the 2.51 million-contract bar overhead is what scares me most.
Breaking it down: it climbed from 1321 to 1352.4, then closed at 1305.85.
Its shadow is still hanging overhead; it hasn’t faded.
In a short position, I’m worried that the 1271 level has held firm despite being hit three times.
Breaking it down further: 1270.93, 1272.07, 1275.01—each one higher than the last.
Bulls need to wait for 1330 to hold; bears need to wait for 1271 to break.
Those two levels are $59 apart, and neither has been reached first, so we’re stuck.
MA20 is 1302.18; the price is $14 above it, but
post-image
ZEC+1.29%
  • 8
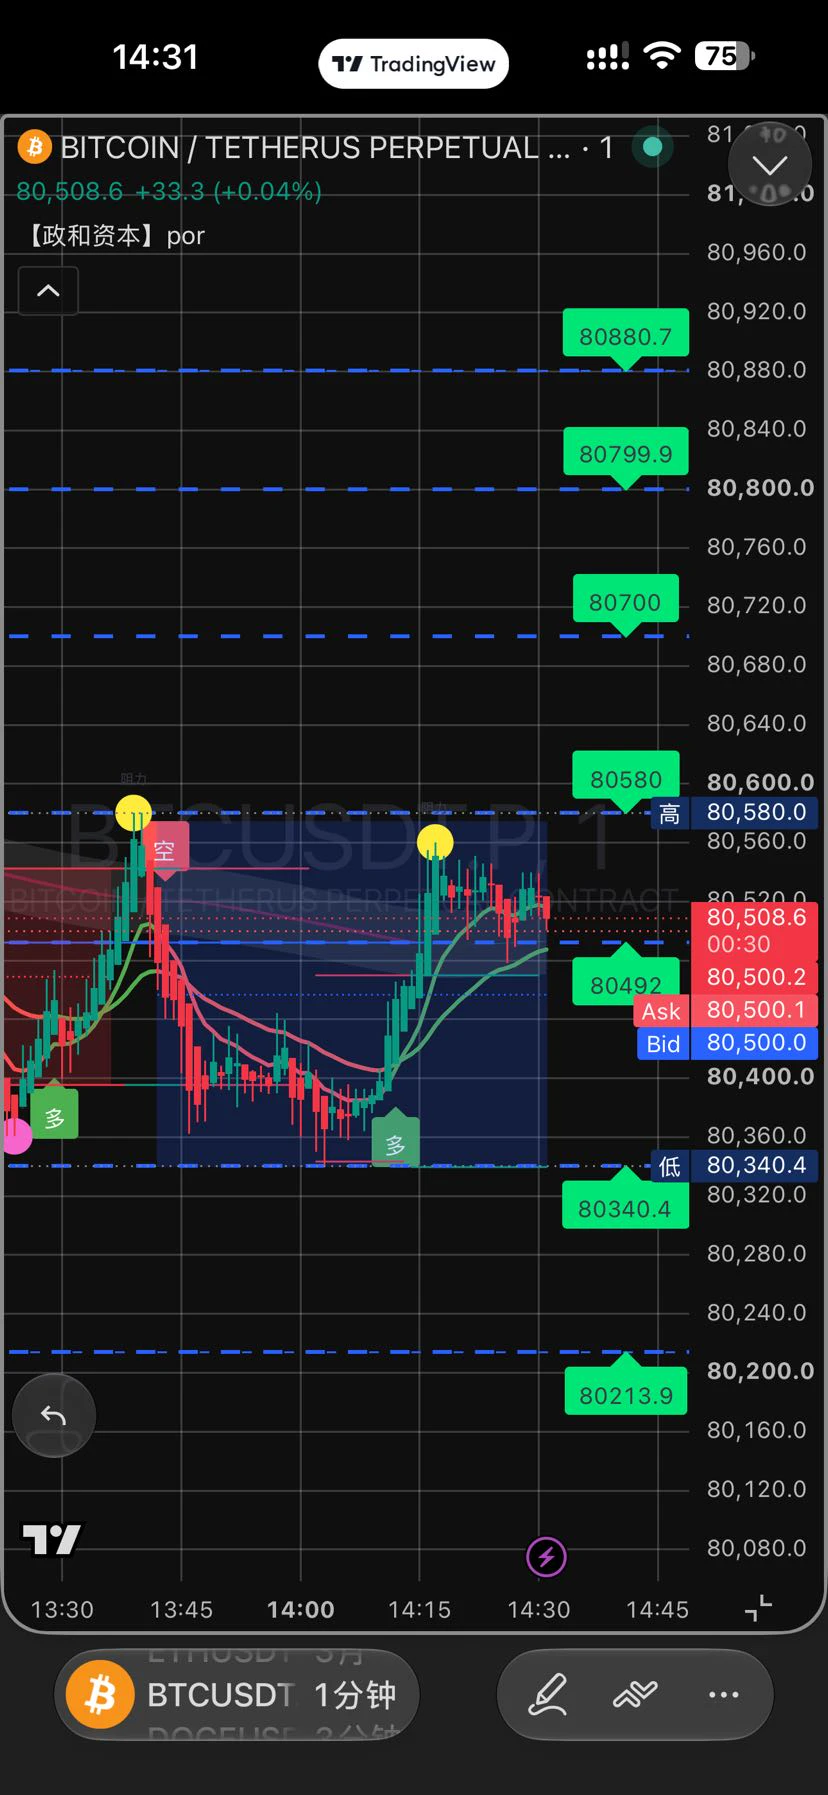
November 5, 2026 (Thursday) BTC Futures Strategy for Today (reference current range: approximately $80,200–$80,600)
Core view (neutral to slightly bullish, cautious after the rebound)
BTC rapidly rebounded from around $75,700 at the lows to above $80,400, moving back above some short- and medium-term moving averages, but daily momentum has not yet fully confirmed a shift to strength. Today, prioritize watching for a failure to gain further at higher levels as a short opportunity, or consider going long only after a pullback to support. Keep positions small.
Specific strategy directions
1. Shor
post-image
BTC-0.65%
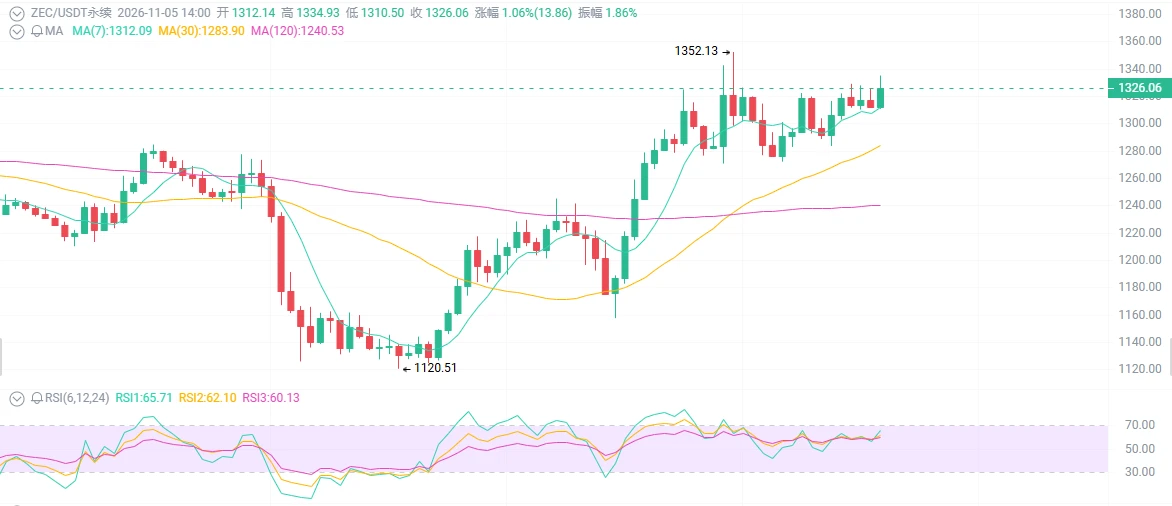
ZEC at $1325—are you chasing it?
ZEC surged from 1110 to 1325 in three days. The NU7 upgrade goes live today, but funding rates have already turned positive and longs are starting to pay to hold positions—is this the start of privacy coins’ main rally, or the final pump before the upgrade goes live and sellers cash out?
First, the surface picture: catalysts are piling up and the price is strong, but people chasing the rally are already getting nervous.
ZEC has risen more than 150% over the past 3 months, surging from its lows to around 1690, then bouncing back to 1325 after pulling back to 111
post-image
BTC-0.67%
ETH-1.26%
ZEC+1.16%
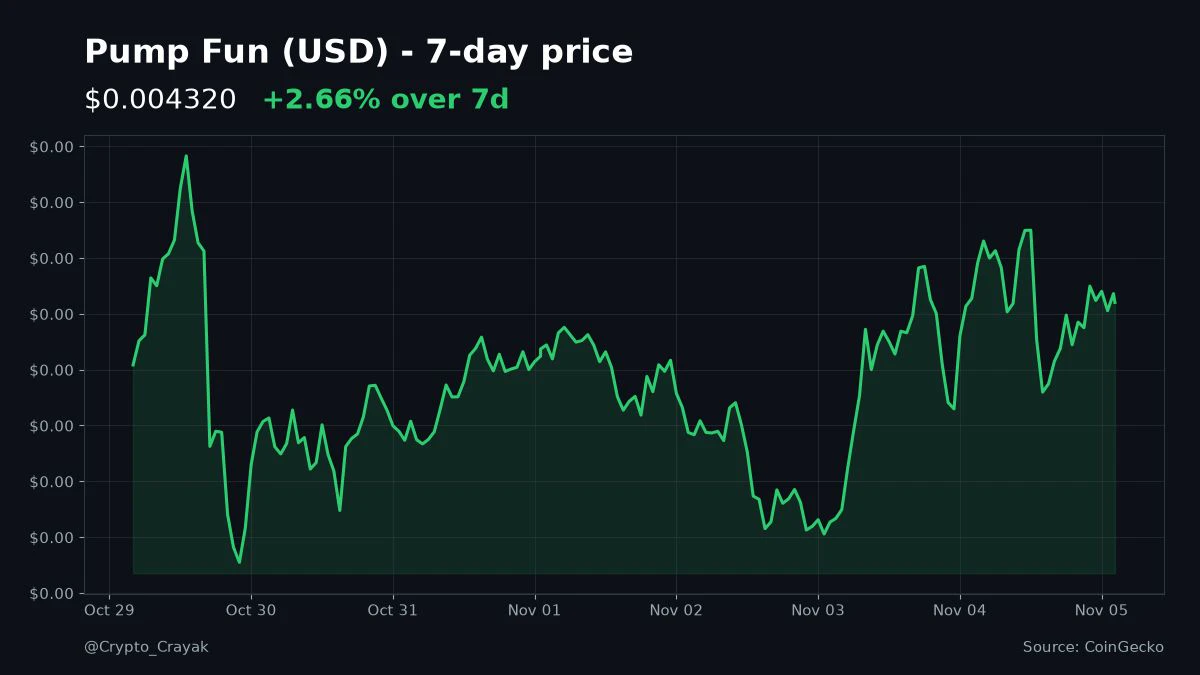
$PUMP is hanging around $0.0043 tonight, up a couple percent on the week after that dip near $0.0039.
Meanwhile @Pumpfun still burned about 109M tokens yesterday. Quiet candle, busy burn. You watching the chart or the buybacks? #Solana
post-image
PUMP-1.06%
SOL-0.77%
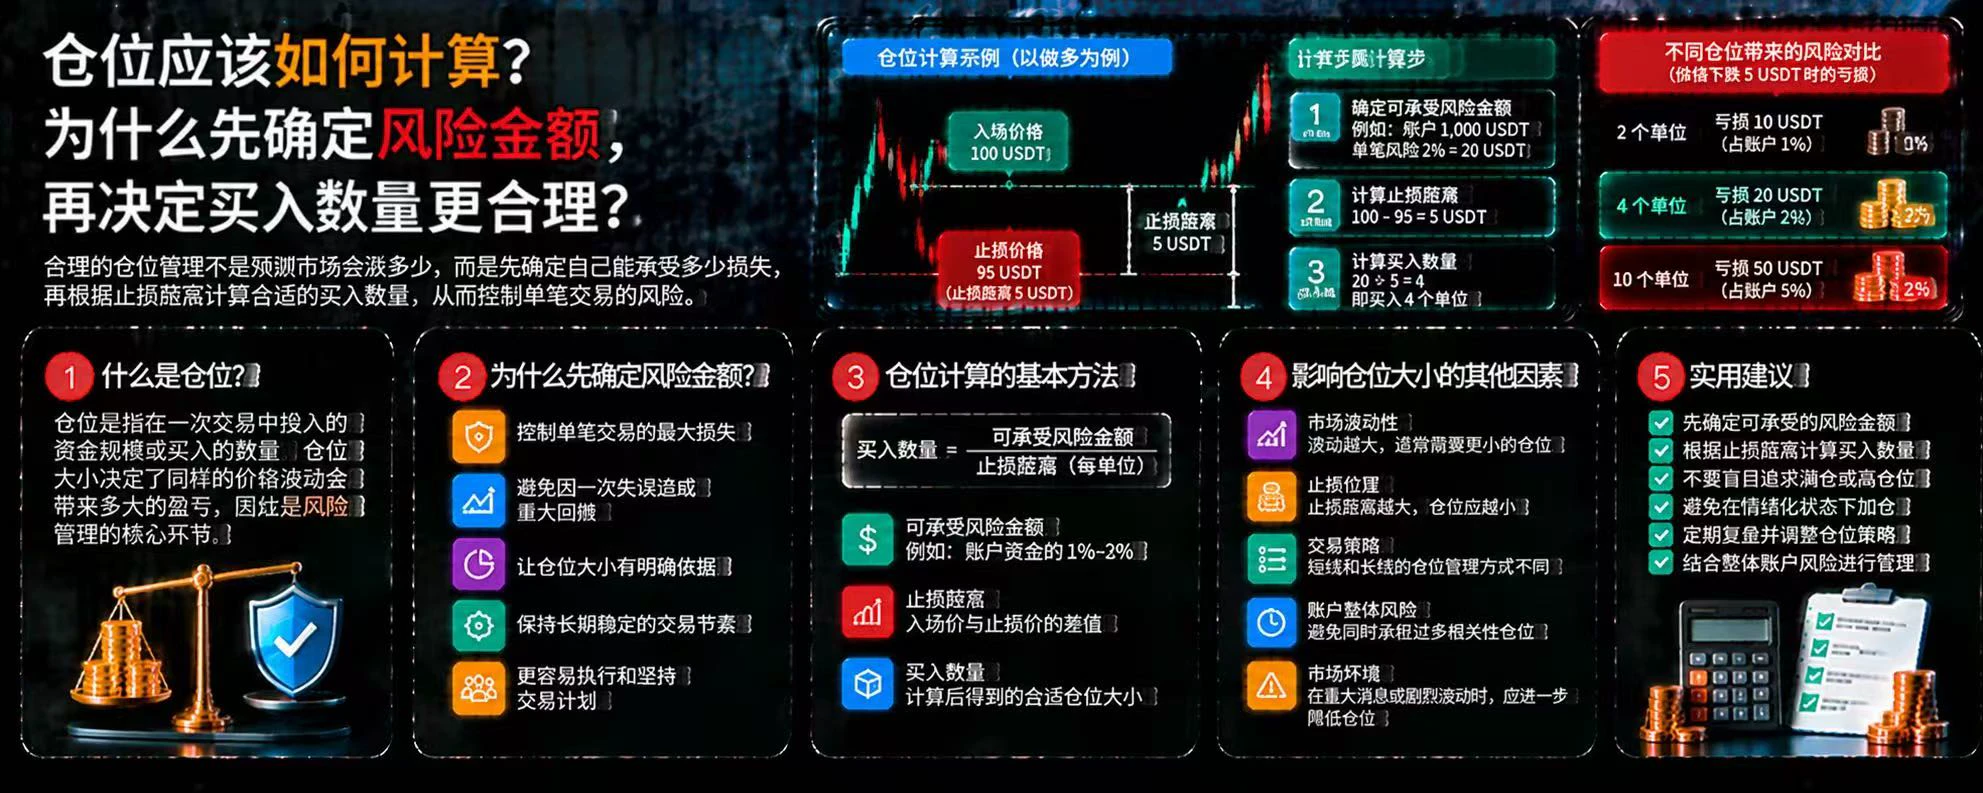
How should position size be calculated? Why is it more reasonable to determine the risk amount first and then decide how much to buy?
In cryptocurrency trading, many people tend to assess the market first and then decide how much to buy, overlooking the most important step: if their judgment is wrong, how much of a loss can they actually afford to take? Sound position management should start with a risk budget, not potential returns.
First, determine the risk amount you can afford.
Suppose you have 1,000 USDT in your account and plan to limit the risk on a single trade to 1% of your account ba
post-image
🔹Chip Stocks Are Falling, but Demand Hasnt Weakened? With Democratic Regulatory Expectations Shakin
live-cover
LIVE2,520
[ ETH MARKET ]
live-cover
LIVE1,913
Load More

Join 40 M users in our growing community

⚡️ Join 40 M users in the crypto craze discussion

💬 Engage with your favorite top creators

👍 See what interests you

Trending Topics

GateLaunchesPoSECProofOfSecurity

26 Views438 Discussing

Gate has officially launched Proof of Security, or PoSEC, extending beyond Proof of Reserves by disclosing the distribution of cold-storage and hot-wallet assets and introducing a cold storage coverage ratio to measure protection under extreme-risk scenarios. Gate’s latest cold storage coverage ratio stands at 104.58%, with 88.26% of assets in cold storage and 11.74% in hot wallets. A coverage ratio of at least 100% means cold-storage assets alone would still be sufficient to cover all user assets even if hot-wallet assets were fully lost. Exchange security is not only about whether reserves are sufficient, but also how assets are stored and protected under extreme conditions. Could cold storage coverage become a new industry standard?[👉 Learn more](https://gate.com/proof-of-security)

BTCBackAbove80K

39.7k Views41.25k Discussing

DemocratsWinBothChambers

19.22k Views453 Discussing

View More