

Square
Following
Hot
News
Notifications
Profile
Share your thoughts
placeholder
Article
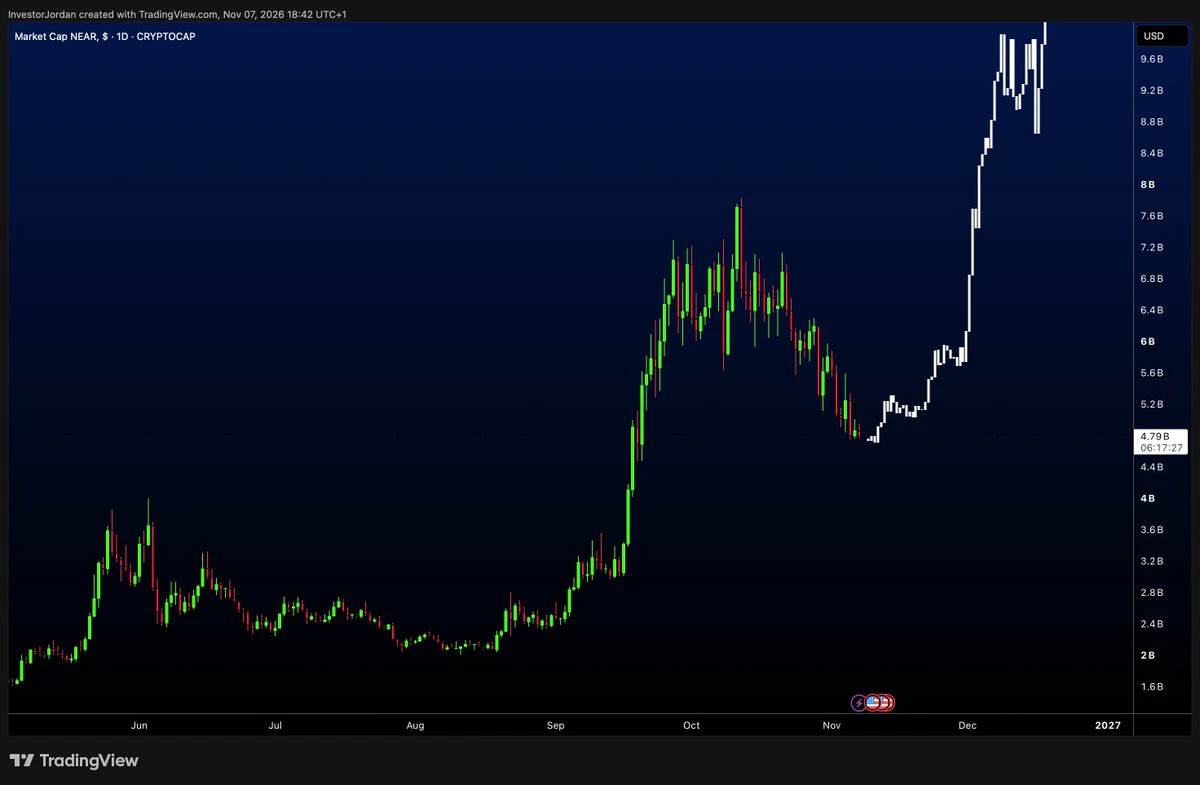
$NEAR 🧠
It's giving $ZEC before it exploded from $500 to $1700 vibes.
Both rallied hard, stalled and then continued running once the market recovered.
Time for @NEARProtocol to chase double digits 🚀
post-image
ZEC+1.16%
  • 1
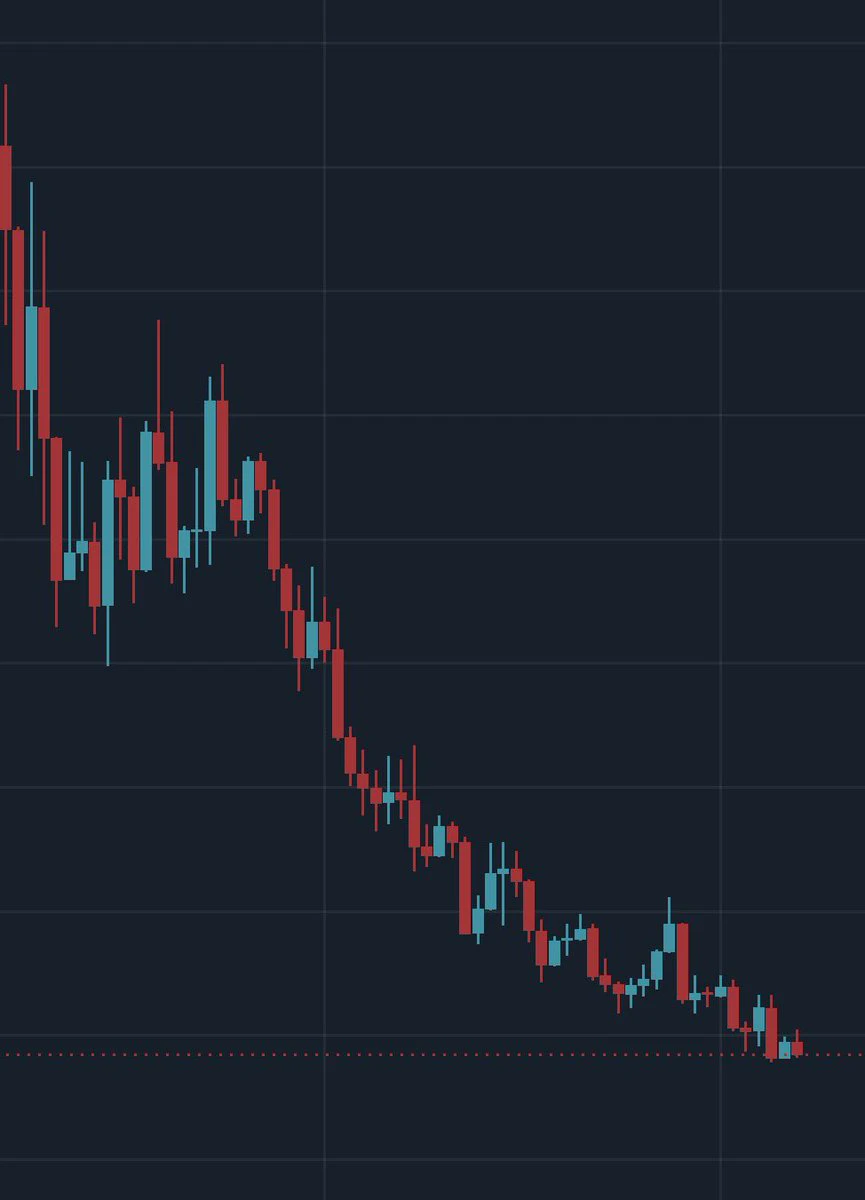
I just added another entry trade on $IDOL targeting 0.0305-0.0270
post-image
IDOL-6.71%
Trenches
ZIG
Z
bade
b
ZIG
0x8c...1145
Market Cap
$.
Change
.
24h Vol
$.
Holders
.
BTC
B
bade
b
BTC
C5xp...pump
Market Cap
$.
Change
.
24h Vol
$.
Holders
.
José
J
bade
b
José
87CQ...1UJT
Market Cap
$.
Change
.
24h Vol
$.
Holders
.
STONK
S
bade
b
STONK
6GmA...UNgx
Market Cap
$.
Change
.
24h Vol
$.
Holders
.
IDOL
I
bade
b
IDOL
0x3b...ab07
Market Cap
$.
Change
.
24h Vol
$.
Holders
.
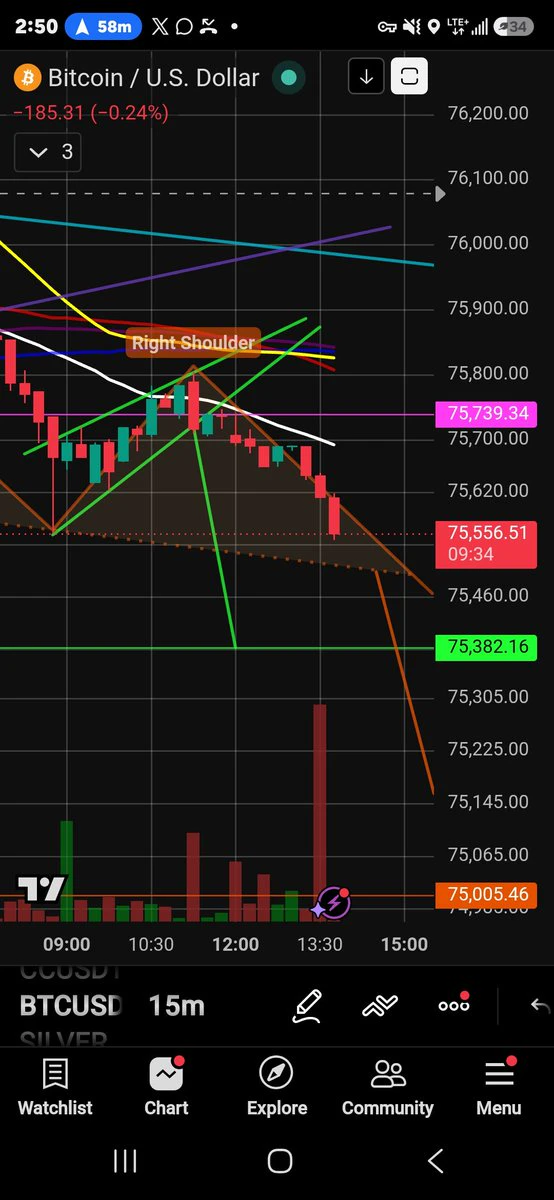
$BTC 1st Short-Term Target Hit! 💥🎯
post-image
BTC-0.67%
I woke up shivering.
I keep coughing and have a runny nose.
I'm still cold even under two duvets.
What's happening to me?
post-image
BTC ETH MARKET PREDICTION
live-cover
LIVE44
$LYN It surged to 0.0313 within 24 hours, then got slammed back to 0.0258. That spike has the accounts of anyone who chased the top smoking. The 9.98% gain looks cheerful, but the intraday range hit 41%. What does the 85.6M in trading volume tell us? The big players distributed some tokens above 0.03, and now the price is stuck in the middle, with both bulls and bears testing the waters.
I checked the on-chain data: open interest in futures surged before this rally—a classic leverage-driven move, not one built on spot buying. What is this structure most vulnerable to? Hawkish Fed minutes. Last
LYN-0.44%
BTC-0.67%
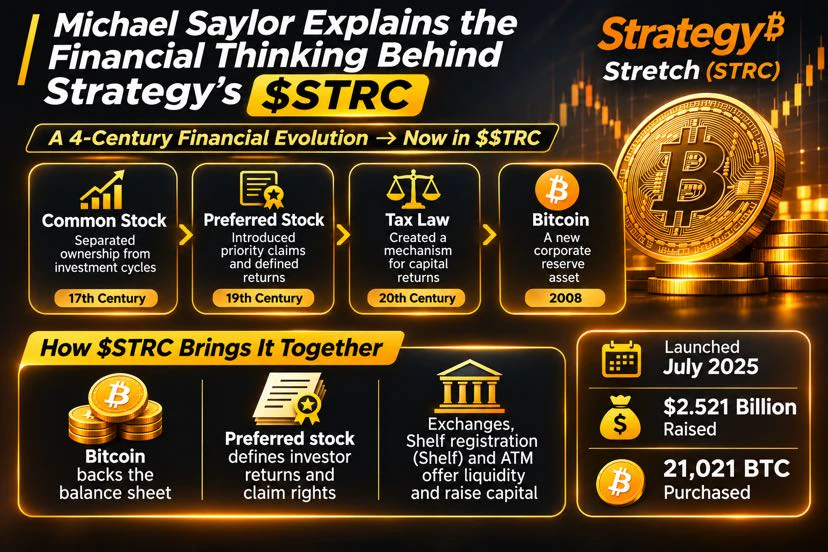
Michael Saylor Explains the Financial Thinking Behind Strategy’s $STRC

Michael Saylor is connecting four centuries of financial evolution to Strategy’s digital credit product, Stretch ($STRC).

His argument is that each stage introduced something new to financial markets:

* Common stock separated ownership from investment.
* Preferred stock introduced priority claims and defined returns.
* Tax rules created ways to structure capital returns.
* Bitcoin introduced a new type of corporate reserve asset.

STRC brings these ideas together.

Bitcoin supports Strategy’s balance sheet, preferred sto
post-image
STRC+0.34%
BTC-0.67%
$ONE Is Trending — But Is the Move Sustainable?

Harmony ($ONE) is gaining momentum with rising trading activity, but without a clear fundamental catalyst, the move still needs confirmation.

The key test comes after the hype fades.

Holding $0.00193 could keep the momentum intact. Losing it may open the door to profit-taking.

The breakout gets attention. Follow-through proves demand.

Is $ONE starting a real reversal, or is this just short-term momentum?

#ONE #Harmony #Gateio #CryptoAnalysis
post-image
ONE-1.19%
BULLS ARE TRAPPED $XRP USDT SHORT SETUP IS READY TO GO

$XRP /USDT

Trade Direction: SHORT

Entry Range: 1.1612

Take-Profit Levels:
🔹 TP1: 1.1462
🔹 TP2: 1.1362
🔹 TP3: 1.1212

🛑 Stop-Loss: 1.1812

$XRP ‌
XRP-1.12%
AVAX is continuing to fall; bears are firmly in control as the price slides toward the intraday low. Shorting strategy on $AVAX . Entry range: 8.214 - 8.255 Take-profit 1: 7.834 | Take-profit 2: 7.514 Stop-loss: 8.503 Caution: If selling volume dries up, the price may rebound from the intraday low of 8.1740. Don’t go all in, friend. Keep your position size appropriate for your account.
post-image
AVAX-0.10%
$PUMP 's upward momentum is clearly fading. This current rebound looks more like a bull trap during a continuing downtrend than a signal of a trend reversal.

My plan is to open a short on $PUMP : Entry range: 0.003696 - 0.003750 Take-profit targets: 0.003559 - 0.003428 Stop-loss: 0.003863
Pay special attention: if the price climbs back above 0.00372 on rising volume, a short squeeze could be triggered at any moment, and the market could become extremely volatile.
Don't get carried away with position sizing, brother—manage your exposure based on what your account can actually handle, and don't
post-image
PUMP-0.99%
Robinhood chain visualized
post-image
HOOD+4.25%
Short $XRP at the 4-hour resistance. 1.16 holds, next target 1.15. If it breaks above 1.17, I’ll abandon this setup. - Price 1.16, below the 4-hour EMA50 (1.24); sellers still control the trend - Stop-loss risk 0.77%, TP3 return 1.2%; if TP3 is reached, the risk/reward ratio is 1.6R Entry: 1.161–1.163 (short) Targets: 1.157 → 1.153 → 1.148 Invalidation: 1.171 Not investment advice · Do your own research
post-image
XRP-1.15%
The herd stuck in the old easy market days
Those days are far behind us
In the past I've explained how u only get a small window of a gold rush during a market mania phase
The bubble burst in 2024 with KOLs reaching max extraction
Markets only get harder with saturation
-Reaper
post-image
$XRP On the 4-hour chart, bears are still firmly in control, with the price stuck near 1.16 while the 4-hour EMA50 has slipped to 1.24; trading below the moving average indicates that sellers are still setting the pace. My plan is to open a short in the 4-hour resistance zone, with an entry range of 1.161–1.163. As long as 1.16 is not decisively broken, I’m looking at three successive targets below: 1.157, 1.153, and 1.148. I’ll set the stop-loss at 1.171; if the price breaks above 1.17, this bearish thesis is invalidated, and I’ll exit without hesitation. Based on the risk calculation, the s
post-image
XRP-1.15%
$ARX Down 10.68% in a day, with the current price at 0.2158—just a hair above the 24-hour low of 0.2143. This isn’t a pullback; the bulls’ defenses are being tested inch by inch. Trading volume of 3.4M suggests selling pressure isn’t particularly heavy; this looks more like a slippage-driven selloff in thin liquidity. If a candle body closes below 0.2143, there’s basically a vacuum below. My approach: don’t catch a falling knife. Wait for a high-volume, 1-hour candle showing the decline has stalled near 0.2143 before considering a small long position, capped at 5%, with a stop-loss at 0.2080 (
ARX-2.47%
The Stellar Development Foundation says $5B in tokenized real-world assets are now live on Stellar.
CEO Denelle Dixon:
"$5B is a huge number, and it's just a pit stop."
@StellarOrg @DenelleDixon
XLM-0.64%
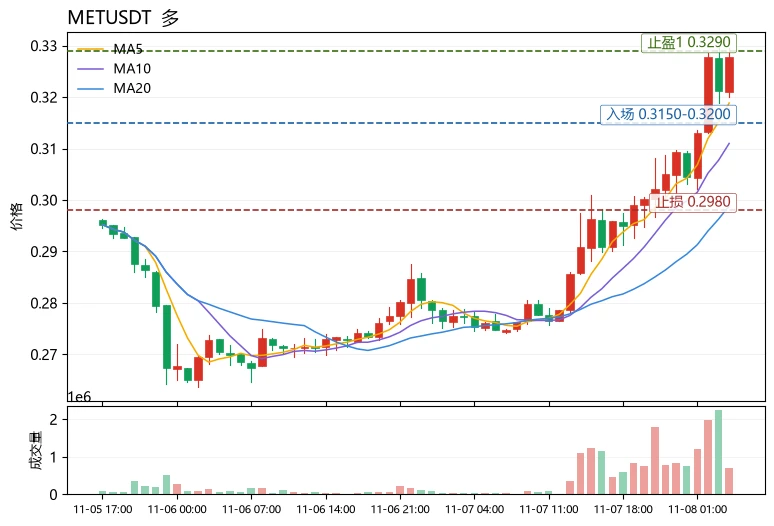
Fear and Greed Index at 25, in the extreme fear zone, while $MET rose 18.94% against the trend over 24h to 0.3278, with a trading volume of 5.2M USDT. This is a typical sentiment divergence signal: when the broader market is panicking, funds concentrate on going long in individual coins, often indicating that short-term momentum is real but fragile. Technically, MA5=0.31884 crossed above MA20=0.29885, and the MACD histogram at +0.002945 remains bullish, with the trend structure intact. However, RSI=74.7 has entered overbought territory, and the price of 0.3278 is nearing the Bollinger upper b
post-image
MET-0.33%
QNT+4.79%
HYPE+0.24%
crypto market update 🥰
live-cover
LIVE71
Load More

Join 40 M users in our growing community

⚡️ Join 40 M users in the crypto craze discussion

💬 Engage with your favorite top creators

👍 See what interests you

Trending Topics

USAIStocksHitHard

21.24k Views3.67k Discussing

U.S. stocks sold off sharply on Thursday, November 5 (UTC). The Nasdaq closed down around 5.5%, entering correction territory, while the Philadelphia Semiconductor Index plunged roughly 12%, with chip stocks including $NVDA and $AMD posting steep losses. Beyond profit-taking, investors are growing concerned about the pace of AI data center construction, capital spending, and future returns on investment. The key question now is whether the AI sector’s lofty growth expectations need to be repriced. Where do you think the next opportunities will emerge: chip stocks, tech giants, or other sectors?

USNonfarmPayrolls

34.98k Views4.34k Discussing

StakeOnLaunchpoolToShare450KVLX

10.25k Views828 Discussing

View More