Square
Following
Hot
News
Profile
Share your thoughts
placeholder
Article
Stonk eco woke up and said hello $stonk $nearkat
STONK+8.53%
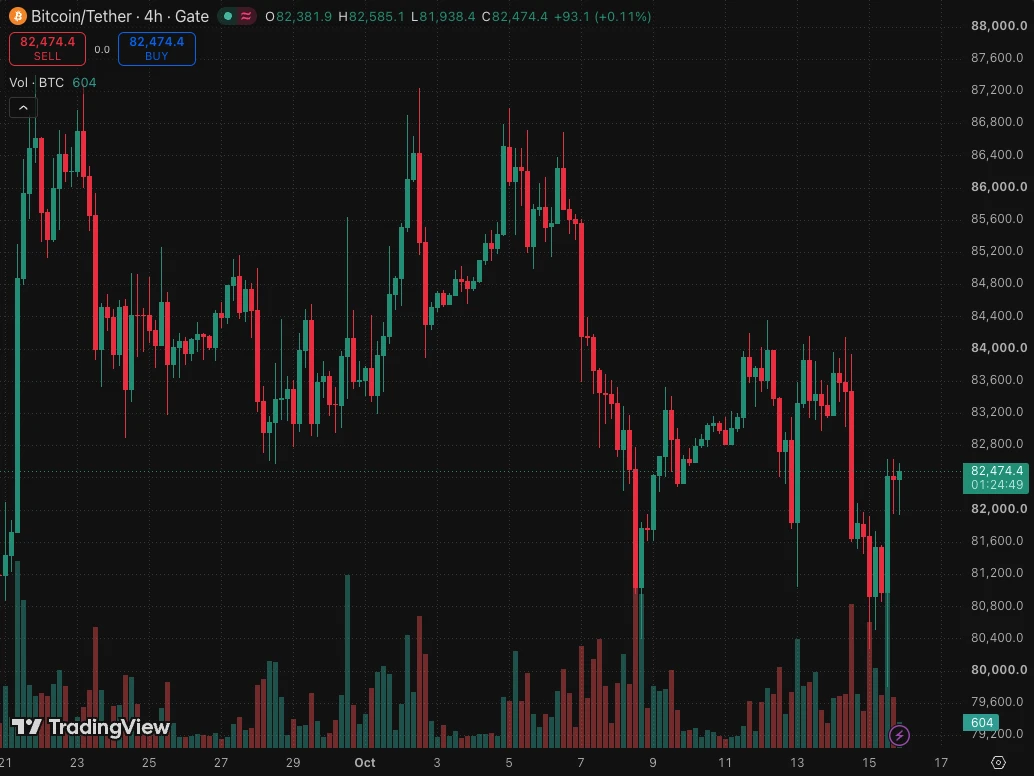
$BTC Bitcoin is bouncing after a sharp rejection
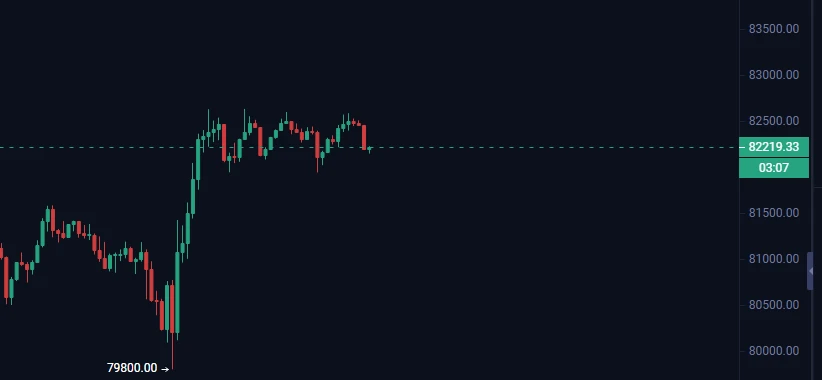
Bitcoin is bouncing after a sharp rejection and is trying to reclaim structure from the recent breakdown. Price has pushed back above the key support area near $81.6K, which is a positive short-term sign.
The main level to watch now is the $82.4K–$82.8K zone. That area is acting as resistance, and BTC still needs a clean break and hold above it to confirm stronger upside momentum. If that happens, the next move could target the higher resistance region around $83.6K+.
On the downside, if BTC loses $81.6K again, the bounce could fail and price ma
post-image
BTC+0.62%
Last night, Bitcoin first broke below the 80,000 mark, dipping to around 79,700 before rebounding quickly and rising all the way to around 82,700, with a one-way surge of nearly 3,000 points. After taking profit on the 80,800 short position we entered last night at 80,000, we reversed into a long and captured nearly another 1,000 points. The price is currently trading around 82,100.
The market is currently facing clear pressure. Selling pressure is heavy in the 82,500–83,000 area, and multiple rebound attempts have failed to break through effectively, indicating limited bullish momentum. Altho
BTC+0.62%
crypto market update
live-cover
LIVE2,004
BREAKING: Google reduces quantum computing errors by 40x using magic state cultivation on its Willow processor, published in Science.
post-image
GOOGL+0.37%
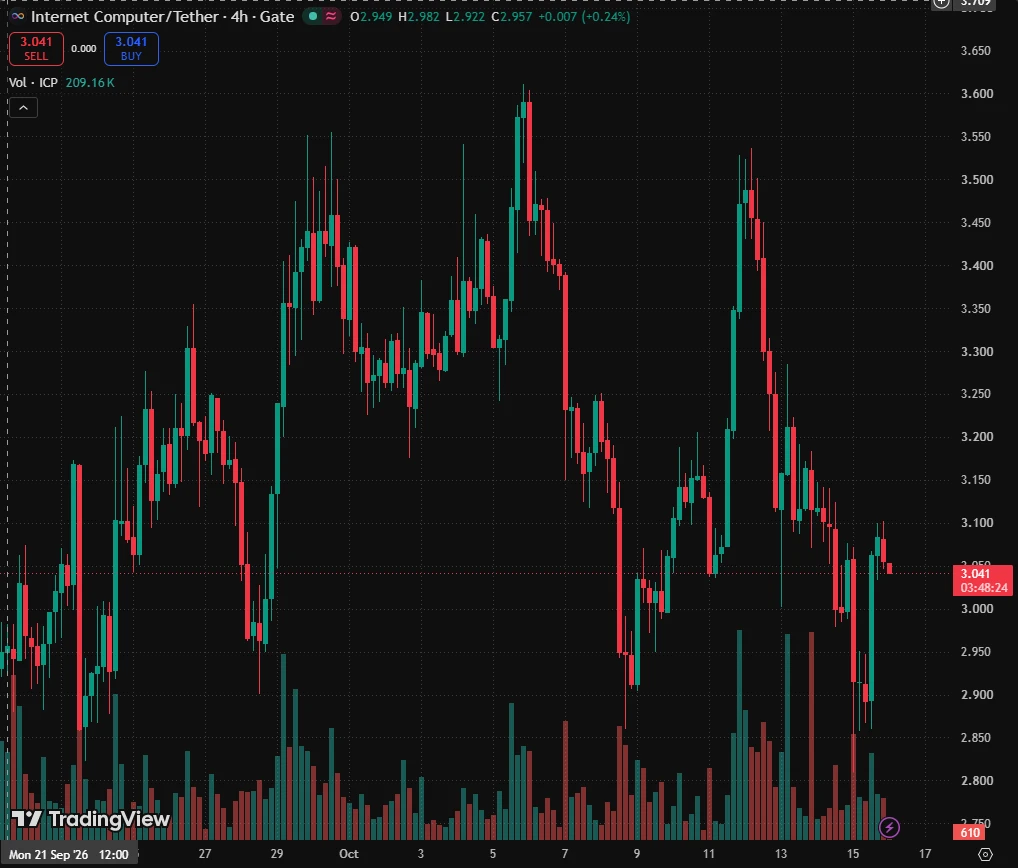
$ICP ICP/USDT: Key Support Holds the Potential for a Recovery Toward
ICP is approaching a critical support zone between $2.83 and $2.90, where horizontal support aligns with the rising trendline on the 4H chart.
If buyers defend this area and bullish momentum strengthens, the price could recover toward the following resistance levels:
• $3.20
• $3.28
• $3.45 - $3.47
The RSI is showing signs of recovery, but further confirmation is needed before expecting a stronger upward move.
A breakdown below $2.83 could invalidate this bullish scenario and expose ICP to further downside.
Key zone to watch:
post-image
ICP-0.52%
Short $AGT
now. Entry range: 0.03532 - 0.03610Take-profit 1: 0.029963Take-profit 2: 0.025365Stop-loss: 0.039710After a sharp vertical surge, AGT has shown clear signs of weakness. The 15-minute chart failed to reclaim the 0.0352 MA25 resistance level. As RSI retreats from the overbought zone and the price struggles to hold the key 0.0350 level, the risk of further mean reversion is high. Trade 👇👇👇 hereOther active signals: $AKE : Current price 0.03267 - 24-hour gain: +19.29%$SOL : Current price 105.54 - 24-hour gain: +1.08%
post-image
SOL+1.15%
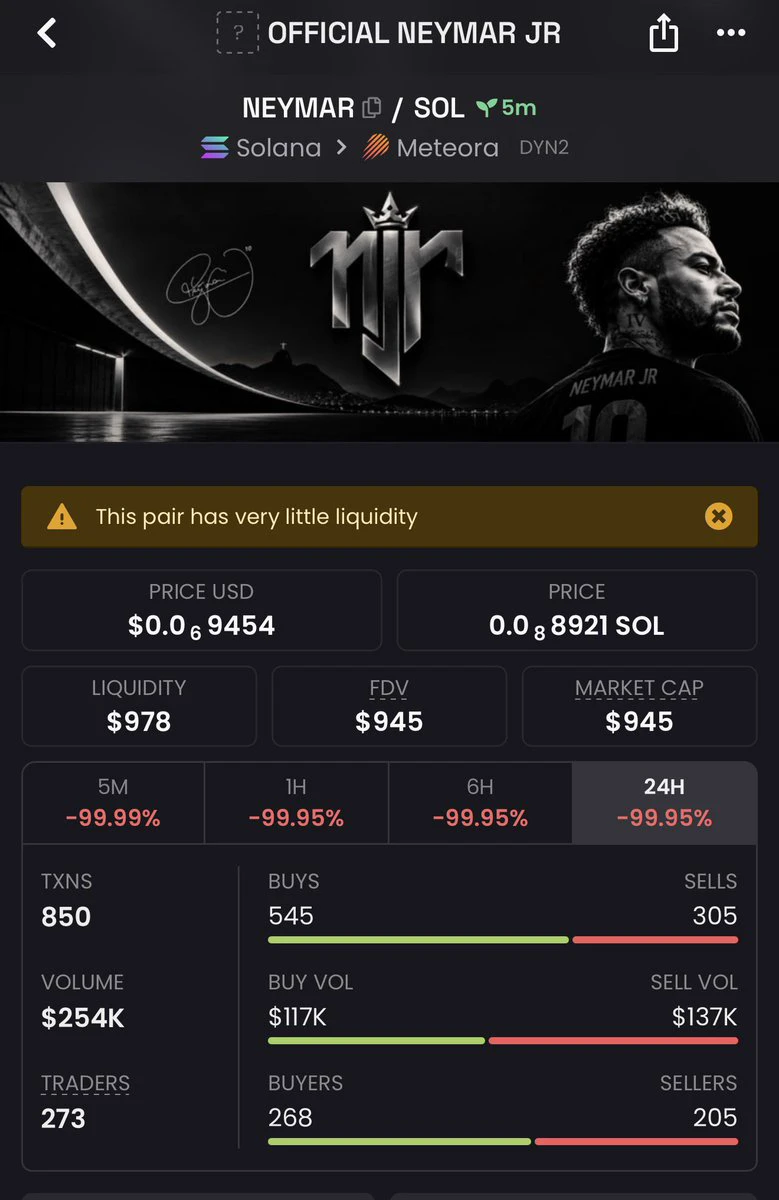
If you lost money in this token, you probably deserved it.
post-image
TOKEN+1.23%
GM,
Waking up to a day of wicks,
Did the price come back, but your position disappear?
Good news: In the early hours, $BTC touched the 7-handle,
Bad news: The quick wick brought it back near $82K.
The damn market maker: Just going up and down—so comfortable.
post-image
BTC+0.65%
#AnthropicTurnsProfitablebutGrowthSlows
ANTHROPIC’S PROFITABILITY MILESTONE: THE AI RACE IS SHIFTING FROM RAPID GROWTH TO SUSTAINABLE RETURNS
The artificial intelligence industry may be entering a new phase where profitability, operational efficiency, and realistic valuations matter just as much as technological innovation. Anthropic’s reported financial performance highlights this transition, with adjusted profitability for a second consecutive quarter alongside continued revenue expansion.
However, the changing growth rate raises an important question: Can AI companies maintain their moment
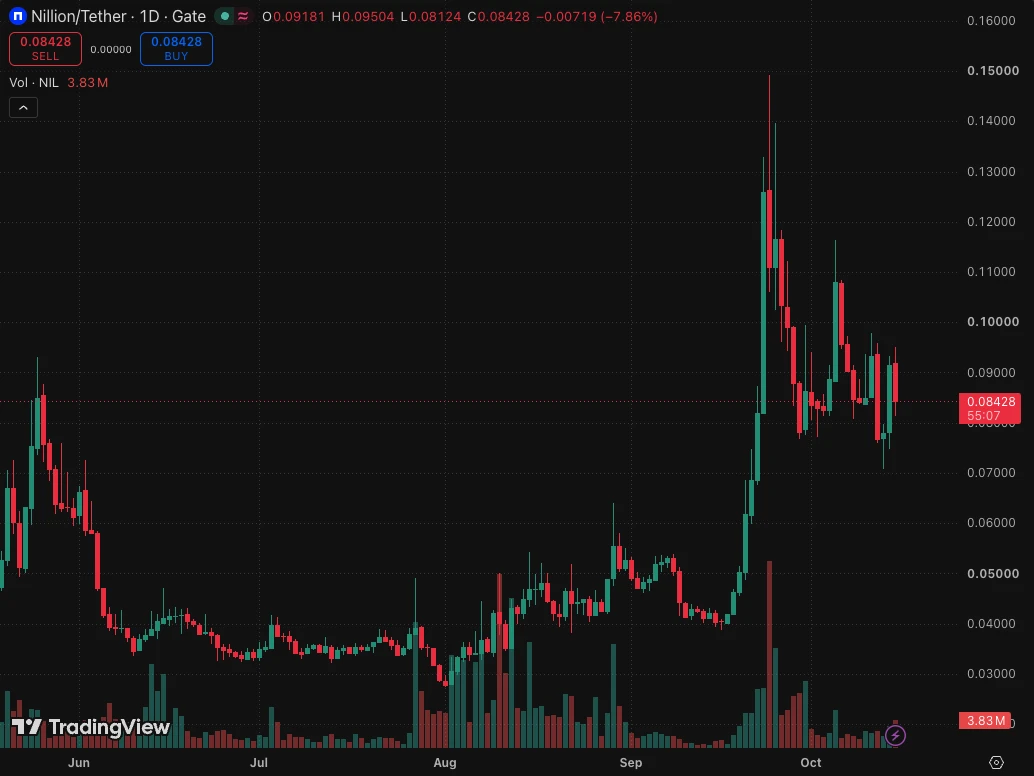
$NIL NIL as a upward coin
1D
Nilion in the daily time frame has broken its resistance and is now resting and shaping a pullback at 0.08263.
4H
It has had a strong upward move, then shaped a lower high and lower low, so it now has a downtrend line. Volume also confirms the trend: when price increases, volume increases too, and when it rests, volume decreases.
If it breaks the trend line and shapes a higher high and higher low, it can be suitable for a long position. Volume must confirm the trend.
15m
In this time frame, it has a range box. If volume moves upward when the ceiling of the box brea
post-image
NIL-7.47%
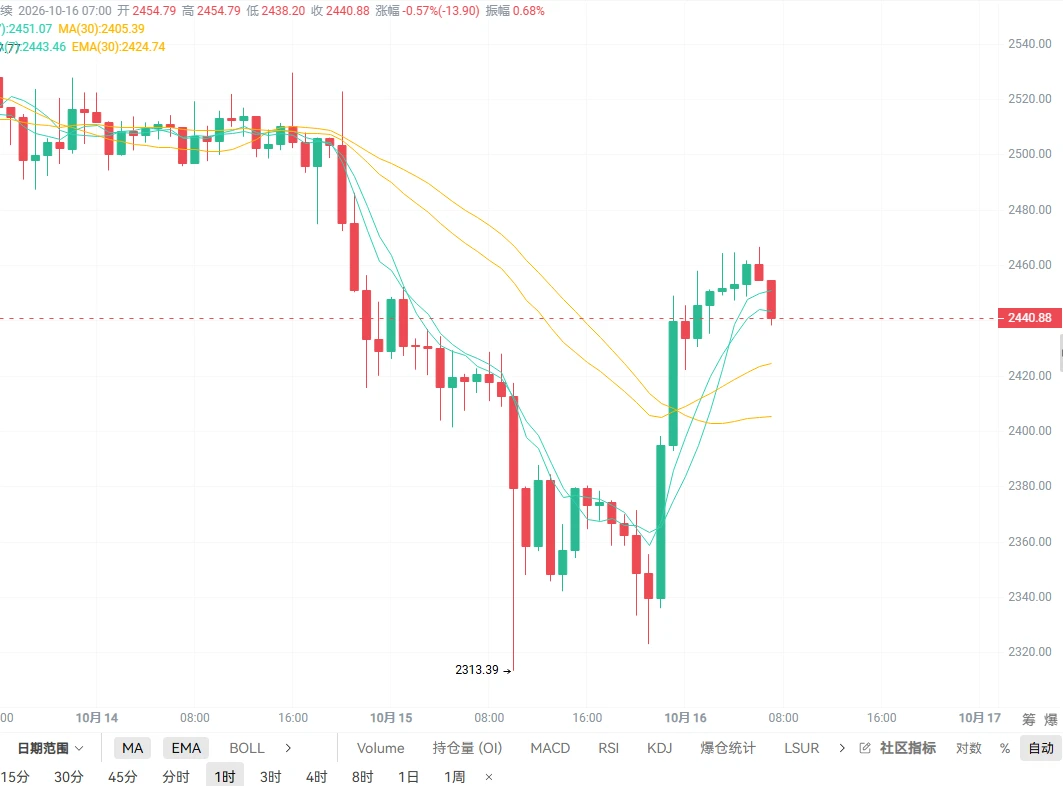
The guy on my list who has been watching ETH’s yearly moving average has kept an eye on it for more than half a month—the wick that stabbed down to 2318 yesterday morning actually prompted him to place an order. Those still holding long positions are probably feeling a bit panicked right now.
I wrote down his rules: after the three-leg decline, treat it as the C he mentioned and place an order below; the stop-loss is set at just one level—the low of yesterday’s wick.
I checked that wick: the 1-hour candle plunged 100 points, with volume 8 times that of the previous hour; he hasn’t fired all hi
post-image
ETH+0.75%
Your strategy determines your opportunities.
Your position sizing determines your survival.
post-image
Yang Guang bit | October 16 $ETH Precision Strategy — Oversold rebound nearing the resistance zone, two-way positioning with shorts high and longs low
【Today's Outlook】
Entry timing: Set up short positions on a rebound to the 2460—2480 range; take short-term longs on a pullback to 2400—2420
Stop-loss settings: Short-position stop-loss above 2500; long-position stop-loss below 2390
Staggered take-profit:
Short-position target: 2400—2420
Long-position target: 2455—2470
【Core Conclusion】
After yesterday's hotter-than-expected CPI, ETH plunged to a low of 2313.39, then rebounded to around 2466, d
post-image
ETH+0.75%
$ADA About to rise after a slight pullback
Buy 0.2285–0.2255, targets 0.2310, 0.2335, 0.2360, stop loss 0.2210
post-image
ADA-0.25%
Layout: Bitcoin, Ethereum, Dogecoin
live-cover
LIVE880
  • 4
The bot is drawing a candlestick chart—what a beautiful arch. Now we just sit back and watch the show, and see whether the market maker paints the motherland’s mountains and rivers red, with the splendid landscape covered in fluttering maple leaves!
post-image
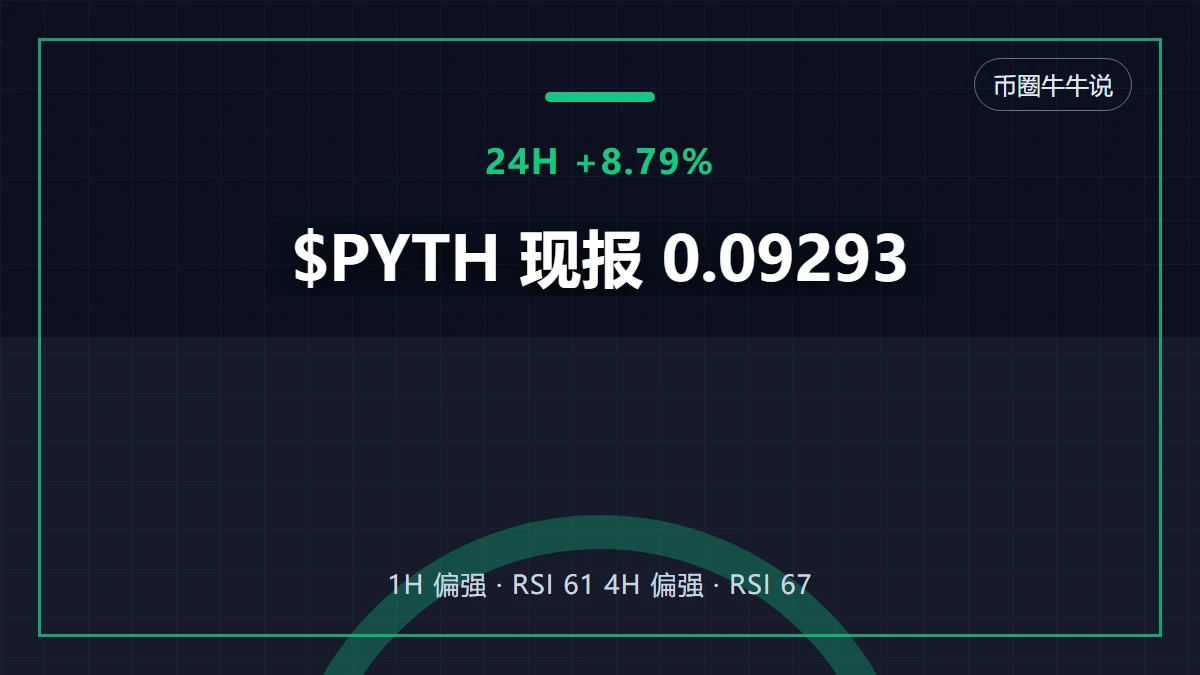
$PYTH What is most interesting right now is not guessing whether prices will rise or fall, but seeing who is forced to change their tune first.
The bulls' test is at 0.10094, while the bears' test is at 0.08063. $PYTH is currently at 0.09293, up 8.79% over 24 hours. One-hour support is 0.08063, resistance is 0.10094, and current volume is 0.21 times the average volume of the past 20 candles.
First, I note that after $PYTH's sharp 24-hour rise, momentum and continuation are not the same thing, because I do not extrapolate an already completed large move into the next leg; I first look at whethe
post-image
PYTH+9.46%
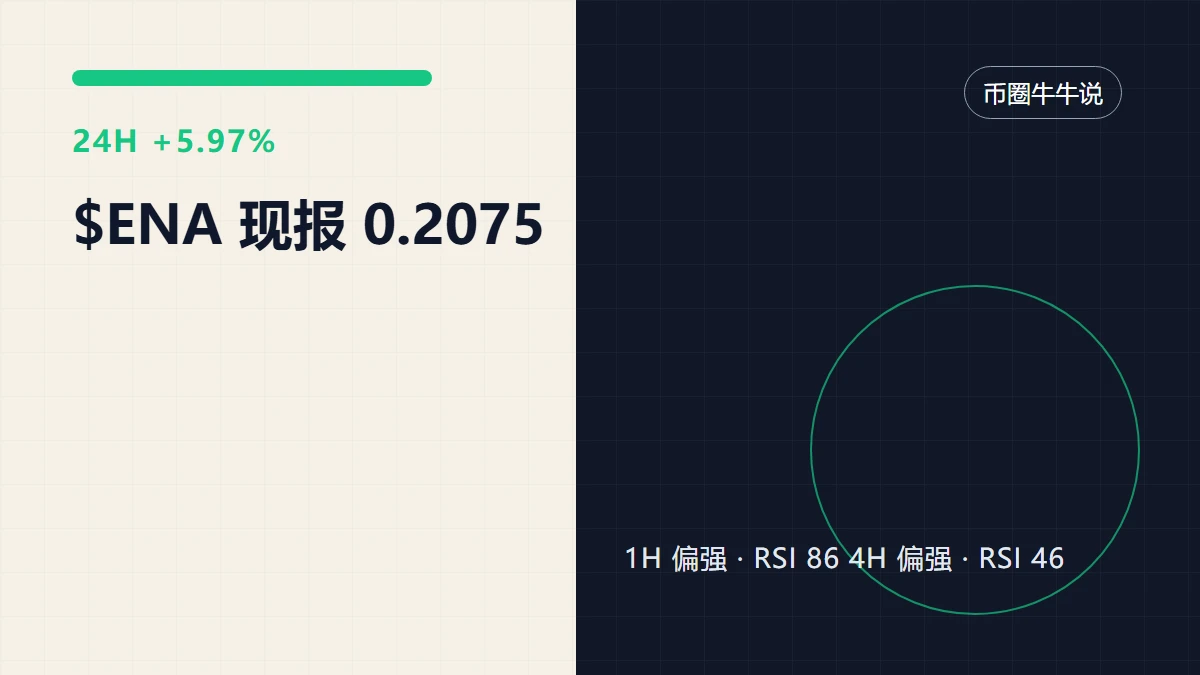
What is the easiest trap to fall into in this $ENA rally?
When I looked at $ENA again, I first covered up the +5.97% over 24 hours. It’s not that this number is unimportant, but it is too good at grabbing attention. What really needs explaining now is that $ENA remains strong, while the crowding is already out in the open. I acknowledge that the trend is strong, but what matters next is not how much higher it can surge, but whether anyone steps in on the first pullback.
Laying out the market, the current price is 0.2075, with a 24-hour range of 0.1825–0.2079. The 1-hour support is at 0.1825 a
post-image
ENA+4.44%
Load More

Join 40 M users in our growing community

⚡️ Join 40 M users in the crypto craze discussion

💬 Engage with your favorite top creators

👍 See what interests you

Trending Topics

USSeptemberPPIBeatsExpectations

91.35k Views1.89k Discussing

US September PPI came in at 6.3% YoY, well above the 5.3% market expectation, pointing to renewed producer-side inflation pressure. Weekly jobless claims were 199K, broadly in line with forecasts. Could hotter inflation further reduce room for rate cuts, and what does it mean for $BTC, US stocks, and gold?

DrLinHanSpeaksAtOxfordUnion

135.63k Views1.86k Discussing

JapanAndKoreaStocksPlunge

47.27k Views1.76k Discussing

View More