Square
Following
Hot
News
Notifications
Profile
Share your thoughts
placeholder
Article
$LYN It surged to 0.0313 within 24 hours, then got slammed back to 0.0258. That spike has the accounts of anyone who chased the top smoking. The 9.98% gain looks cheerful, but the intraday range hit 41%. What does the 85.6M in trading volume tell us? The big players distributed some tokens above 0.03, and now the price is stuck in the middle, with both bulls and bears testing the waters.
I checked the on-chain data: open interest in futures surged before this rally—a classic leverage-driven move, not one built on spot buying. What is this structure most vulnerable to? Hawkish Fed minutes. Last
LYN-0.44%
BTC-0.67%
Crypto is all about contrarian thinking. Once everyone has exited, it can really take off. I’m still buying the dip
post-image
Trenches
ZIG
Z
bade
b
ZIG
0x8c...1145
Market Cap
$.
Change
.
24h Vol
$.
Holders
.
STONK
S
bade
b
STONK
6GmA...UNgx
Market Cap
$.
Change
.
24h Vol
$.
Holders
.
BTC
B
bade
b
BTC
C5xp...pump
Market Cap
$.
Change
.
24h Vol
$.
Holders
.
IDOL
I
bade
b
IDOL
0x3b...ab07
Market Cap
$.
Change
.
24h Vol
$.
Holders
.
José
J
bade
b
José
87CQ...1UJT
Market Cap
$.
Change
.
24h Vol
$.
Holders
.
$STONK Watching the order book this time made it pretty obvious to me: three wallets sold off almost back-to-back within the same time window, dumping nearly $300,000 worth of tokens in a few minutes. The market cap fell from around $70 million to $60 million, a short-term drop of about 14%. A quick look at the on-chain records shows three sell orders of roughly $110,000, $100,000, and a little over $80,000, placed less than five minutes apart. The selling pace looks a lot like the same group of funds reducing their positions all at once. As someone who just got in, I’m baffled: are several wh
post-image
STONK+11.55%
BTC-0.67%
ETH-1.26%
BREAKING: Someone opened a $68.1 million $BTC short position with 13x leverage! Liquidation price: $91,193. Big money is betting on Bitcoin falling. Will this trade pay off, or will longs trigger a short squeeze?
post-image
BTC-0.65%
BERGER
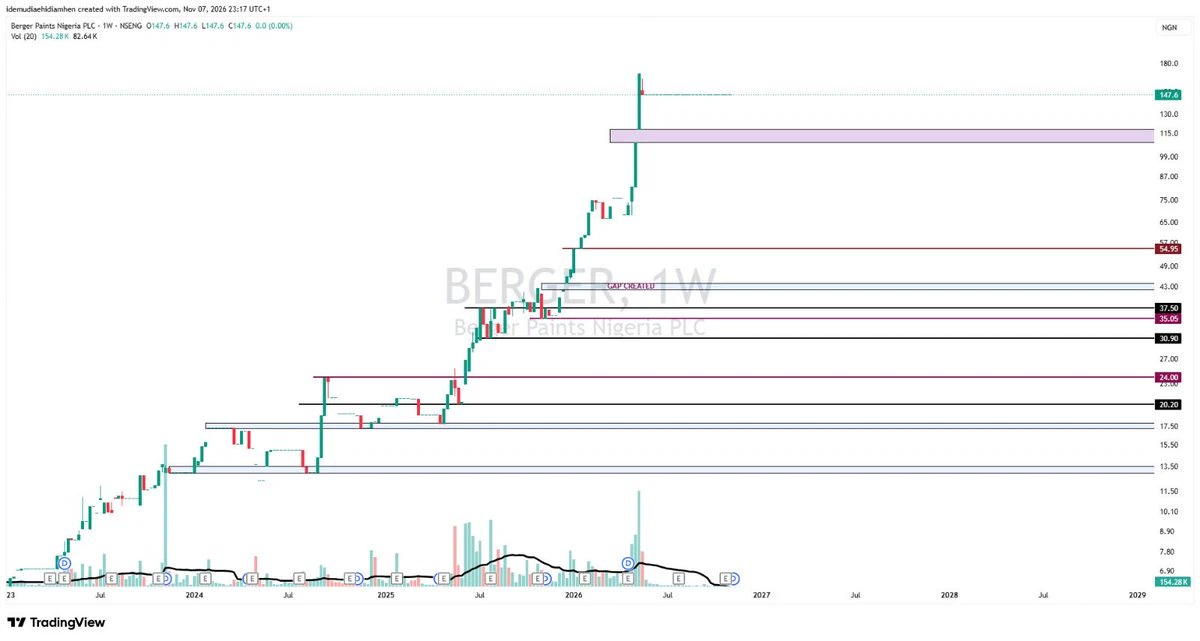
If BERGER doesn’t give me a proper correction, I’m sitting this one out. And even if you want to open a position at these levels, with how thinly the stock trades, you might have to go to Mecca before you get your order filled. 😂
I’d like management to consider a bonus issue to put more shares in circulation. It could help with liquidity if more shareholders make shares available for trading. With so few shares changing hands, the stock can go flat for stretches.
The level I’m watching is ₦66.15 per share. CAP Plc is my benchmark for the sector, and I’ve noticed that CAP and BERGER ten
post-image
DANGCEM
We hit a new ATH of ₦1,490/share and got a nice rejection. Right now, what I’m seeing looks like profit-taking.
What do I see on the chart? I’m watching two regions.
₦1,154.80–₦1,192.20/share. This is the first zone I’m watching. If it holds, I see it as a decent region to start building a position.
₦1,000/share. If the first zone fails to hold, the next bus stop I’m watching is the ₦1,000 psychological level. If we get there and the bulls defend it, that’s where I’ll bring out the bazookas.
Both zones look beautiful to me. After the run DANGCEM just had, I want to see where the buyers
post-image
  • 1
#USNonfarmPayrolls #ShareWeekly

Strong US Jobs Data Changes the Market Narrative: Is the Federal Reserve Preparing to Keep Rates Higher for Longer?

The latest October US employment report has introduced a significant shift in the global financial market outlook. Investors entered the week expecting moderate job growth and signs of cooling in the labor market. Instead, the latest figures delivered a much stronger picture of the American economy, forcing traders to reconsider their expectations for Federal Reserve policy, interest rates, and risk assets.

According to the reported figures, th
BTC-0.67%
XAU+0.38%
  • 1
SOL | Short 🔴 | Bearish | 15m 24h: -1.14% | Volume: 490.2M USDT. Short rationale: Price is below EMA200; EMA20/50/200 are bearishly aligned; RSI14 is 39.5; the MACD histogram is negative; ADX14 is 28.2; volume is 1.49 times the 20-candle average; trend pullback/continuation. Entry price: 89.1. Stop-loss: 89.7158. Take-profit 1: 88.3303 | Take-profit 2: 87.8685 | Take-profit 3: 87.2527. Entry is for reference only; do not chase the trade. The strategy is invalidated if the stop-loss level is hit. This is a technical analysis plan only and does not constitute investment advice. $SOL
post-image
SOL-0.77%
SOL | Short 🔴 | Bearish | 15m24h: -0.68% | Volume: 470.3M USDT Short rationale: Price below EMA200; EMA20/50/200 are bearishly aligned; RSI14 is 43.0; MACD histogram is negative; ADX14 is 18.3; volume is 0.60 times the 20-candle average; trend pullback/continuation. Entry: 89.5 Stop loss: 89.9345 Take-profit 1: 88.9569 | Take-profit 2: 88.6311 | Take-profit 3: 88.1966 Entry for reference only; do not chase the price. The strategy is invalidated if the stop-loss level is hit. Technical analysis strategy only; not financial advice. $SOL
post-image
SOL-0.77%
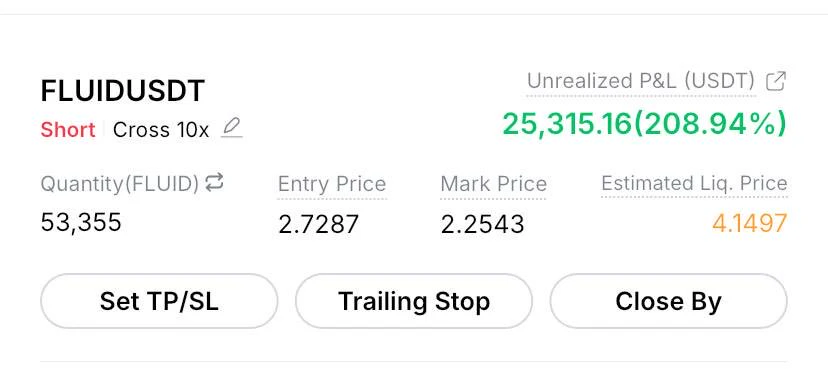
$FLUID approaching target now
Join our telegram channel for live trades
post-image
FLUID-1.92%
Digging through Hyperliquid whale positions again in the early hours
The short positions are stacked pretty aggressively
BTC shorts: around $890–920 million
Longs: around $450–480 million
Shorts are roughly twice the longs
Net short: around $350–470 million
The most bearish positioning since October 2025
The largest single short is around $178.5 million
Entry price around 76390
There are also shorts of around $155 million and $101.8 million
Quite a few are above $60 million
They flipped to net short around October 27 and have kept adding since
BTC perpetual open interest on the platform is aro
post-image
BTC-0.65%
  • 1
Why Did Bitcoin Drop to $76,000 So Fast?
Bitcoin volatility surged tonight (November 5), swinging from $75,000 to $81,000 before retreating to $76,200 at the time of writing.
Think of this crypto market selloff like a chain reaction on a bridge. When a few heavy trucks start shaking and trigger the weight sensors, everyone bolts for the exit. That panic accelerates the price drop rapidly.
⚠️ Personal market analysis only. NFA — manage risk and DYOR.
Educational content, not investment advice or a recommendation to buy, sell, deposit, or withdraw any asset. No paid promotion or referral/affilia
post-image
BTC-0.67%
[New Streamer] Market updates on Weekend !!!
live-cover
LIVE77
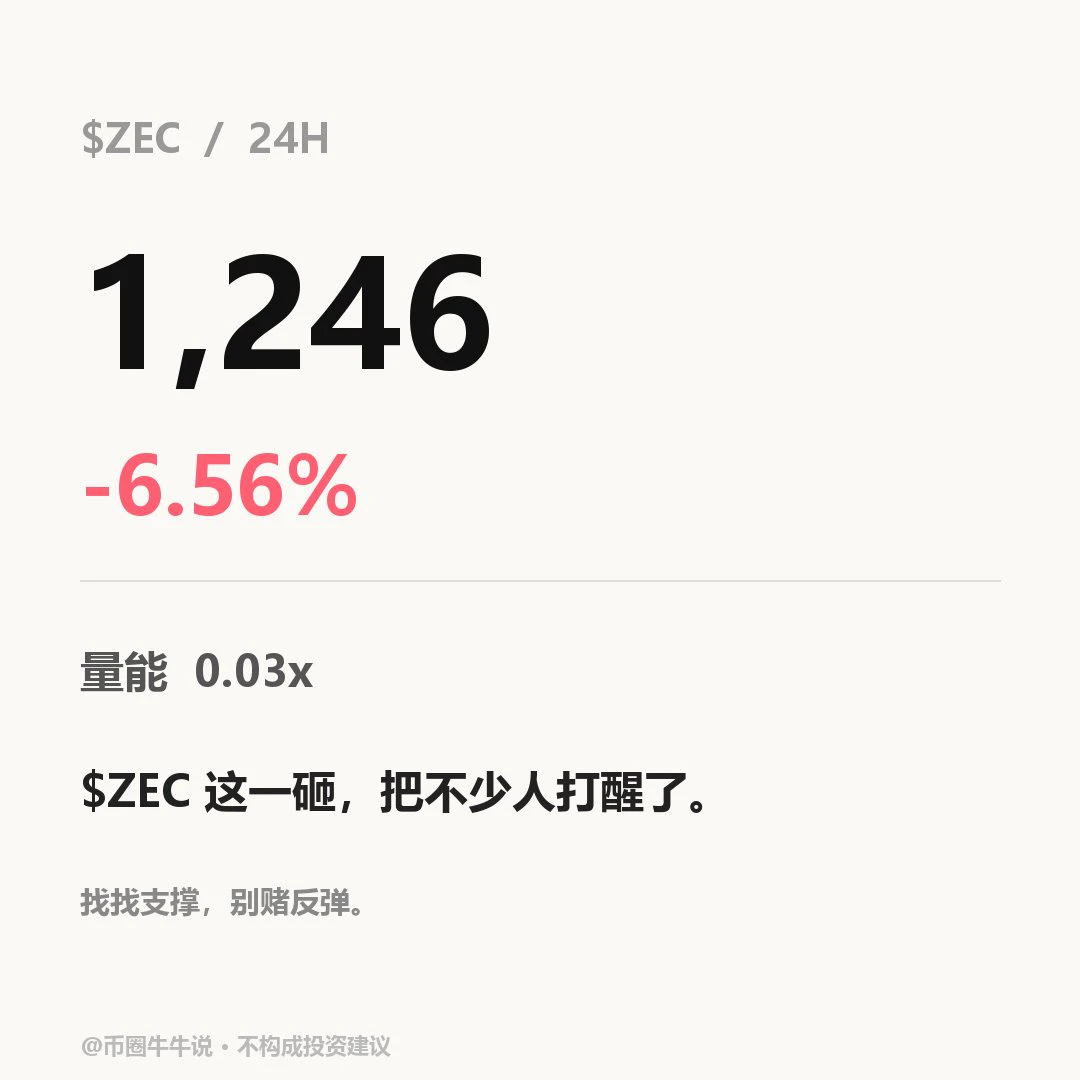
$ZEC Currently at 1246.5, down 6.56% over 24H (range: 1242.05–1364.08). The 1H trend is weak, with RSI at 12.56, price below the EMA20 at 1282.85, and a volume ratio of 0.03. The 4H trend is weak, with RSI at 51.52, price below the EMA20 at 1282.90, support at 1159.00, and resistance at 1387.89. If price moves above and holds the 1364.08 resistance, it can be monitored; a break below the 1242.05 support would weaken the structure. Review whether price holds above 1364.08 and reclaims 1242.05; volume is only 0.03x. A low-volume hold above resistance, or a break below support without a subsequen
post-image
ZEC+1.16%
☀️ Good morning this Sunday.
​
The morning light is just right, and everything is lovely.
​
No rat race talk today—let’s just enjoy life. Give this a like and kick off an energetic day!✨
post-image
MARKET UPDATE
live-cover
LIVE42
Keep an eye on it as it falls $ZEC
Will it fall to 1.1000?
post-image
ZEC+1.16%
GN weekend crew 🌙 Quiet tape tonight.
US cash is closed, crypto just chopping. $BTC near $75.7K, $ETH around $2.23K, basically flat after Friday's dip into the mid-75s. Spot BTC ETFs saw about $1.3B leave this week, and Fear & Greed is still Extreme Fear. Thin books. I'm not forcing size.
Monday: Fed speakers (Bowman, Goolsbee, Barkin), China CPI/PPI in Asia hours. Real event is Tuesday CPI.
Weekend liquidity loves fakeouts. Leaving room for the open.
#Bitcoin #Crypto
post-image
BTC-0.67%
ETH-1.26%
Load More

Join 40 M users in our growing community

⚡️ Join 40 M users in the crypto craze discussion

💬 Engage with your favorite top creators

👍 See what interests you

Trending Topics

USAIStocksHitHard

21.44k Views3.68k Discussing

U.S. stocks sold off sharply on Thursday, November 5 (UTC). The Nasdaq closed down around 5.5%, entering correction territory, while the Philadelphia Semiconductor Index plunged roughly 12%, with chip stocks including $NVDA and $AMD posting steep losses. Beyond profit-taking, investors are growing concerned about the pace of AI data center construction, capital spending, and future returns on investment. The key question now is whether the AI sector’s lofty growth expectations need to be repriced. Where do you think the next opportunities will emerge: chip stocks, tech giants, or other sectors?

USNonfarmPayrolls

35.66k Views4.35k Discussing

StakeOnLaunchpoolToShare450KVLX

10.5k Views831 Discussing

View More