Square
Following
Hot
News
Profile
Share your thoughts
placeholder
Article
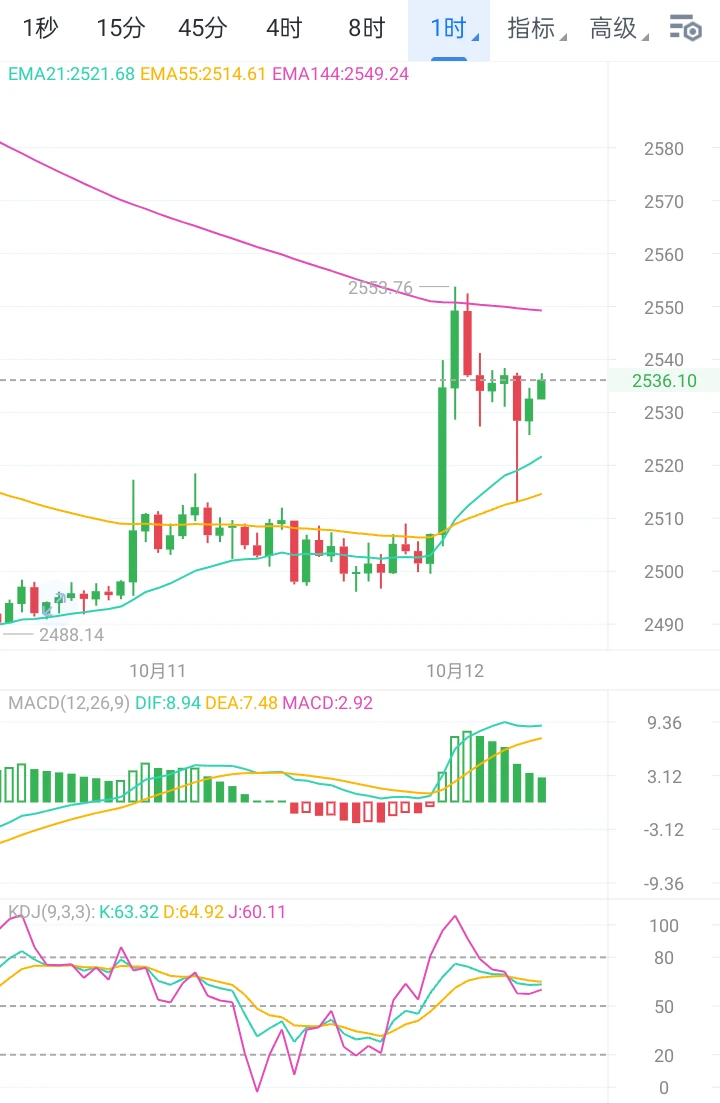
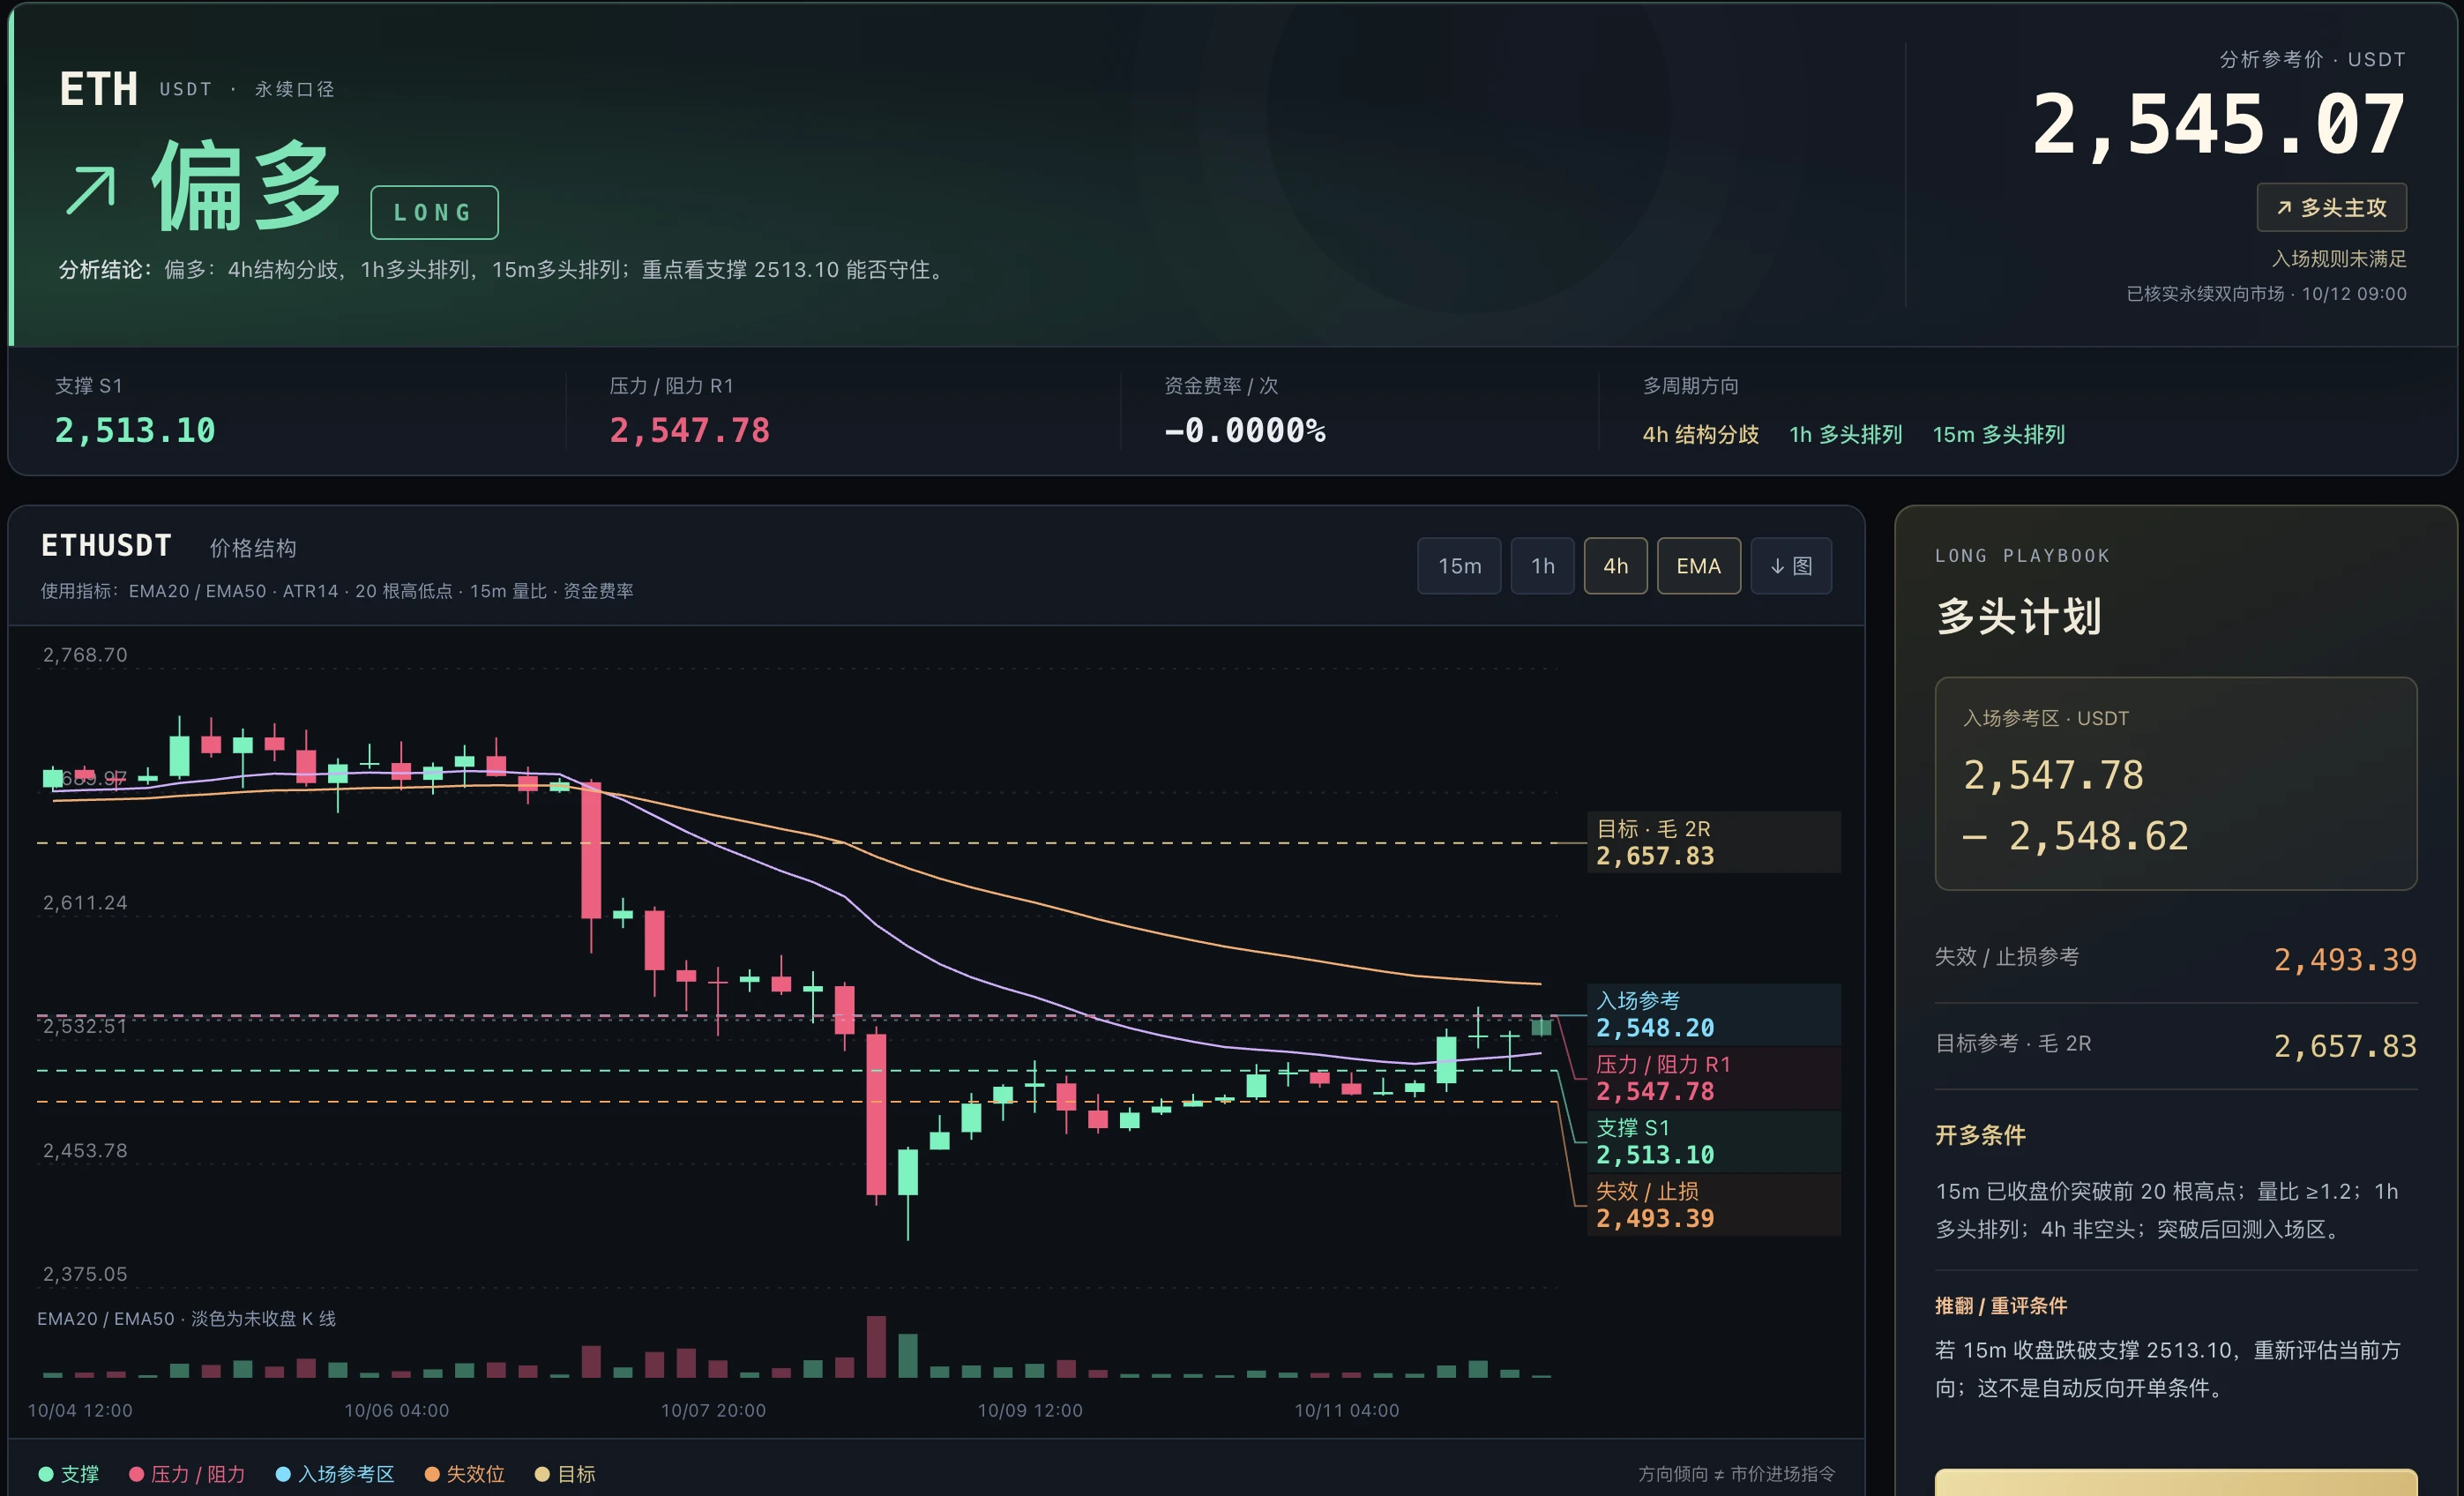
Ethereum rose first and then weakened overnight, climbing to around 2553 before stopping, followed by a new round of decline. It fell to around 2513 in the early morning, a one-way drop of 40 points, and has now recovered to fluctuate near 2536.
From a technical perspective, 2513 is the low of this decline. The price quickly recovered after touching it, indicating buying support below this level and initial signs of a short-term bottom. Above, 2553 is last night’s high and the nearest resistance at present. If it breaks through on increased volume and holds, further upside could open; otherwis
post-image
ETH+1.59%
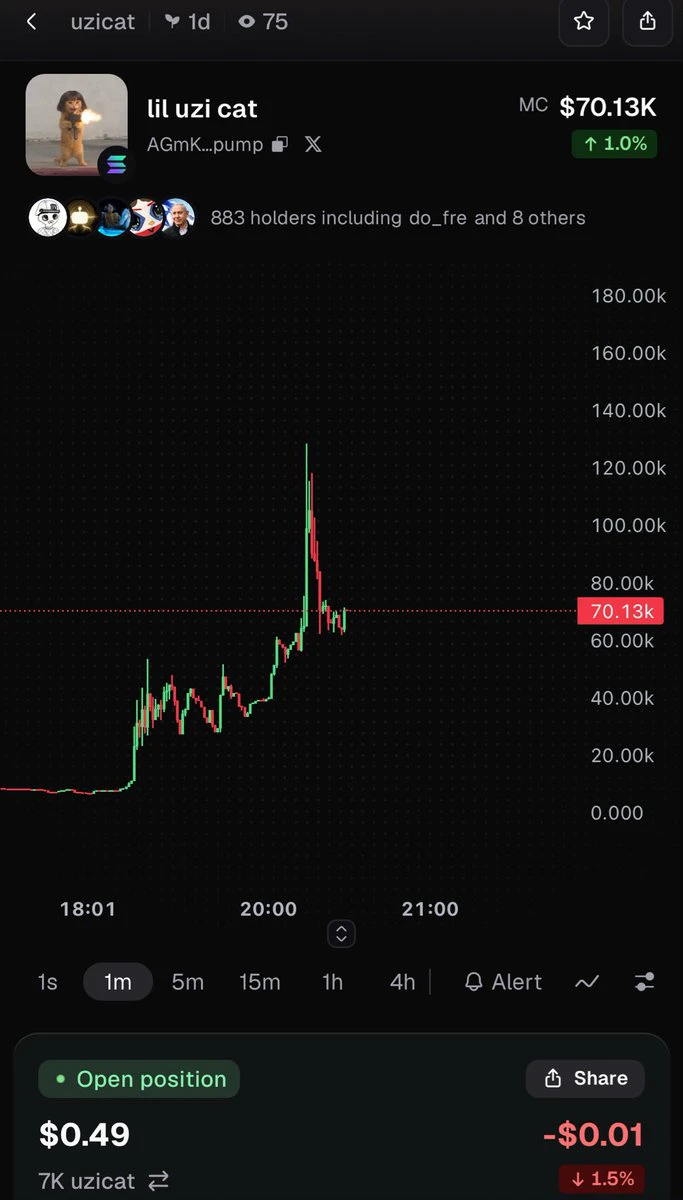
Pepe buy $0.50 of solana:AGmKjJwXiu5wCC7fiDPptetoMCa7rYsSaYX2Cqxqpump to test
solana:AGmKjJwXiu5wCC7fiDPptetoMCa7rYsSaYX2Cqxqpump
AGmKjJwXiu5wCC7fiDPptetoMCa7rYsSaYX2Cqxqpump
#crypto
post-image
SOL+1.64%
How to boost your mental energy and spirit?
1️⃣Travel and get out more to see places with mountains and water
2️⃣Keep exercising and working out, including jogging
3️⃣Read relevant books and various classics
4️⃣Motivate yourself and regain your confidence
5️⃣Stay away from people who drain me, including my parents
6️⃣Control my pace, including in life and trading
7️⃣Maintain a positive mindset and emotions; don’t be pessimistic or slack off
8️⃣Find a hobby, such as hiking, photography, or fishing, and when I’m not in a good state or the market is chaotic, appropriately distance myself from the
post-image
When Volcker took over the Federal Reserve in 1979, the year-over-year U.S. CPI surged to 14.8% in March 1980. He did not choose to “wait and see.” Instead, he pushed the federal funds rate to around 20% and used money-supply targets to force inflation down. Three years later, CPI had fallen to around 3%, but the cost was two recessions, in 1980 and 1981–1982. The unemployment rate exceeded 10.8% by the end of 1982. Midwestern farmers, squeezed by high interest rates and collapsing land prices, drove their tractors to Washington and blocked the entrance to the Federal Reserve. That was not pol
post-image
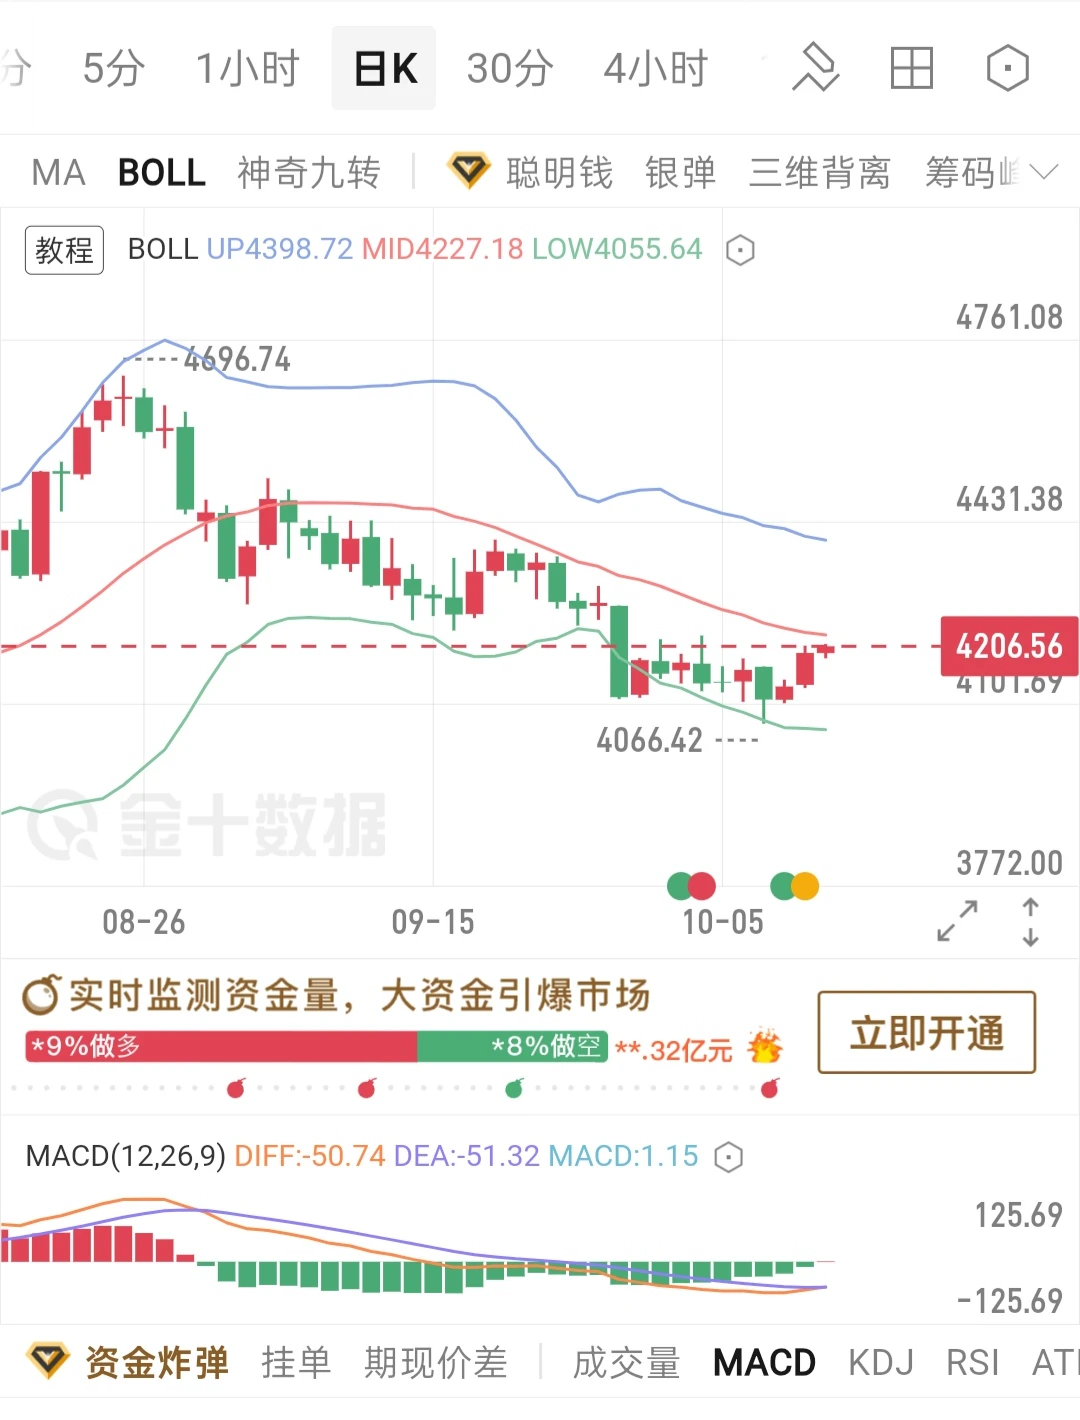
Gold on 10/12:
On the daily chart, the price pulled back from its previous high, stabilized and rebounded after hitting a low around 4066. The current price is below the Bollinger middle band, indicating a low-level recovery after the decline. The medium-term trend remains bearish, with the Bollinger middle band around 4227 serving as the primary resistance.
Regarding MACD, the DIFF and DEA lines are both below the zero axis. DIFF has crossed above DEA, forming a golden cross, and red bars have just appeared, indicating short-term recovery and rebound momentum. However, this has not changed th
post-image
GLDX+0.05%
PAXG+0.41%
XAU+0.43%
  • 1
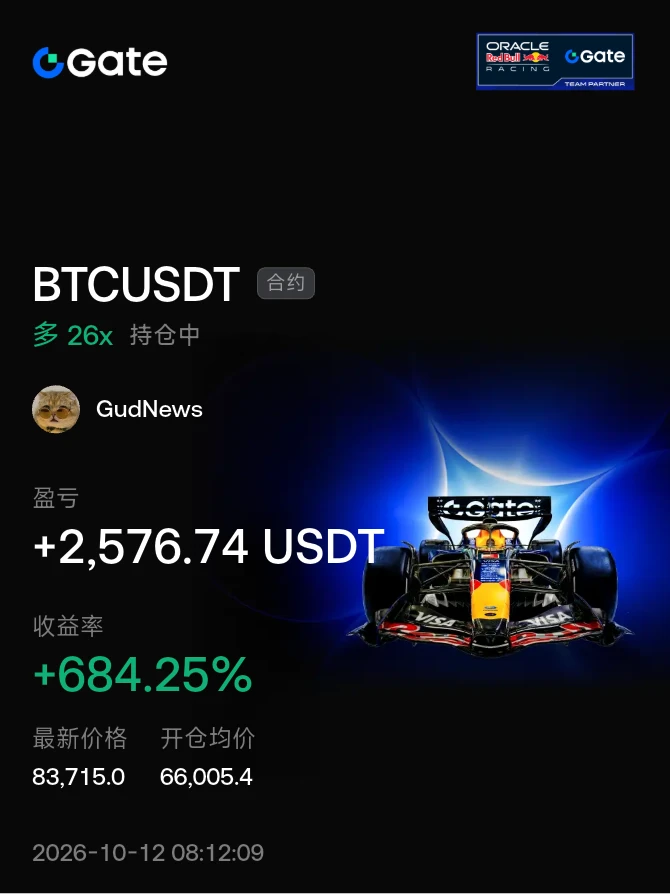
With the continued strength, can Bitcoin continue to push higher? Bitcoin faces strong resistance at 87000 above on the chart, with short-term resistance at 84300 and 85200. Continuing to buy into strength is also an option, but I prefer to build short positions near resistance.
Short positions can be built around 84100–84800 when opportunities arise, with a downside target of 82800; if it breaks through, look lower toward 81800. Make reasonable plans based on your position size and strictly set stop-losses$BTC $ETH #Gate亮相TOKEN2049
post-image
BTC+1.15%
ETH+1.58%
Macro data will be dense this week, so we still cannot let our guard down
I think the most important thing to watch this week remains the US CPI data.
The market has been pricing in expectations that the Federal Reserve will continue raising rates. Although the probability of an October rate hike has declined recently, this does not mean macro pressure has completely disappeared. The real key is whether inflation data will make the market concerned about rate hikes again.
On Wednesday, focus on the US September CPI and core CPI. On Thursday, watch initial jobless claims, retail sales, PPI, and
post-image
BTC+1.15%
$SUI /USDT is silently building a bullish base most traders are still ignoring.

$SUI /USDT - LONG

Trade Plan:
Entry: 1.1225 – 1.1283
SL: 1.0973
TP1: 1.1465
TP2: 1.1606
TP3: 1.1817

Why this setup?
Why now? The daily trend is bullish, the 1h price sits at 1.1254, the 15m RSI reads 56.17, and the 1h ATR is 0.011729, which together show momentum is waking up without being overextended. The entry zone between 1.1225 and 1.1283 offers a precise refuel area, while TP1 at 1.1465 and TP2 at 1.1606 define the first two targets of this setup. The invalidation level at 1.1077 acts as the hard line i
SUI+2.10%
  • 1
Stop avoiding the inevitable. The time is now. Lock tf in.
post-image
Today’s gold trade: after two days without trading gold, I had $24 left and easily doubled my account. Making money is as simple as drinking water—you can profit on both longs and shorts! Can those who suffered heavy losses on ETH make some of it back with small trades in gold?
GLDX+0.05%
PAXG+0.41%
ETH+1.58%
$SAND has basically reached the end, closed everything out, and tried to catch the bottom with a short position
SAND+0.30%
#LedgerLossesNear90Million Ledger’s latest crisis hits nearly $90–94 million — and it forces a hard reset on how we think about “safe” crypto storage.
Over the past few days the crypto community has been shaken by reports of large-scale fund drains linked to Ledger hardware wallets. On-chain investigators tracked roughly $90–94 million stolen from hundreds of wallets across Bitcoin, Ethereum, TRON, BNB Chain, Polygon and others. The common thread? Devices purchased through a Southeast Asian authorized reseller (CryptoBilis). Ledger has confirmed that at least one affected device contained an u
post-image
BTC+1.15%
ETH+1.58%
TRX-0.15%
BNB+0.82%
  • 6
  • 1
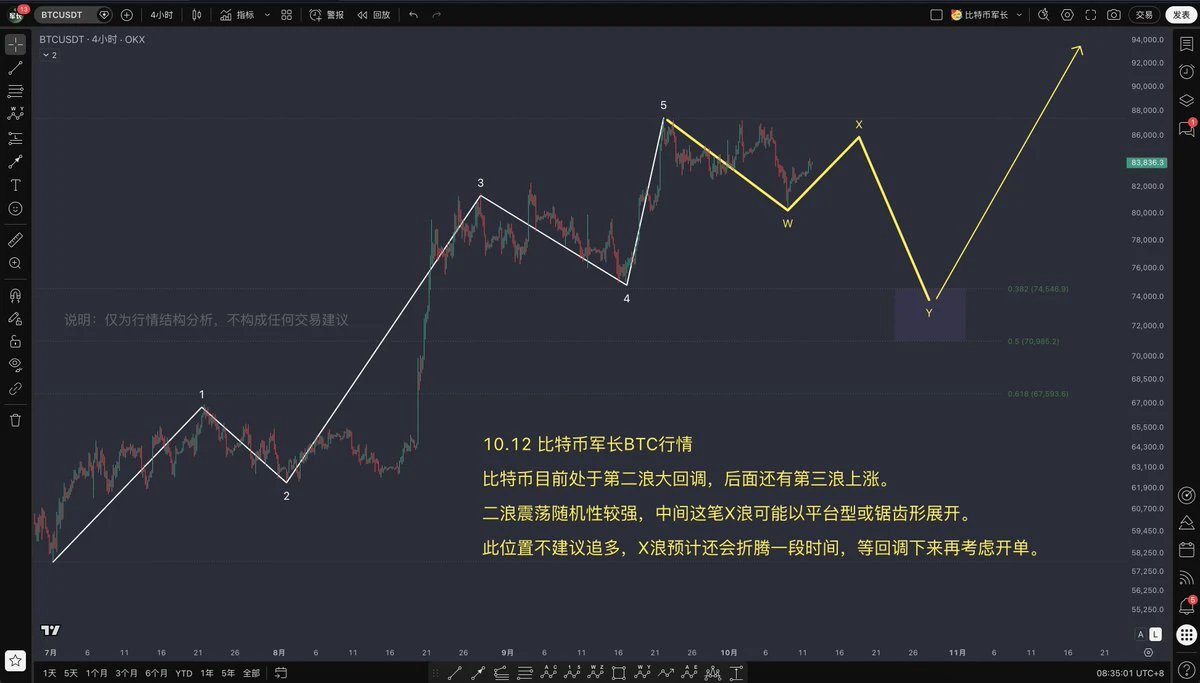
$BTC 10.12 Bitcoin Price Trend Analysis
Bitcoin is currently in a major Wave 2 correction, followed by a Wave 3 rise.
Wave 2 consolidation is highly random, and the intervening Wave X may unfold as a flat or zigzag pattern.
Opening a long position here is not recommended. Wave X is expected to continue fluctuating for some time; consider entering a trade after the pullback.
Risk warning: This is only an analysis of the market structure and does not constitute any trading advice.
#BTC走势分析 #比特币走势分析
post-image
BTC+1.15%
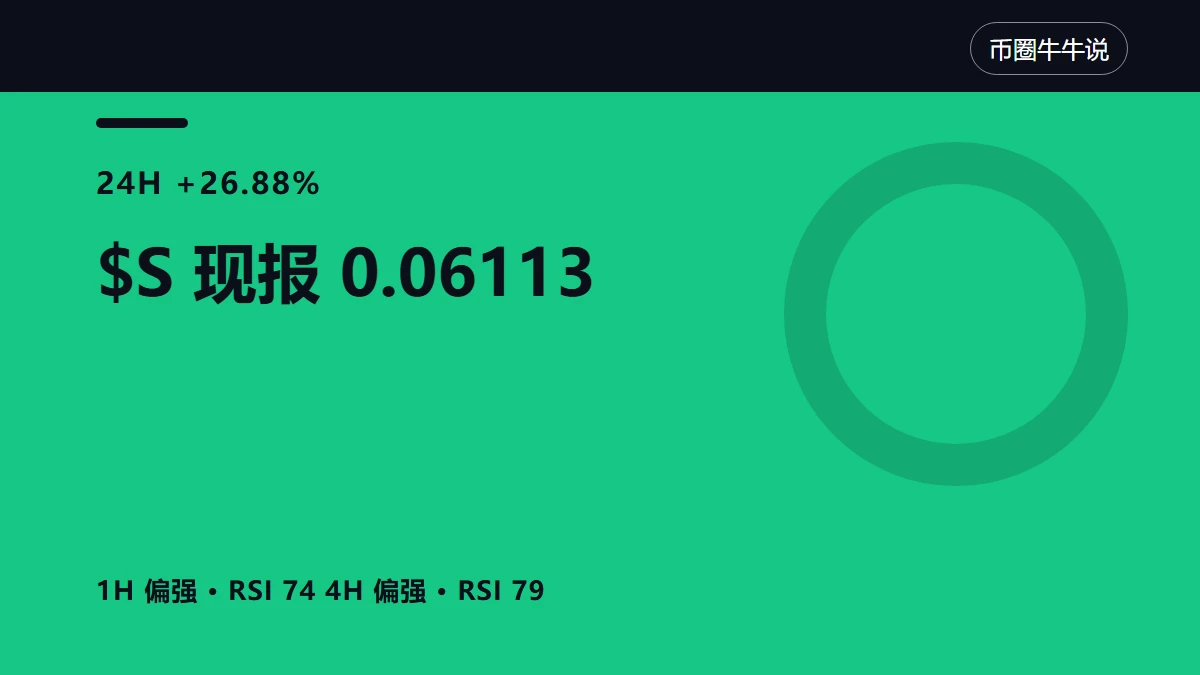
$S remains strong, and the risk of overcrowding is also rising
$S 24 hours +26.88%, current price 0.06113. The 1-hour and 4-hour RSI are 74 and 79, respectively. The strength is real, and so is the overcrowding. The question is not whether it can continue rising, but who will be willing to catch it during the first pullback.
Set emotions aside first; the structure offers very specific information. The 1-hour EMA20 is at 0.05678611, currently showing strength; the 4-hour EMA20 is at 0.04976159, also currently showing strength. The shorter timeframe reveals changes, while the longer timeframe li
post-image
$ETH Up for 3 straight days, yet the ETFs are still seeing massive outflows. What exactly is Wall Street trying to do?😂
ETH has finally recovered a bit over the past few days.
On October 8, it dipped as low as $2,408, then touched $2,554 last night.
Three straight days of gains. Just as I was about to celebrate, I checked the ETF data and couldn't smile anymore.
📊 First, the price:
🔻 October 8: -3.95%
🟢 October 9: +0.55%
🟢 October 10: +0.75%
🟢 October 11: +1.14%
💰 Latest market snapshot: approximately $2,547
💸 The ETF side looks a bit ugly.
U.S. spot ETH ETFs have recorded net outflows
post-image
ETH+1.59%
I don't know how to play any other games
I only play League of Legends,
It has been with me for thirteen years
During those helpless and painful days, League took me in
Focus on one champion, focus on one field
And eventually become the king of that field
Ten years to hone a sword
I finally reached Challenger
post-image
🔹 XRP Ledger fixes a major vulnerability that existed nearly 11 years ago, which attackers could ex
live-cover
LIVE1,816
Starlink|BTC|October 12 Outlook
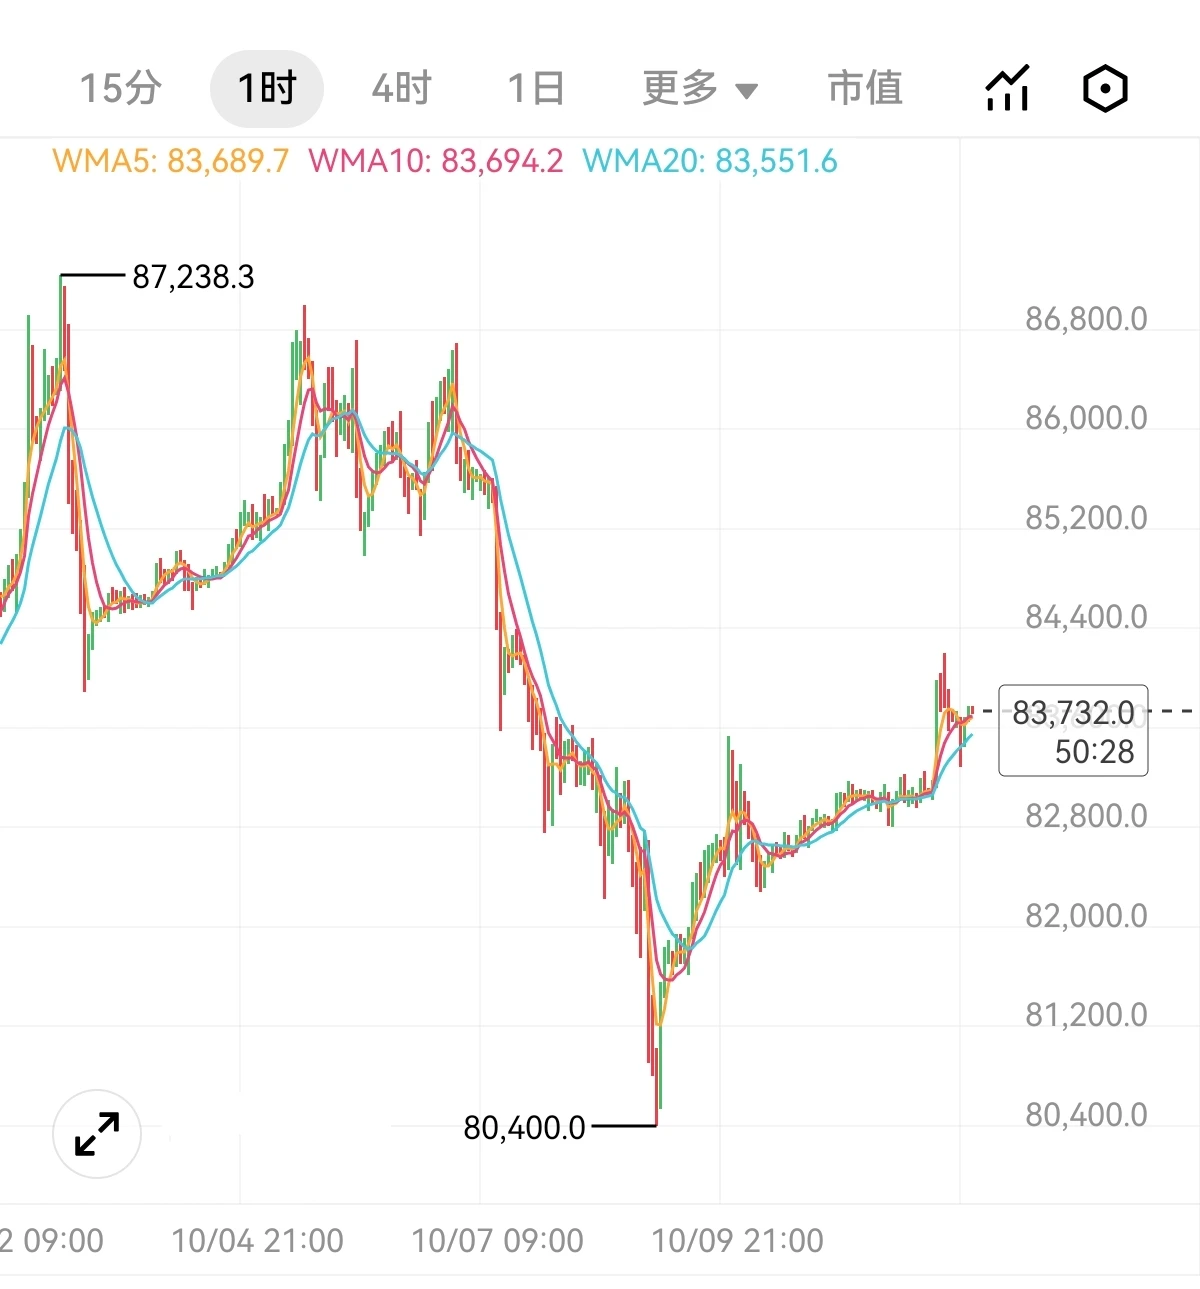
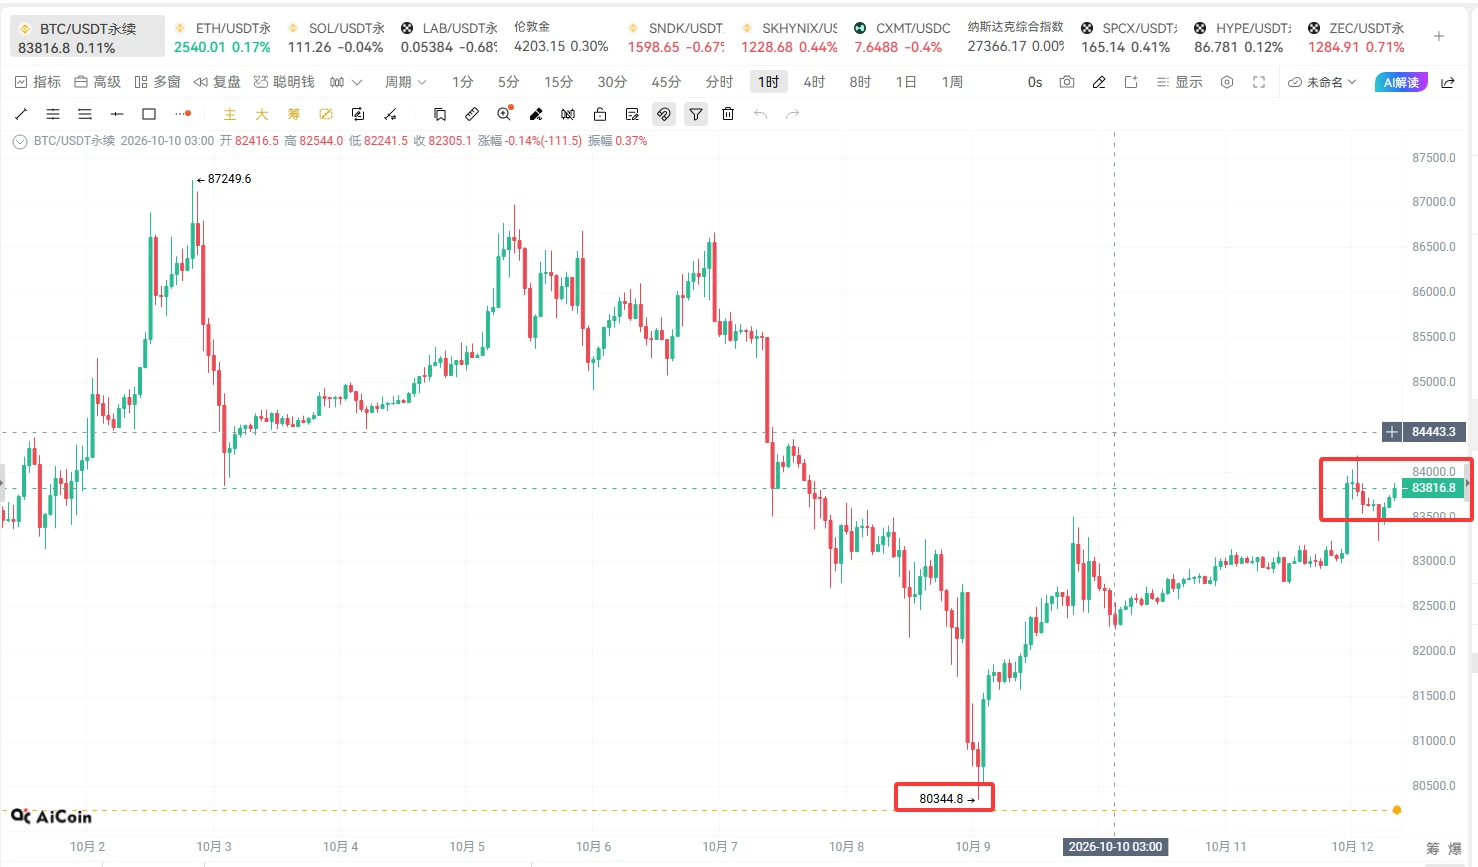
Go long with a light position at the current price, with the main position around 83000; add another 20% after breaking through 84500.
After rebounding from the low of 80344, BTC has reclaimed 83000 and is currently around 83800.
At this point in the rebound, there is no need to rush into chasing the highs. 84500 is a key short-term level to watch. Whether the price can break through it decisively will determine whether there is further room for an upward move.
Today's plan:
Current price: Go long with a light position and control the position size.
Main positio
post-image
BTC+1.15%
ETH+1.59%
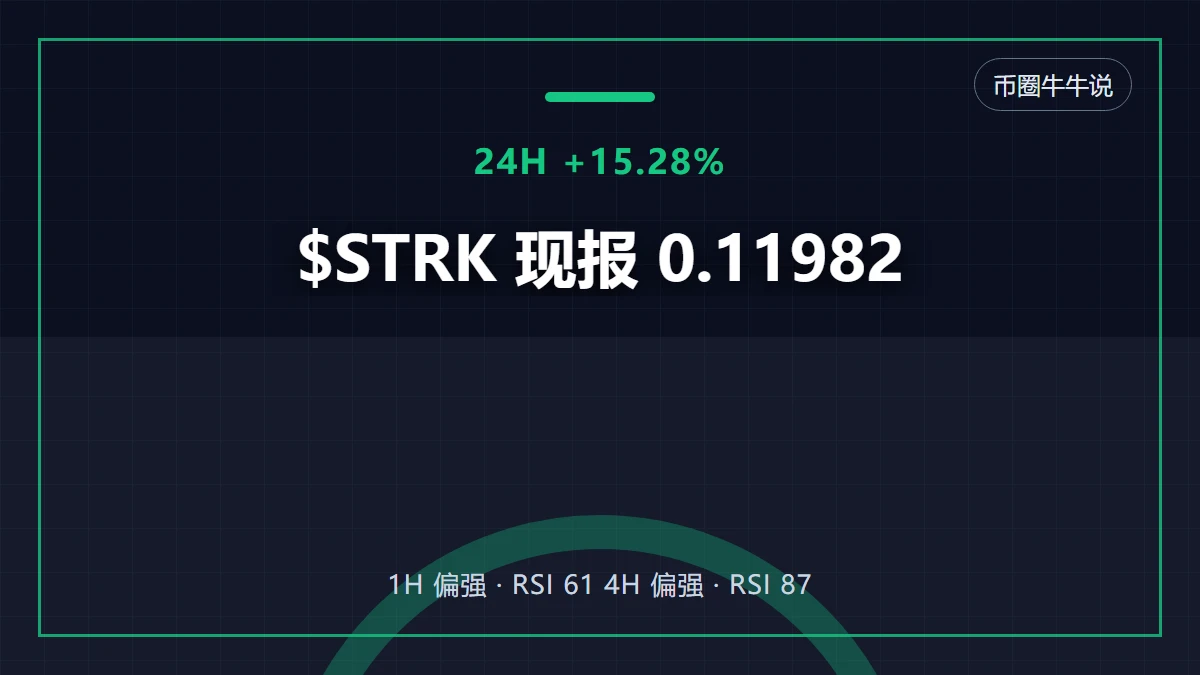
There’s no need to deny $STRK ’s strength, but mistaking overheating for safety is often when sentiment is most expensive.
I’m watching just one divergence: whether there is still support after breaking above 0.12389. The current price is 0.11982, with volume at 0.53x. The 1-hour and 4-hour trends are both strong, with RSI at 61 and 87, respectively.
If volume continues to increase after breaking above 0.12389, the initiative will favor the bulls; if it breaks below 0.10052 and fails to reclaim it, the short-term outlook is invalidated, and the next level to watch shifts to 0.04797.
Don’t rush
post-image
STRK+19.88%
Load More

Join 40 M users in our growing community

⚡️ Join 40 M users in the crypto craze discussion

💬 Engage with your favorite top creators

👍 See what interests you

Trending Topics

GateAtTOKEN2049

41.6k Views21.9k Discussing

Gate brought a series of major events to TOKEN2049 Singapore! From the official launch of Gate Money to the F1 Red Bull driver meet-and-greet and the Gate Gala, we witnessed a new chapter of "One Gate, Borderless Finance." Which moment from TOKEN2049 stood out most to you?

LedgerLossesNear90Million

39.59k Views310 Discussing

GateWCTCS9GlobalTradingCompetition

34.71k Views5.2k Discussing

View More