Square
Following
Hot
News
Profile
Share your thoughts
placeholder
Article
Layout: Bitcoin, Ethereum, Dogecoin
live-cover
LIVE880
  • 4
$RIVER Always keep a calculator at hand. RıVER+RıVER 3L+RıVER 3S = the resulting figures are the figures that make up the coin’s price
post-image
RIVER-1.66%
$XPL #XPL
Rising towards resistance of symmetrical triangle.
Breakout could follow our projection for a solid bullish rally✍️
XPL+7.58%
  • 1
Intraday, Ethereum pulled back toward around 2480, hitting a low of 2322 before recovering and rebounding, but the broader bearish trend remains unchanged. The rebound is only a brief bounce during the decline, with clear overhead selling pressure.
From the current chart, the main bearish structure on the daily timeframe remains intact. This rebound is merely a brief recovery after the rapid dip, while MACD remains bearish.
On the 4-hour timeframe, the price has risen close to the upper Bollinger Band, while bullish momentum is gradually fading and the rebound is weakening. On the 1-hour timef
post-image
ETH+1.52%
$CORE Everyone, do you think it will reach 2u?
post-image
CORE+0.90%
Bitcoin’s Long Term Cycle Chart Points to a Bigger Question: Are We in Another Accumulation Zone? 🙄
Bitcoin’s historical price cycles show a recurring pattern: major rallies, deep corrections, and long recovery periods.
The chart highlights previous peaks near $19,700 in 2017, $69,000 in 2021, and $126,000 in 2025, alongside earlier areas that some traders viewed as accumulation zones.
Now, the key question is whether the current price structure represents another opportunity to accumulate or whether the cycle is changing.
I think that the Historical patterns can offer useful context, but the
post-image
BTC+0.31%
10.16 Gold $XAU Recent Strategy Gold has been moving sideways within this range since falling at the end of September, with 4220 on the upside and 4110 on the downside. We have gradually sold high and bought low several times here.
Here is what we are doing now: 1. Short-term strategy: go long at 4100, exit around 4200, with a hard stop-loss at 4020. 2. After playing a few short-term rounds, switch to a long-term position (you can choose PXAG due to the high weekend fees). The unchanged point for both long-term and short-term trades is going long at 4100 with a stop-loss at 4020; the only dif
post-image
XAU+1.57%
🚀 GT/USDT Technical Insights: Is GateToken Preparing for a Bullish Reversal at $10.00 Support?
Pair: GT/USDT (Spot)
Current Price: ~$10.42
24h Range: $10.00 – $10.45
24h Volume: ~67.70K GT (~$691.81K turnover)
📊 1. Key Technical Breakdown Across Timeframes
1-Hour Chart (Short-Term Recovery):
GT tested strong psychological support around $10.00 before staging a clean V-shaped rebound back above $10.40.
Short-term EMAs (EMA5 at 10.38 and EMA10 at 10.33) are sloping upward, crossing above the short-term Moving Averages, signaling early bullish momentum in micro-timeframes.
MACD has fli
GT+0.09%
  • 3
are cats gonna end up trading better than pigs?
post-image
The answer is always hidden in the process that time brings. I’ve already made it extremely clear—the hints have been laid out plainly. Since June, it has felt exactly like hitting whatever I aim at and winning every battle; there’s only one word for it: “awesome”!
$BTC #美国9月CPI超预期
BTC+0.35%
🧑‍🍳 I touch crazy to get something done…and we all become friends 🫢
$SKHY
The memory market is straight out of the hog cycle: prices rise, capacity expands; capacity expands, the market crashes; the market crashes, production is cut; production is cut, prices surge again. The entire industry is now pushing hard to ramp up production. If AI demand can’t outrun capacity, beware of the accelerated version of “storage means death” turning into “storage means king.” Those holding positions should wait for the November earnings reports, sell into the rebound, and keep something in reserve. Spend less time scrolling short videos—the sentiment is even more volatile th
post-image
SKHY-0.94%
Funding rates are negative, yet open interest is surging? This GTC rebound is about to leave shorts roasted! Long. Trading parameters: Entry: 0.19801 - 0.20013Target 1: 0.2100Target 2: 0.2187Exit: 0.19207Start trading from here. The coins I’m watching today include $ZEC and $SIREN .
post-image
GTC
GTC芝麻币
Gate.Fun
MC:$0.1Holders:1
0%
ZEC+8.75%
SIREN+3.41%
$SNDK
Key levels respected; bounced from the $1,279.29/share support zone
I will only pick this at $995.69/share, or I leave it
#NFA
SNDK-0.56%
$SKY
SKY and LUNA look like they were cut from the same mold. Once the flywheel starts turning, SDEV follows, and they rise like dancing twins💃. But as soon as the wind shifts, the two immediately drag each other down, falling like conjoined twins. History has a way of delivering a sudden roundhouse kick when things are at their most euphoric; only after the bubble bursts do people slap their thighs and shout, “So that’s what happened”😅.
post-image
SKY+0.71%
peak lighting on the streets of north kolkata
BOUNDED FOR $10:
the $ICP wyckoff accumulation should be able to take the price to $10 just for short tem targets
post-image
ICP+2.10%
CPI Comes in Hotter Than Expected
live-cover
LIVE76
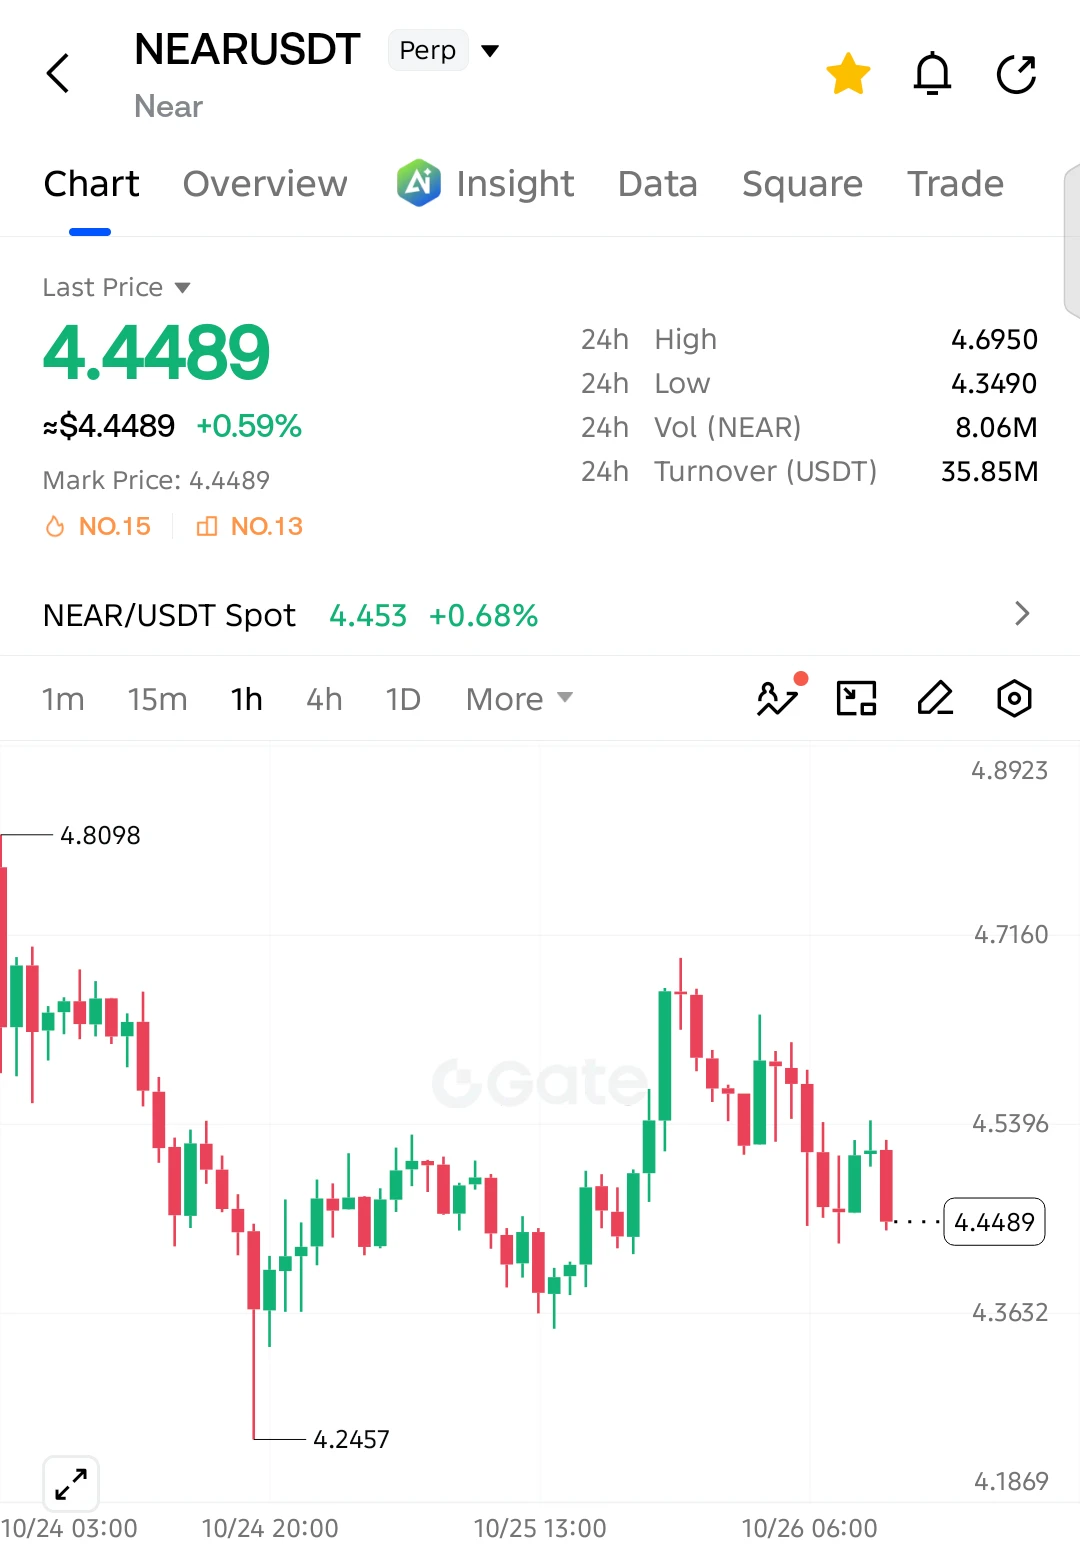
$NEAR NEAR Breaks Out of a 4-Year Descending Channel: TP1: $11
NEARUSDT
Weekly Time Frame:
NEAR (1W, log scale) is breaking out of the descending channel that has defined price action since the 2022 top, and the weekly candle is now pushing above the upper boundary.
What the chart shows:
After the 2022 high (~20.6), price spent years in a descending channel, bottoming around the 0.9 area in early 2026.
Since that low, price has risen sharply and is now trading at ~5.4, above the channel’s upper trendline.
The breakout is happening at the 2024 volume profile POC (~5.2), so the trendline and a h
post-image
NEAR+10.25%
Those who went long on SanDisk around 1280 should reduce their positions around 1440.
$SNDK
post-image
SNDK-1.34%
Load More

Join 40 M users in our growing community

⚡️ Join 40 M users in the crypto craze discussion

💬 Engage with your favorite top creators

👍 See what interests you

Trending Topics

USSeptemberPPIBeatsExpectations

91.35k Views1.88k Discussing

US September PPI came in at 6.3% YoY, well above the 5.3% market expectation, pointing to renewed producer-side inflation pressure. Weekly jobless claims were 199K, broadly in line with forecasts. Could hotter inflation further reduce room for rate cuts, and what does it mean for $BTC, US stocks, and gold?

DrLinHanSpeaksAtOxfordUnion

135.63k Views1.86k Discussing

JapanAndKoreaStocksPlunge

47.27k Views1.76k Discussing

View More