
Square
Following
Hot
News
Notifications
Profile
Share your thoughts
placeholder
Article
$EDGE Short entry! Clear resistance overhead! Short now to catch a pullback! Target: 0.36. If you’re not in a position, short at market! Welcome aboard!
post-image
EDGE-7.65%
  • 1
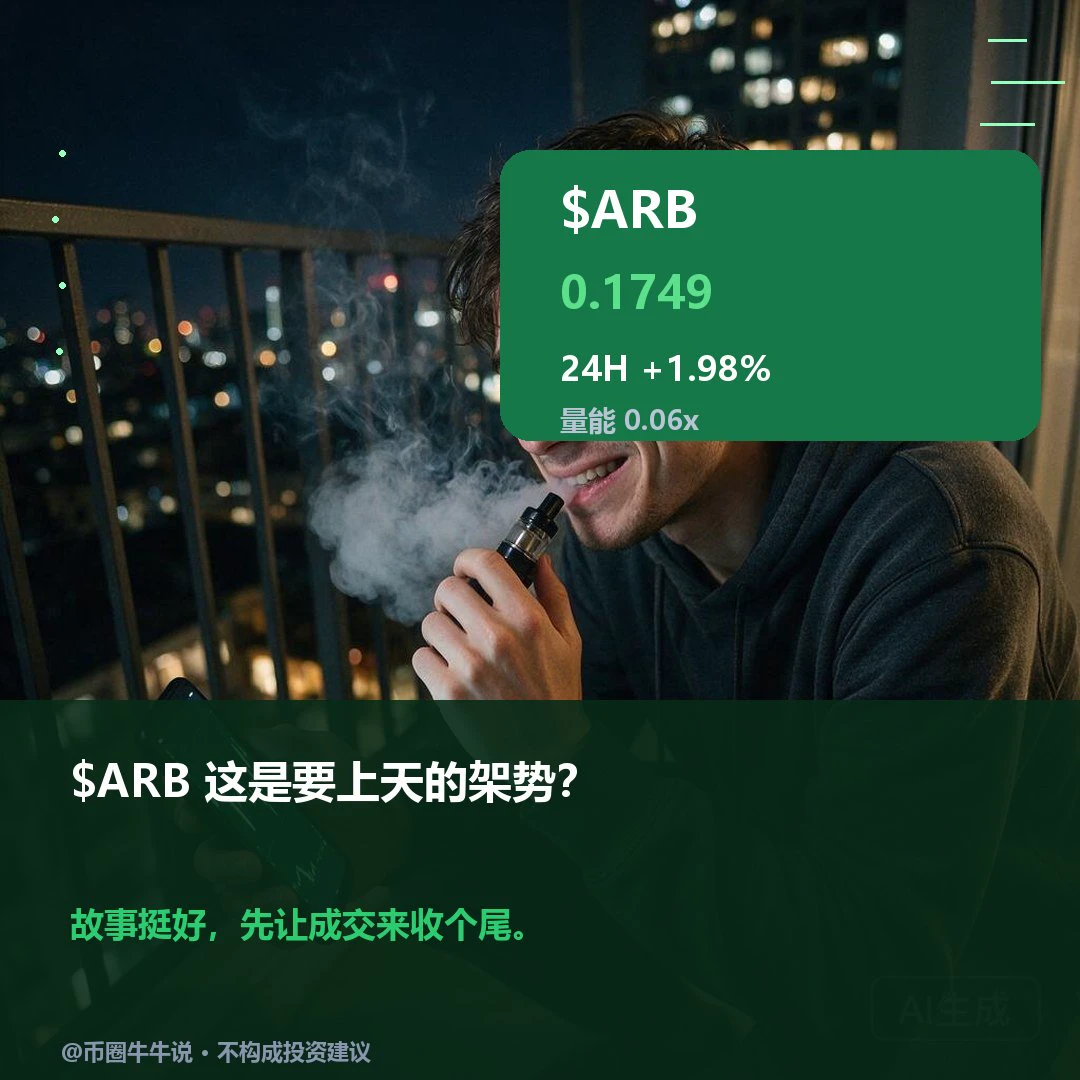
$ARB Currently at 0.1749, up 1.98% over 24H. The 1H structure is weak, with RSI at 45 and price slightly below EMA20. The 4H structure is stronger, with RSI at 60 and price above EMA20. The timeframes are clearly diverging, and the short-term direction remains unclear.
Conditional watch: If price can hold above the 0.188 resistance level, monitor for continued bullish momentum. If it breaks below the 0.1699 support level, the short-term structure will weaken.
The key point to check in the next review is whether price can hold above the 0.188 resistance level. The setup is invalidated if price
post-image
ARB+1.17%
Trenches
Libra
L
bade
b
Libra
0xd2...4444
Market Cap
$.
Change
.
24h Vol
$.
Holders
.
牛逼
牛
bade
b
牛逼
0x96...7777
Market Cap
$.
Change
.
24h Vol
$.
Holders
.
PIEVERSE
P
bade
b
PIEVERSE
0x0e...25a9
Market Cap
$.
Change
.
24h Vol
$.
Holders
.
STONK
S
bade
b
STONK
6GmA...UNgx
Market Cap
$.
Change
.
24h Vol
$.
Holders
.
ON
O
bade
b
ON
0x0e...1d48
Market Cap
$.
Change
.
24h Vol
$.
Holders
.
Yang Guang bit | November 10: ETH weak after oversold rebound; short with the trend at resistance
【Today’s Strategy】
Entry timing: Price rebounds to 2140–2160
Stop-loss: 2180
Take-profit targets:
First target: 2090–2070
Second target: 2055–2030
【Key Takeaway】
Easing inflation concerns driven by falling oil prices fueled a sharp rebound in U.S. stocks on Monday, with the Dow up 2.15%, the S&P 500 up 2.35%, and the Nasdaq up 2.74%, signaling a clear recovery in risk appetite. But the key divergence is that while U.S. stocks surged nearly 3%, crypto remained weak. ETH rebounded to 2140 before fal
post-image
ETH-1.23%
  • 1
11.10 ETH Trade Setup
Market Analysis

ETH plunged rapidly to a low of 2050.32, then stabilized and recovered. The current price is 2126.81. The lower Bollinger Band provided effective support, and the MACD bearish histogram continues to contract, indicating fading downside momentum and an oversold rebound structure following the sharp drop.
Resistance is at 2200, with strong resistance at 2250.

Entry Range

Scale into long positions in the 2110–2120 range. Enter only if a pullback does not make a new low; do not chase the price higher.

Stop Loss

2090. A break below the low of this rebo
post-image
ETH-1.23%
Right now, buying spot is the best choice👍
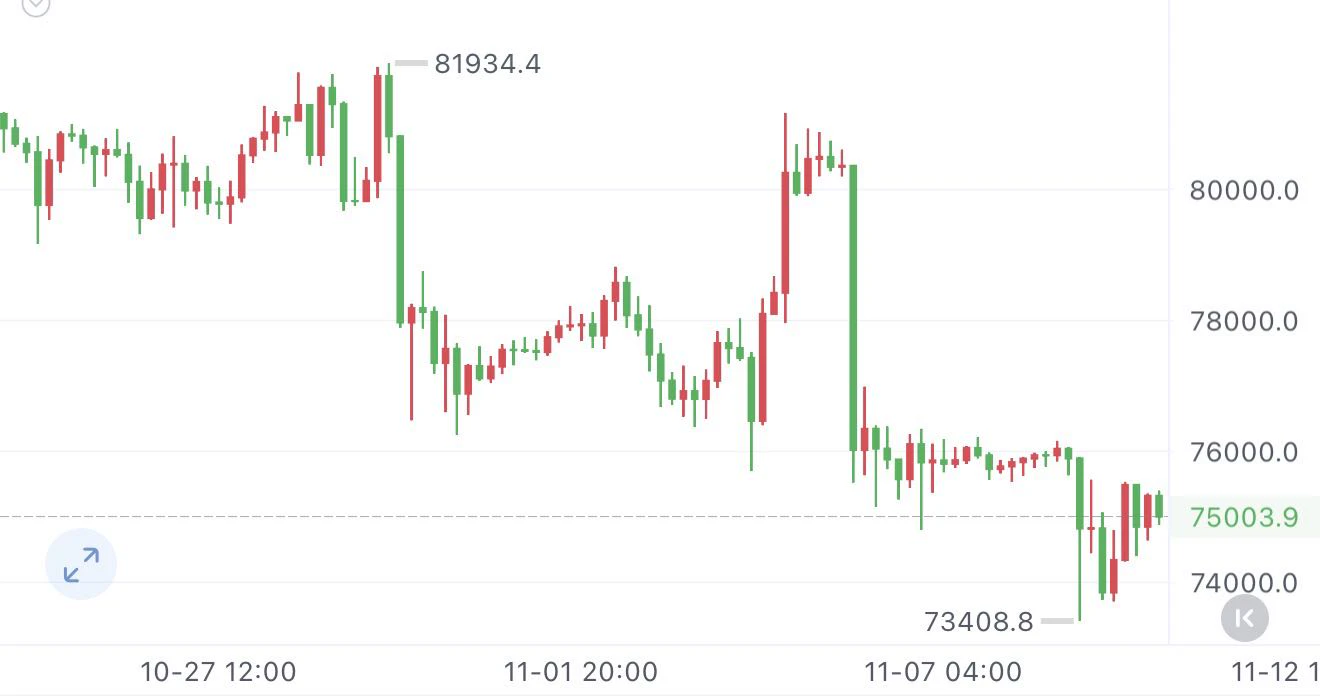
As long as 74000 support holds intraday, go long; if it breaks, there's not much to trade for today $BTC
post-image
BTC-0.65%
U.S. CPI set to ignite markets at 21:30 tonight! If inflation exceeds expectations again, a December rate hike may really be unavoidable?

At 21:30 tonight, global financial markets are about to face another stress test! The U.S. October CPI is about to be released, and investors have just one question on their minds: Has inflation actually come down?
If the data comes in above expectations again, bets on a December rate hike by the Fed are likely to heat up further. After all, inflation is like a disobedient child: its parents have told it several times to cool down, but it keeps running a fe
SNDK+6.27%
  • 15
U.S. stock futures were little changed on Monday evening after Wall Street closed sharply higher, with technology shares rebounding from last week's steep selloff, as investors awaited a key consumer inflation report due on Tuesday. $CSCO
post-image
CSCO+5.15%
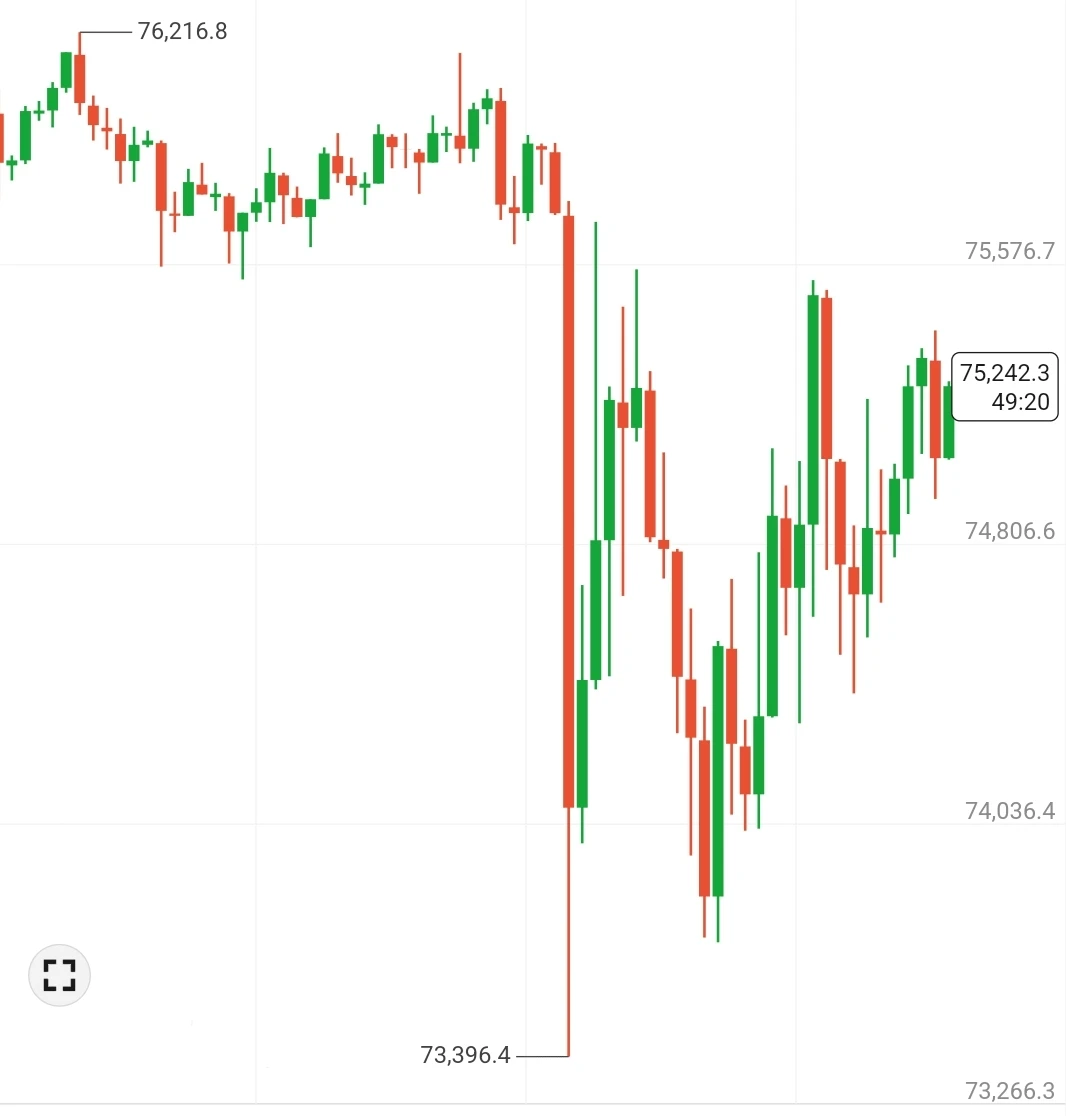
11.10 Bitcoin Market Analysis$BTC

Bitcoin formed a long lower wick on the one-hour chart, clearly testing low-level support. The bullish divergence has played out, and a rebound is now underway. Candles are gradually climbing along the Bollinger midline, with lows moving steadily higher as short-term bullish momentum builds. The price has remained below the upper Bollinger Band, suggesting the market is about to choose a direction. It is currently in an accumulation phase, building a base through consolidation; a breakout on increased volume would be more likely to open up room to the upside
post-image
BTC-0.65%
11.10 BTC Analysis
BTC made the expected rally and pullback! After meeting resistance at the highs, it retested support and rebounded again. It is currently trading just below the upper Bollinger Band. The bands are opening upward. Although bulls have the short-term advantage, overhead resistance is heavy, and a rally could easily meet resistance and pull back.

Key levels: Support is at the middle Bollinger Band at 74900, with strong support at 74500. Short-term resistance is in the 75300 - 75500 range.

Today's short strategy: Patiently wait for a rally into the 75500 - 75800 range, then go
BTC-0.65%
Has finding a job become that difficult?
You even have to pay to apply for jobs.
post-image
Whoa! Did the Grok bot reset itself?
I remember usage was already at 85% yesterday. I woke up this morning and it had only used 2%? Go check your Bots
@bot
post-image
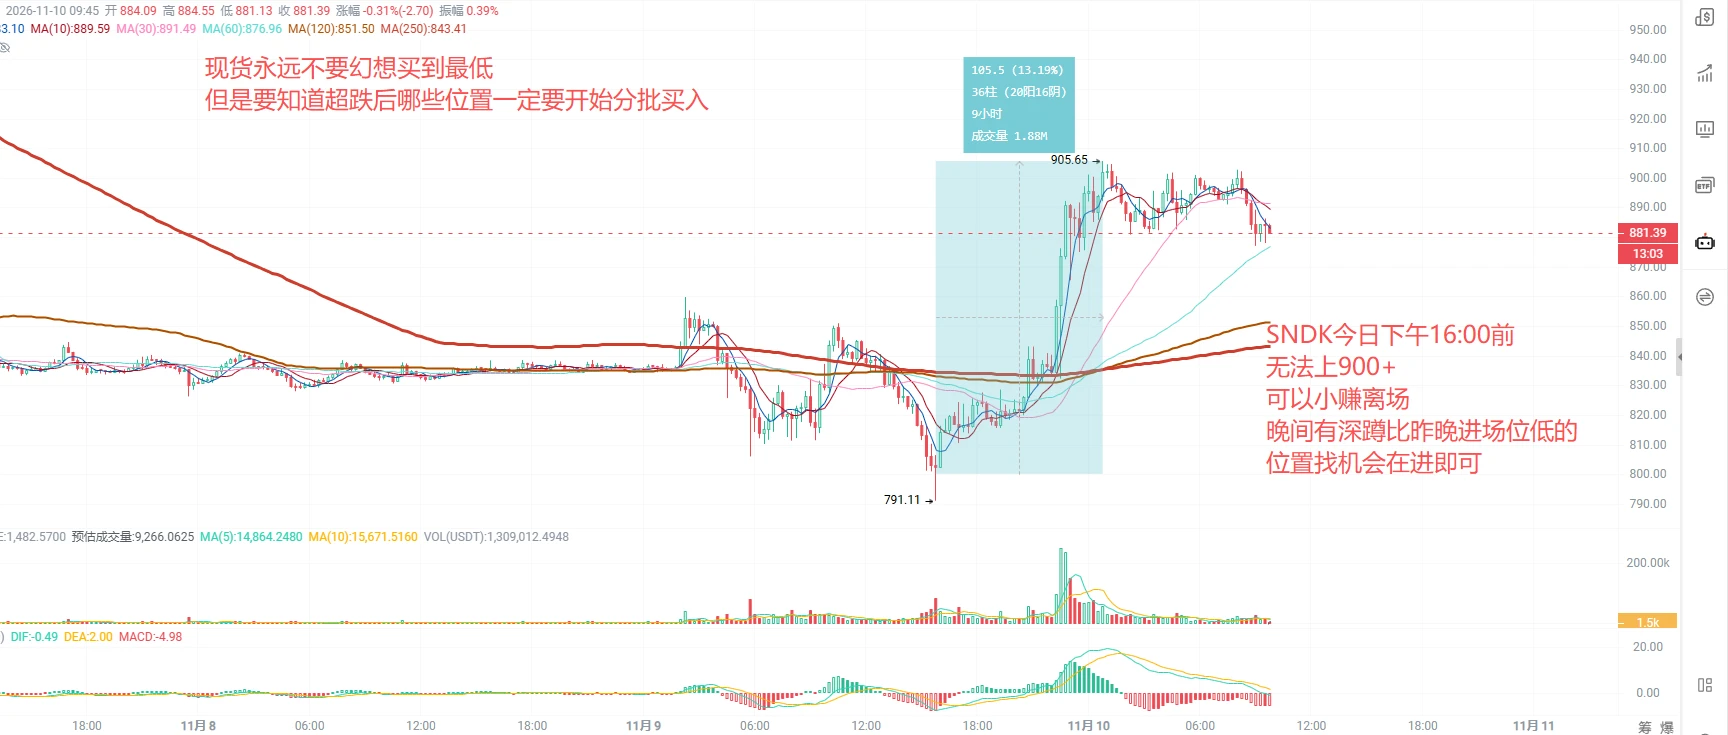
2026.11.10 BTC/ETH/XAU/SNDK Analysis
The market was fairly steady overnight, holding for now without a higher-volume sell-off, and sentiment has eased. I bought one lot of SNDK last night. It has not hit the first take-profit level yet, but at 3%+ there may be an opportunity to trim the position and move the stop up to protect gains. If it reaches 900+ intraday, you can execute this plan; if you get stopped out at breakeven, simply look for a chance to re-enter at a lower price!
During the intense negotiations between the US and Iran, XAU is slowly trying to move higher. Its price reflects exp
post-image
ETH-1.26%
BTC-0.67%
SNDK+6.27%
XAU+0.38%
  • 2
GM, this millet cake is so good!
post-image
#美股财报季 #Gate股票暢聊季 CoreWeave (CRWV) Earnings Preview—If revenue beats expectations, that only shows that demand for AI computing power is still there. The stock is unlikely to rise on that alone. The market will continue to price it as “high growth, high risk.”

How the stock could move after earnings
Revenue meets expectations, guidance unchanged: The stock may rise briefly, then pull back. Second-quarter revenue doubled year over year, yet the stock is still down about 50% for the year.
Losses narrow, financing costs fall: Bond yields retreat, giving the stock more room to rebound.
Guidance i
CRWV+5.69%
NVDA-4.34%
Layout: Bitcoin, Ethereum, Dogecoin
live-cover
LIVE911
  • 1
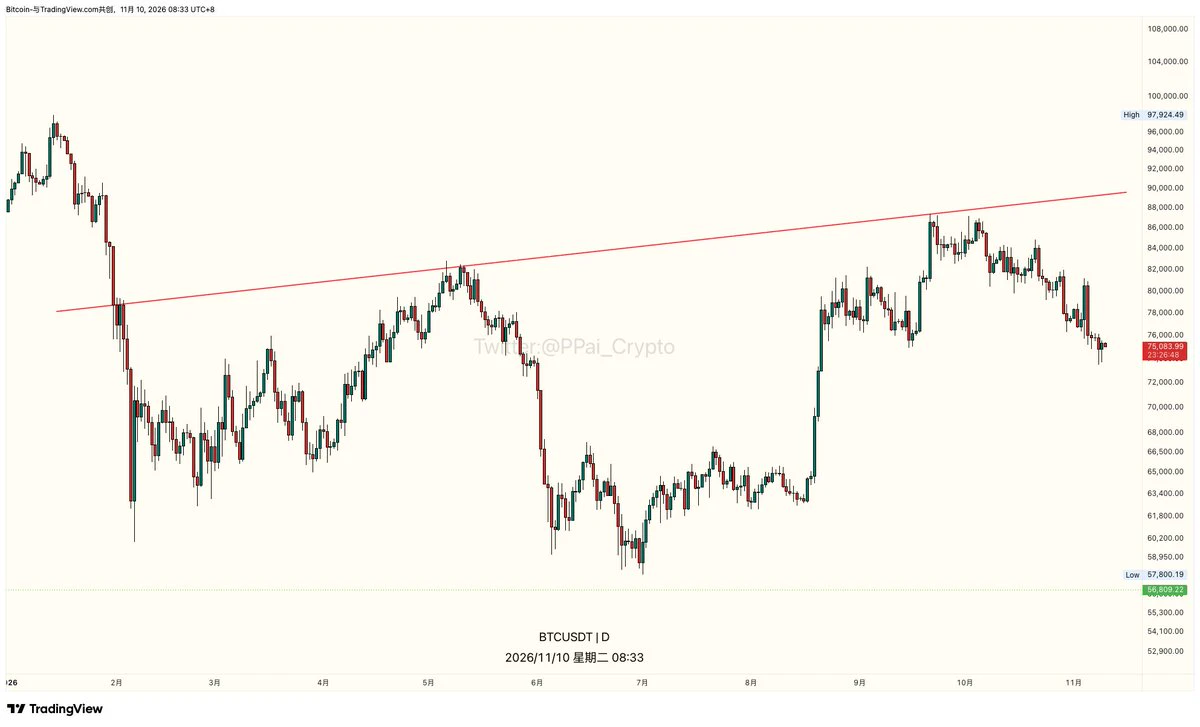
I went through these weekly candles side by side.
Down for four weeks, and it finally turned green this week, but it’s recovered less than half a point.
26,000 coins on the day it got dumped; only 16,000 last night.
Price climbed back to 75K, but volume didn’t follow.
New York gold is at 4137, up another 0.5 points overnight.
Crypto’s total market cap shrank 1.3 points along with it. The money hasn’t come back here.
CPI tonight at 21:30.
I’m not touching longs. If it gets above 78K, call me wrong.
post-image
Prediction Markets NBA Trading Championship: Earn Up to 10,000 USDT per Person and Share a 65,000 USDT Prize Pool https://www.gate.com/campaigns/6846?ref=VLARBF1YAG&ref_type=132
post-image
Load More

Join 40 M users in our growing community

⚡️ Join 40 M users in the crypto craze discussion

💬 Engage with your favorite top creators

👍 See what interests you

Trending Topics

USCPIDataIncoming

47.01k Views2.12k Discussing

The U.S. October CPI report will be released on November 10 at 8:30 a.m. ET. September CPI came in at 3.7% year over year, and markets will be watching closely for signs that inflation is cooling, especially in core CPI. A softer-than-expected reading could strengthen rate-cut expectations, while hotter inflation may pressure risk assets through higher Treasury yields and a stronger dollar. How do you think this CPI print will move $BTC, U.S. stocks and gold?

KoreanStocksJumpOver5%

492.08k Views4.8k Discussing

USIranTalksShowNewProgress

4.87k Views1.2k Discussing

View More