
Share crypto content and earn up to 60% commissions through content mining.
placeholder
gatefun
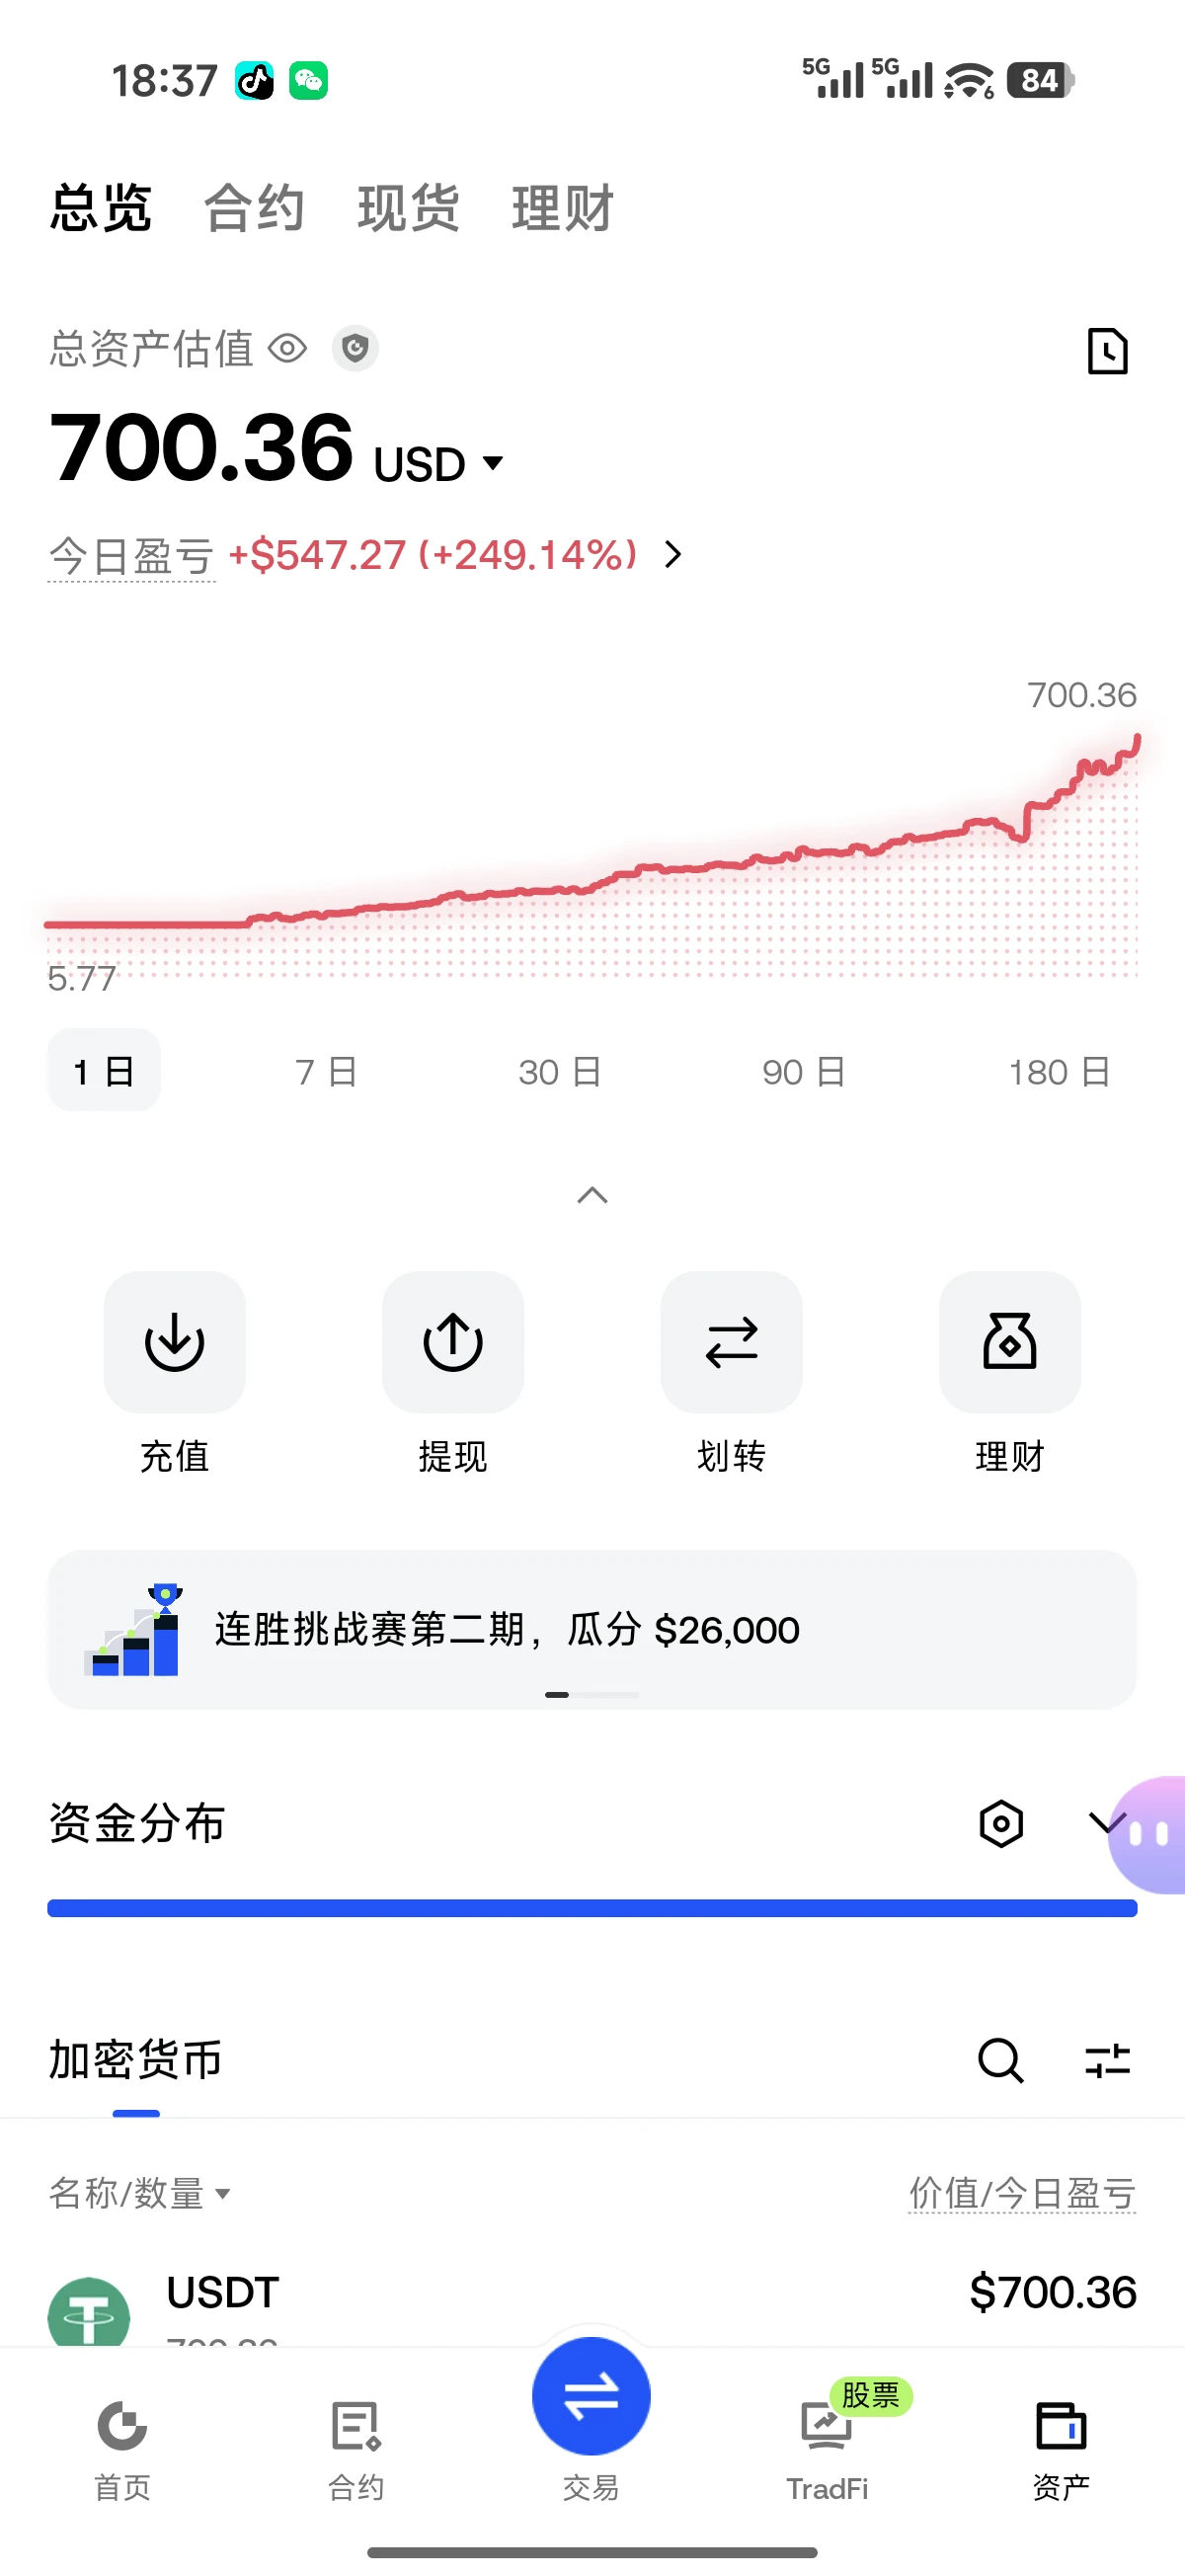
This trend is so obvious I don’t even have to think—the account is partying on its own💃
During the repeated intraday swings, $MU lacked support; with no one buying on the way up, this kind of low-volume rebound is just handing easy pickings to shorts. I had everyone follow with a small short position at 946.04📉
Now at 908.86, +278.85%, feels great, brothers😤 This profit is so satisfying, no one is allowed to say otherwise. As usual: close 70% first, set a protective stop for the remaining 20%, and let it run on its own—don’t give the profits back🏃
Don’t lose patience grinding through the r
MU-6.22%
ETH1.06%
DOGE-3.94%
View Original
post-image
  • Reward
  • Comment
  • Repost
  • Share
I wasn’t watching the charts or thinking about it—it was moving on its own, like it was working overtime for me. When I opened the market screen this morning and saw $2Z grinding along the bottom without breaking support, I knew exactly what to do. I immediately placed a long order at 0.04895. It felt great.
It has now climbed to 0.05663, and the +753.16% return says it all. This profit feels really good. I banked the bulk first, taking 80% in profit without hesitation; I’m holding on to the remaining 20%, raising the stop-loss to protect it above the entry price, and leaving the rest to the m
2Z-2.31%
ADA-2.74%
ZEC-3.14%
View Original
post-image
  • Reward
  • Comment
  • Repost
  • Share
Ethereum’s daily chart has staged a strong rally and reached a new high for this phase. After rising to 2549, it came under pressure and pulled back, currently maintaining a high-level consolidation pattern. The Bollinger Bands are opening upward, and the overall bullish trend remains intact!
On the 4-hour chart, the price pulled back after rising to touch resistance at the upper Bollinger Band, and is currently trading above the middle Bollinger Band. Short-term bullish momentum has eased somewhat,
On the 1-hour chart, after coming under pressure at higher levels, the Bollinger Bands have nar
ETH1.06%
View Original
post-image
  • Reward
  • Comment
  • Repost
  • Share
I switched to the background to reply to a message, and when I came back, it had already done the job.

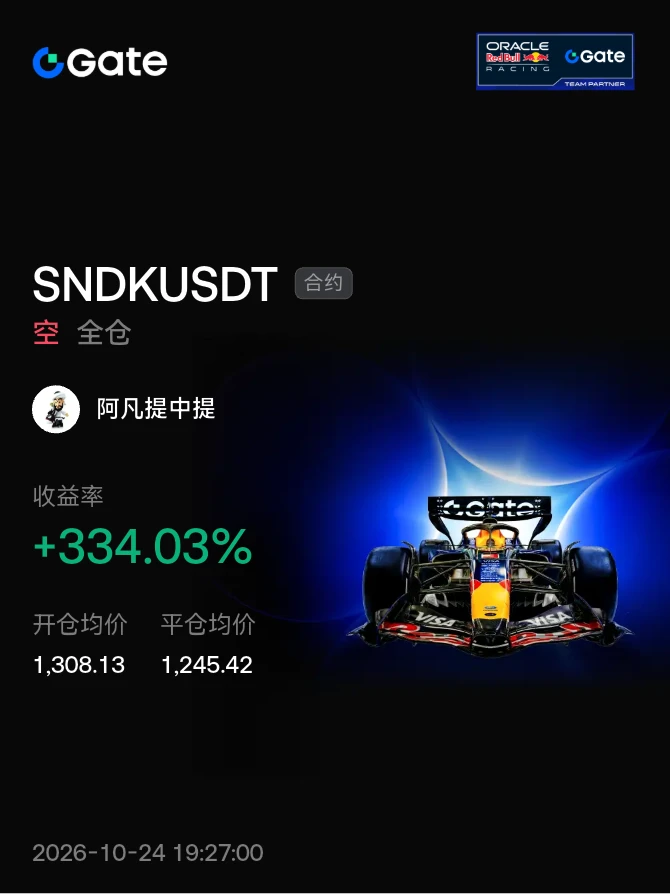
A few days ago, it was still moving sideways around 152.22 before bed, with clear resistance overhead. Every rebound fell just short, so I knew the high-level short could be taken. When I opened the chart in the morning, it had gapped straight down to 108.45. This trade paid nicely.

+1385.38% realized. I closed 70% first, moved the stop loss on the remaining 30% closer to the entry price, and will let profits run if it keeps falling without giving them back if it rebounds.

Don’t let pro
SNDK-8.89%
DOGE-3.94%
View Original
post-image
  • Reward
  • Comment
  • Repost
  • Share
On the 4-hour chart, $HOME /USDT is brewing a hunt. Dare to take it?
$HOME /USDT - SHORT
Trading Plan:
Entry: 0.00619 – 0.00625
SL: 0.00648
TP1: 0.00603
TP2: 0.00590
TP3: 0.00571
Why pay attention to this setup?
The trend is clearly downward, with bears in control on the daily timeframe. The current price of 0.00622 is exactly a “bull trap zone” during the rebound. RSI(15m) at 41.91 shows that short-term downward momentum remains, while ATR at 0.000107 indicates that volatility is expanding and acceleration could come at any time. Why now? Because the price is running along the lower edge of t
HOME1.46%
View Original
post-image
post-image
  • Reward
  • Comment
  • Repost
  • Share
$NVDAG $NVDAG On 4H, down 4.44% at $208.78
We are at the critical $207.95 support. Oversold with an MFI of 11.
Going long is risky until there is a close above the $214.44 SuperTrend.
My view: If $207.95 breaks, $205 -> $200
If a bounce comes, $214 is the first resistance.
Has Nvidia bottomed or will the decline continue? Thoughts? 👇
#NVDA #NVDAG #StockOpinion
NVDAG-4.38%
View Original
post-image
  • Reward
  • Comment
  • Repost
  • Share
Crypto Market Updat
gate liveLIVE
82
live-coin
  • Reward
  • Comment
  • Repost
  • Share
The hand that set a stop-loss a few days ago trembled slightly; this morning I realized that was unnecessary filial piety😂. A few days ago, before bed, $OKB was still at that level. I checked it repeatedly—the key level hadn’t broken, and the key support was moving higher. This kind of pattern is most likely to produce a decent move. While everyone else was running, I instead felt that the opportunity had arrived.

Got in at 96.30; when I opened the chart this morning, it was at 115.21, +482.38%. Nailed it, brothers. Getting the rhythm right is more important than anything else—this big bite
OKB3.09%
XRP-2.97%
SNDK-8.89%
View Original
post-image
  • Reward
  • Comment
  • Repost
  • Share
$ONG Signal】Long + 1H breakout momentum
$ONG 1H RSI 73.75, MACD histogram 0.0010 continues to expand, and price at 0.08207 has moved above the 1H Bollinger upper band, with volume surging from 15M to 106M. The 4H EMA20 is 0.0745, with the current price above it, and the moving averages are in a bullish alignment. Order book depth imbalance is -5.4%, with ask-side depth slightly dominant, while the price continues to rise. The funding rate is -0.002%, with shorts continuing to pay, and OI remains stable without significant position closures. The current risk-reward ratio is 1.5, offering moder
ONG13.84%
BTC1.65%
ETH1.06%
SOL2.43%
View Original
post-image
  • Reward
  • Comment
  • Repost
  • Share
Crypto Trading Market
gate liveLIVE
67
  • Reward
  • Comment
  • Repost
  • Share
August 25 Gold Morning Outlook
The buy-on-dips approach during the midnight session played out as expected. After a pullback to support, gold rebounded again. The support zone identified at midnight effectively held the market, with the levels closely matching price action.
Technical analysis: The 1-hour Bollinger Bands are opening upward, and gold is trading between the middle and upper bands. The 30-minute Bollinger Bands have turned upward, with price holding above the middle band and KDJ rising again. The bullish structure on higher timeframes remains intact, the short-term correction has
GLDX0.90%
PAXG1.48%
View Original
post-image
  • Reward
  • Comment
  • Repost
  • Share
I was just about to go to the forum and rant, but then I saw my balance. Never mind—the market is always right. 😤
During the repeated intraday swings, $ESPORTS fell just short on every rebound, with clear resistance overhead. I remained bullish the whole time, so I didn’t rush to close my staggered short positions—I held on.
Today, it gave us the answer directly, dropping from 0.04289 to 0.01456, with +1300.56% realized. Feels great, brothers.
Position management: Take 80% off the table first, set a protection level for the remaining 20%, and leave the rest to the market. Take profits when i
ESPORTS-3.59%
ZEC-3.14%
BTC1.63%
View Original
post-image
  • Reward
  • Comment
  • Repost
  • Share
$MSFT #MSFT
After a textbook 36% vertical squeeze in early August, Microsoft has entered a disciplined 9-day cooling phase, holding the $480 zone while resetting momentum.
MSFT (Microsoft Corp) trades at $487.33, up +4.00 (+0.82%) on the day, with After-Hours at $487.11 -0.22 (-0.04%). The session printed High $490.60, Low $481.86, Open $483.24, Prev Close $483.33, Range % 1.80%. Two forces are behind the resilience: dip-buying after the $512.80 top on Aug 12th and rotation into quality software while Nvidia Stock Falls 2% on Monday Before Q2 Earnings headlines pressure semis. With P/E Ratio
MSFT0.82%
post-image
  • Reward
  • 7
  • Repost
  • Share
User_any:
LFG 🔥
View More
With this trend, I don’t even need to think—the account is partying on its own. When the market kept oscillating intraday, everyone thought it was hopeless. I watched the chart grind along the bottom without breaking down, and that told me everything: if you can hold steady, you can wait it out. $BTW went from 0.377246 to 0.45427, +201.6%. It really dragged at first, but the breakout feels great. The market is waited out, and profits are held onto. Have a strategy before the market opens, discipline during the session, and reflection after it closes. I’m taking 75% off this round; the remaini
BTW4.21%
XRP-2.97%
DOGE-3.94%
View Original
post-image
  • Reward
  • Comment
  • Repost
  • Share
$TOAD CODE
post-image
  • Reward
  • Comment
  • Repost
  • Share
I was just about to go to the forum and rant, but then I saw my balance. Forget it—the market daddy is always right🙏.

During the repeated intraday swings, $BASED was dumped and pumped in turn, making many people flip-flop, but the bids in the order book kept getting stronger. The 0.06253 level was tested repeatedly without breaking, building a base without breaking down—that’s the confidence to hold steady. I reminded myself at the time: the chart may look ugly, but as long as the price hasn’t broken down, don’t scare yourself.

Later, it rallied from 0.06253 to 0.07225, securing +750.67%.
BASED-3.17%
SNDK-8.89%
LAB-1.92%
View Original
post-image
  • Reward
  • Comment
  • Repost
  • Share
I originally wanted to cut my losses and sacrifice the position to the market, but the sacrifice never happened—the meat roasted itself. When I opened the chart this morning and saw it slowly climbing, I froze for a moment. The reason I dared to enter during the intraday plunge was that every sell-off was met by buying, while the bottom moved sideways all night as funds quietly entered. The level I posted at the time was 0.0581, and some people in the comments even complained that it was too slow. Now that it has reached 0.0711, +225.5% has given us the answer directly. Feels good, brothers. I
SOL2.34%
LAB-1.92%
View Original
post-image
  • Reward
  • Comment
  • Repost
  • Share
This trend is so obvious I don’t even need to think—the account is dancing on its own. 💃 As the market repeatedly swung during the session, I had just one feeling watching the chart: every push upward was always one step short, and each rebound had less and less momentum. This isn’t a breakout; it’s fishing, with a strong whiff of luring in longs. 🎣 Held onto the short, entered at 0.1345, now at 0.1266, +117.11% secured—feels amazing, really nailed the rhythm. 😎 Position management: closed 70% of the bulk position first, with the remaining 30% protected at breakeven. Let it run slowly on it
ADA-2.74%
BTC1.63%
View Original
post-image
  • Reward
  • Comment
  • Repost
  • Share
$TSLA #TSLA
Tesla is giving back a slice of its 22% recovery after running straight from the July capitulation into resistance near $365.
TSLA (Tesla, Inc.) trades at $348.94, down -13.94 (-3.84%) on the day, with After-Hours at $348.25 -0.69 (-0.19%). The session printed High $363.24, Low $348.28, Open $361.41, Prev Close $362.88, Range % 4.12%. Two forces are behind the fade: a double rejection at $363-365 after the $362+ breakout attempt on Aug 25th, and broader EV and growth profit-taking. With P/E Ratio TTM at 323.101 and Mkt Cap at $1378.15B, the move shows momentum traders booking gain
TSLA-3.84%
post-image
  • Reward
  • 9
  • Repost
  • Share
User_any:
LFG 🔥
View More
$ANF
The long term outlook is very strong. It was rejected from the correction band
ANF2.99%
post-image
  • Reward
  • Comment
  • Repost
  • Share
Load More

Join 40 M users in our growing community

⚡️ Join 40 M users in the crypto craze discussion
💬 Engage with your favorite top creators
👍 See what interests you
  • Pinned