






#每周来晒 #BTCETFOutflowsContinue Tracking the Liquidity Shifts at the $76,042 Boundary
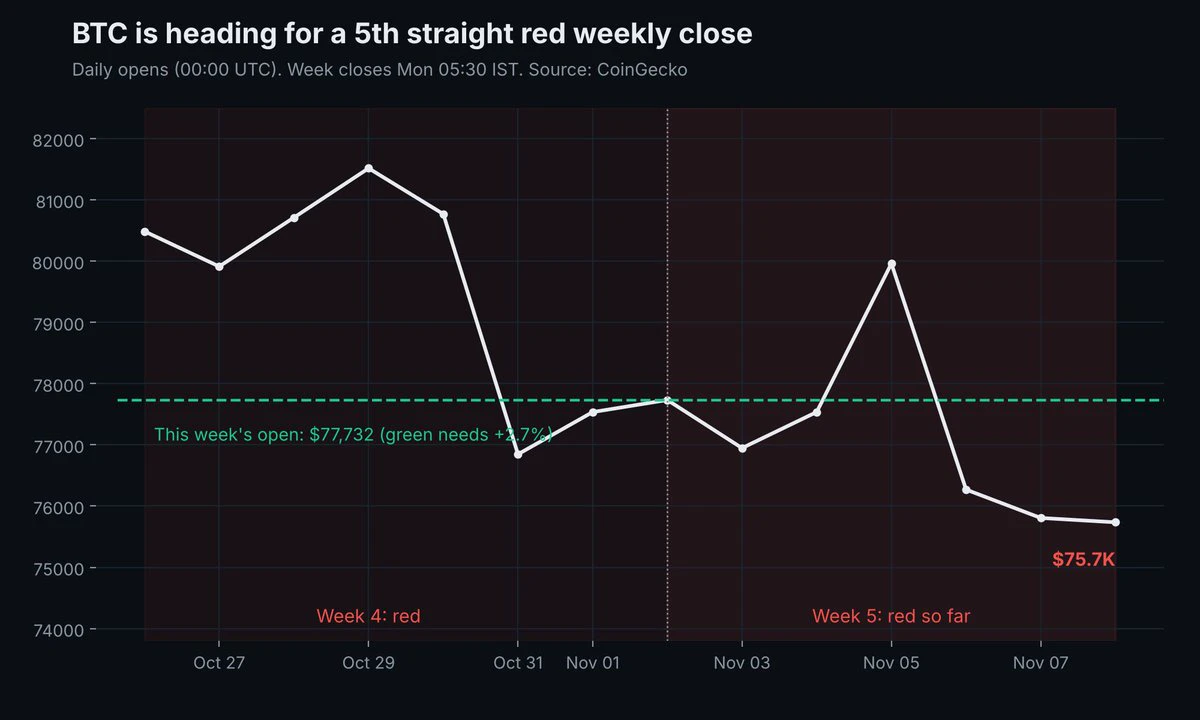
The digital asset ecosystem is navigating a critical phase of capital repricing, driven by a sharp divergence between spot market resilience and institutional fund flows. Captured precisely at 11:18 AM PKT on Saturday, November 7, 2026, Bitcoin is trading firmly at the $76,042 zone, showcasing a robust structural defense against a week of intense Wall Street liquidations. Over the weekly cycle spanning November 2–6, U.S. spot Bitcoin ETFs registered an aggregate net outflow of approximately $922 million, forcing market participants to carefully evaluate the near-term strength of institutional demand. However, a deeper analysis of the daily order-flow deceleration suggests that the initial, high-velocity selling pressure may be undergoing structural exhaustion.
The latest data points outline a dramatic shift in the speed of institutional capital flight, hinting that the worst of the programmatic selling might be behind us:
• The Velocity Slowdown: On November 6, net outflows across the U.S. spot ETF landscape collapsed to a modest $51.7 million. This marks a massive deceleration from the previous session on November 5, which witnessed a severe $430.2 million withdrawal.
• Fund-by-Fund Fragmentation (Nov 6): The localized selling pressure was highly concentrated across three specific vehicles, with Bitwise's BITB shedding $20.5 million, Ark Invest's ARKB contracting by $20.1 million, and Grayscale's GBTC releasing $11.1 million.
• The Giant Standstill: Crucially, BlackRock’s IBIT and Fidelity’s FBTC the primary liquidity anchors of the institutional landscape printed zero net flows on November 6, stabilizing completely after suffering significant redemptions the day prior.
• The Institutional Baseline: Despite the $922 million weekly drain, the aggregate spot ETF infrastructure remains incredibly robust, maintaining a staggering $96.5 billion in combined net assets alongside $56.1 billion in cumulative historical net inflows.
Derivatives & Order-Flow Architecture
The resilient price action at $76,042 amidst nearly a billion dollars in weekly outflows highlights a deep structural absorption layer operating within the native spot market:
1. Spot Volume vs. Paper Redemptions
While ETF shares were being redeemed on legacy exchanges, native crypto exchange netflows turned deeply negative, meaning whales and long-term spot accumulators were actively withdrawing BTC into private custody. This on-chain absorption completely neutralized the selling pressure originating from traditional brokerage accounts.
2. Derivatives Reset and Funding Optimization
The derivatives market has capitalized on this consolidation to flush out late-stage, over-leveraged longs. Aggregate Open Interest (OI) has experienced a healthy, non-panic compression, while funding rates across premier trading venues have completely reset from overheated levels back to a neutral, sustainable baseline. This structural cleaning drastically reduces the statistical probability of a cascading liquidation event to the downside.
Macro Support and Resistance Boundaries
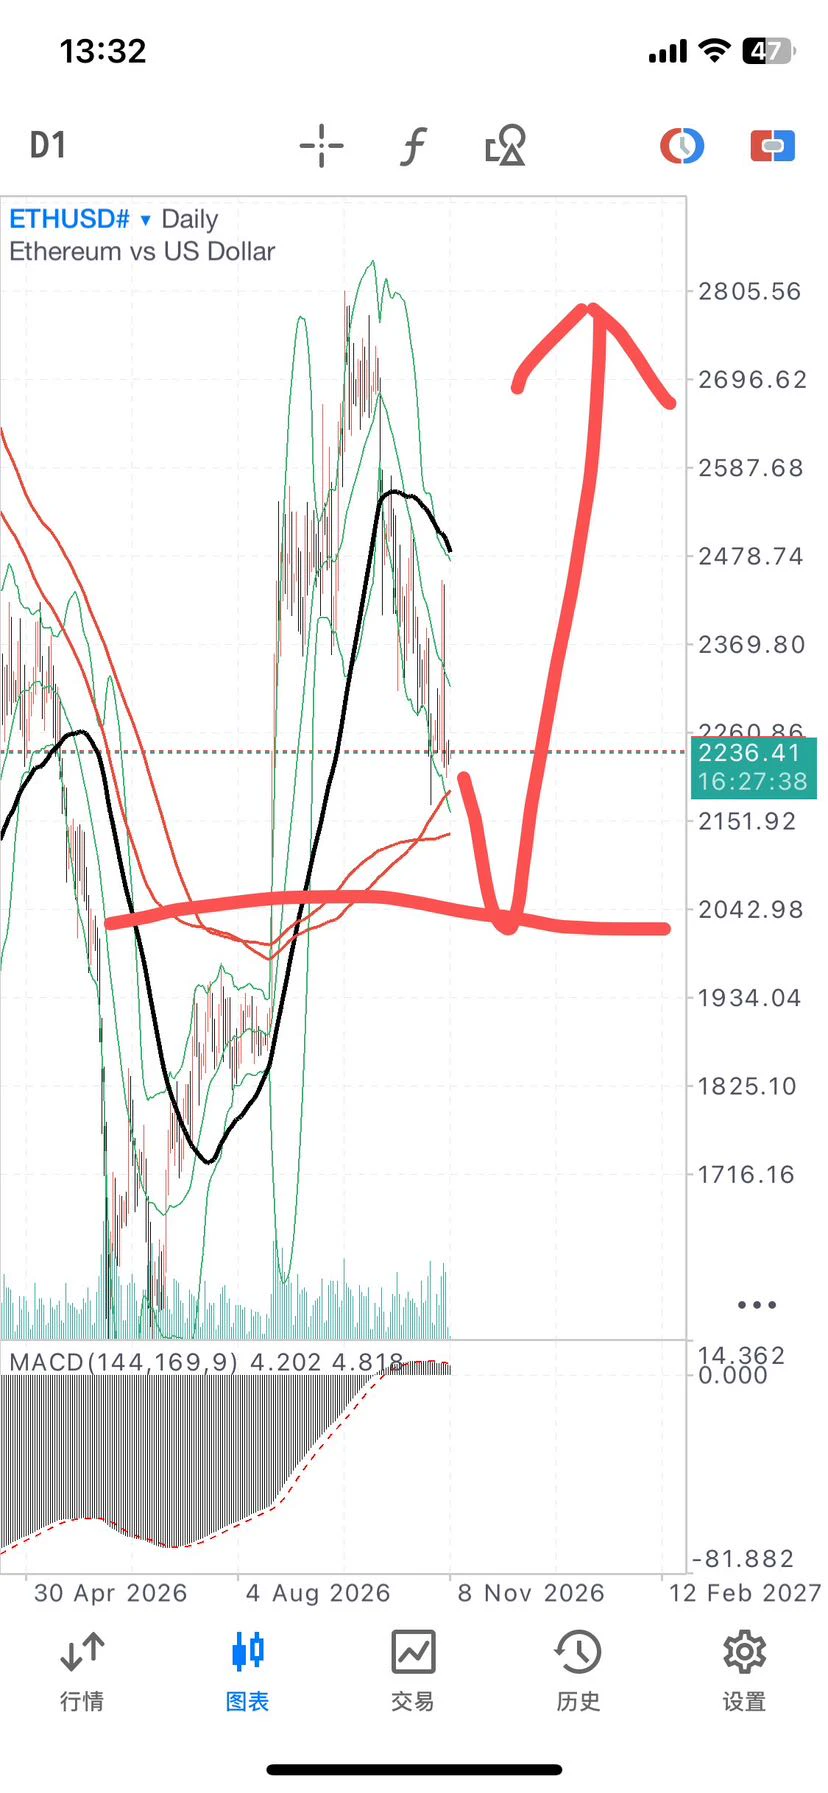
From a technical charting perspective, Bitcoin's ability to maintain its posture above $76k confirms that the structural bull market remains fully intact, bounded by two primary top-tier price levels:
🟢 Immediate Demand Cushion $75,000 to $75,300
• The Blueprint: This specialized localized zone serves as our primary line of defense. It represents a heavy structural volume node, a psychological breakout baseline, and a key confluence area for short-term exponential moving averages (EMAs). As long as daily candle closures remain securely above $75k, the immediate structural momentum favors the bulls.
🔴 Premium Technical Resistance Ceiling $77,900
• The Blueprint: On any immediate, news-driven short squeeze, the price action will face intense structural friction near the $77,900 mark. This level lines up perfectly with upper weekly Bollinger Band extensions and local order book ask-side liquidity blocks, requiring a significant surge in spot buying volume to decisively break and hold.
The core analytical question is clear: Is the sharp drop in daily ETF outflows from $430.2M to $51.7M a sign that selling pressure is easing, or are institutional allocators simply taking a temporary pause before pushing prices lower?
The hard numbers point firmly toward an easing thesis. The absolute stabilization of heavyweights like IBIT and FBTC indicates that the primary wave of institutional portfolio rebalancing has concluded. The fact that BTC did not break its key structural support despite a near-billion-dollar weekly outflow demonstrates immense underlying market strength.
• The Strategy: Utilize the current consolidation near $76,042 to scale into disciplined spot positions. Treat any potential retests of the $75,000 demand floor as a high-conviction buying opportunity, while remaining comfortably on the sidelines regarding high-leverage long positions until a clean daily close above $77,900 is verified.
Bitcoin is putting on a masterclass in structural strength, trading firmly at $76,042 despite facing nearly $922 million in weekly spot ETF outflows. While the headlines focus on the aggregate withdrawals, smart money is tracking the massive deceleration in daily selling pressure—which collapsed from a staggering $430.2 million down to just $51.7 million, with BlackRock's IBIT printing a complete standstill.
The native spot market's capacity to comfortably absorb these legacy redemptions while defending the $75,000–$75,300 support zone proves that structural demand remains incredibly healthy. This isn't a market to short on panic; it is a market to accumulate on discipline. Protect your capital, avoid high-leverage traps, and let the institutional consolidation cycle complete its work. #WCTCS9
The digital asset ecosystem is navigating a critical phase of capital repricing, driven by a sharp divergence between spot market resilience and institutional fund flows. Captured precisely at 11:18 AM PKT on Saturday, November 7, 2026, Bitcoin is trading firmly at the $76,042 zone, showcasing a robust structural defense against a week of intense Wall Street liquidations. Over the weekly cycle spanning November 2–6, U.S. spot Bitcoin ETFs registered an aggregate net outflow of approximately $922 million, forcing market participants to carefully evaluate the near-term strength of institutional demand. However, a deeper analysis of the daily order-flow deceleration suggests that the initial, high-velocity selling pressure may be undergoing structural exhaustion.
The latest data points outline a dramatic shift in the speed of institutional capital flight, hinting that the worst of the programmatic selling might be behind us:
• The Velocity Slowdown: On November 6, net outflows across the U.S. spot ETF landscape collapsed to a modest $51.7 million. This marks a massive deceleration from the previous session on November 5, which witnessed a severe $430.2 million withdrawal.
• Fund-by-Fund Fragmentation (Nov 6): The localized selling pressure was highly concentrated across three specific vehicles, with Bitwise's BITB shedding $20.5 million, Ark Invest's ARKB contracting by $20.1 million, and Grayscale's GBTC releasing $11.1 million.
• The Giant Standstill: Crucially, BlackRock’s IBIT and Fidelity’s FBTC the primary liquidity anchors of the institutional landscape printed zero net flows on November 6, stabilizing completely after suffering significant redemptions the day prior.
• The Institutional Baseline: Despite the $922 million weekly drain, the aggregate spot ETF infrastructure remains incredibly robust, maintaining a staggering $96.5 billion in combined net assets alongside $56.1 billion in cumulative historical net inflows.
Derivatives & Order-Flow Architecture
The resilient price action at $76,042 amidst nearly a billion dollars in weekly outflows highlights a deep structural absorption layer operating within the native spot market:
1. Spot Volume vs. Paper Redemptions
While ETF shares were being redeemed on legacy exchanges, native crypto exchange netflows turned deeply negative, meaning whales and long-term spot accumulators were actively withdrawing BTC into private custody. This on-chain absorption completely neutralized the selling pressure originating from traditional brokerage accounts.
2. Derivatives Reset and Funding Optimization
The derivatives market has capitalized on this consolidation to flush out late-stage, over-leveraged longs. Aggregate Open Interest (OI) has experienced a healthy, non-panic compression, while funding rates across premier trading venues have completely reset from overheated levels back to a neutral, sustainable baseline. This structural cleaning drastically reduces the statistical probability of a cascading liquidation event to the downside.
Macro Support and Resistance Boundaries
From a technical charting perspective, Bitcoin's ability to maintain its posture above $76k confirms that the structural bull market remains fully intact, bounded by two primary top-tier price levels:
🟢 Immediate Demand Cushion $75,000 to $75,300
• The Blueprint: This specialized localized zone serves as our primary line of defense. It represents a heavy structural volume node, a psychological breakout baseline, and a key confluence area for short-term exponential moving averages (EMAs). As long as daily candle closures remain securely above $75k, the immediate structural momentum favors the bulls.
🔴 Premium Technical Resistance Ceiling $77,900
• The Blueprint: On any immediate, news-driven short squeeze, the price action will face intense structural friction near the $77,900 mark. This level lines up perfectly with upper weekly Bollinger Band extensions and local order book ask-side liquidity blocks, requiring a significant surge in spot buying volume to decisively break and hold.
The core analytical question is clear: Is the sharp drop in daily ETF outflows from $430.2M to $51.7M a sign that selling pressure is easing, or are institutional allocators simply taking a temporary pause before pushing prices lower?
The hard numbers point firmly toward an easing thesis. The absolute stabilization of heavyweights like IBIT and FBTC indicates that the primary wave of institutional portfolio rebalancing has concluded. The fact that BTC did not break its key structural support despite a near-billion-dollar weekly outflow demonstrates immense underlying market strength.
• The Strategy: Utilize the current consolidation near $76,042 to scale into disciplined spot positions. Treat any potential retests of the $75,000 demand floor as a high-conviction buying opportunity, while remaining comfortably on the sidelines regarding high-leverage long positions until a clean daily close above $77,900 is verified.
Bitcoin is putting on a masterclass in structural strength, trading firmly at $76,042 despite facing nearly $922 million in weekly spot ETF outflows. While the headlines focus on the aggregate withdrawals, smart money is tracking the massive deceleration in daily selling pressure—which collapsed from a staggering $430.2 million down to just $51.7 million, with BlackRock's IBIT printing a complete standstill.
The native spot market's capacity to comfortably absorb these legacy redemptions while defending the $75,000–$75,300 support zone proves that structural demand remains incredibly healthy. This isn't a market to short on panic; it is a market to accumulate on discipline. Protect your capital, avoid high-leverage traps, and let the institutional consolidation cycle complete its work. #WCTCS9