Square
Following
Hot
News
Profile
Share your thoughts
placeholder
Article
crypto market update
live-cover
LIVE2,010
$BTC As I said, it is developing exactly as expected, friends!
BTC is following the path I previously pointed out. After falling toward the $80,500 support zone, Bitcoin rebounded and climbed back above $81,700, as expected. The reaction at the support level is progressing smoothly. Next, watch the $82,000–$82,500 range and wait for the next move; according to my chart, the upside target is $83,138. Patience and proper analysis are important. Let the chart speak for itself. Buy and trade $BTC
post-image
BTC-0.47%
$XAU
Looking at gold’s trend, you can really laugh out loud😅 A shake on the four-hour chart is tough enough for one day; after a month, you start questioning your life🙃 Once this wave gets me back to break-even, I’ll switch up my approach on MT4 and see how many more days it can keep bouncing around🤡
post-image
XAU+1.62%
Hot CPI: A Rate Hike—or a Longer Wait for Relief?
Inflation can unsettle markets without forcing the Federal Reserve to raise rates.
The crucial shift is in the expected policy path, not the CPI headline alone.
Here is how to separate October tightening risk from a temporary market scare.
What would change?
In this hypothetical scenario, CPI exceeds expectations. That could strengthen October hike expectations, but the adjustment might instead mean fewer anticipated cuts or a longer hold. Without verified market pricing, assigning a probability would be speculation.
Composition matters: persis
post-image
xxx40xxx
Hot CPI: October Hike Risk or Delayed Rate Relief?
Markets can tighten financial conditions before the Federal Reserve changes rates.
An upside CPI surprise matters most when it changes the expected policy path—not merely the headline.
The distinction helps explain when pressure on crypto and U.S. stocks could persist.
A surprise is not a verdict
If CPI exceeds expectations, October hike expectations could rise. But investors might instead anticipate fewer cuts or a longer hold. Without verified starting probabilities, the magnitude of that shift remains unknown.
Persistence matters more than surprise alone. Broad-based core inflation would strengthen the tightening argument; an isolated energy increase would offer weaker evidence. Employment trends and Fed communication could reinforce or challenge either interpretation.
Where the pressure lands
If expected interest rates and Treasury yields rise, equity valuations could weaken as future profits are discounted more heavily. Earnings provide a separate test: resilient margins and guidance could cushion the impact, while deteriorating profits could compound it.
Crypto could face reduced speculative demand and tighter financing conditions. Leverage can amplify price moves, but losses are not inevitable: positioning and expectations already reflected in prices influence the reaction.
Strategy: separate confirmation from noise
A sustained rise in yields alongside restrictive Fed communication would strengthen the bearish scenario. Cooling underlying inflation or a reversal in bond-market repricing would weaken it.
One important countercase: weaker employment could reduce hike expectations yet still hurt stocks through recession fears. Easier policy expectations are not automatically bullish.
A disciplined framework watches yields, earnings guidance and crypto leverage together rather than chasing the first move.
Risk: Inflation releases can trigger reversals, slippage and leveraged losses. This is educational analysis, not personalized investment advice or a profit guarantee.
What evidence would persuade you that October’s dominant risk is renewed tightening rather than weakening growth, and why?
$BTC $GT $ETH
#ShareWeekly #weeklyshare #FedSeptemberMinutesLeanHawkish #GateSquare
repost-content-media
BTC-0.47%
GT-0.73%
ETH-2.91%
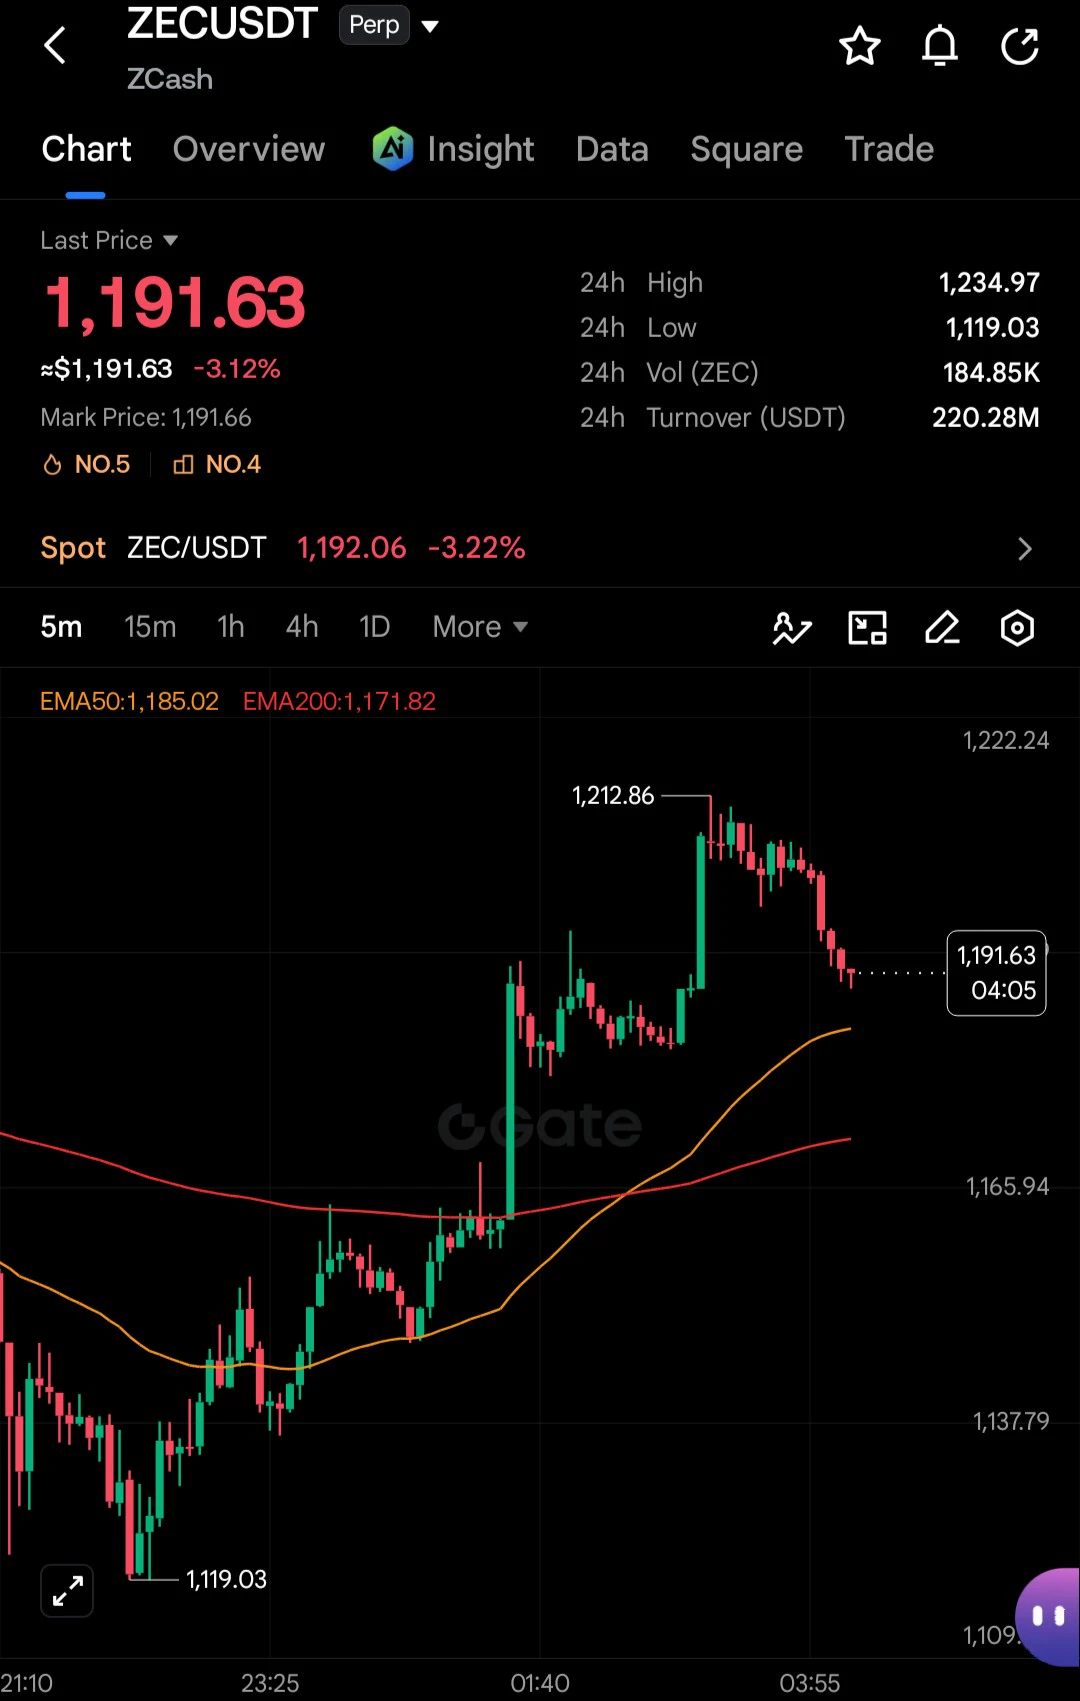
$ZEC
The ZEC short opportunity is here again
Yesterday’s ZEC plunge was incredibly satisfying
Big Hammer previously posted that ZEC had to reach 1100
Yesterday proved that perfectly
It currently feels like ZEC’s decline is not over yet
No obvious divergence has appeared
Although it has already recovered today from yesterday’s drop
The bullish candlestick momentum is average
There is also a relatively high degree of overlap
If it breaks above 1221.13 with increased volume next
And manages to hold above it
Then shorting should be approached cautiously
Currently, ZEC
Could move in either directi
ZEC-1.97%
#BTC回调触及81000美元 Bitcoin Pullback Reaches $81,000: What Could Happen Next?
Introduction: Bitcoin Faces Renewed Selling Pressure
Bitcoin (BTC) has attracted market attention after a pullback brought its price toward the $81,000 level. This movement highlights the volatility of the cryptocurrency market and shows how quickly market sentiment can change when traders reassess risk, liquidity, and short-term price trends.
A pullback does not necessarily mean that a broader bullish trend has ended. In some situations, it represents a temporary correction after a strong rally. However, if selling pre
BTC-0.47%
BTC/USDT MARKET UPDATE: IS BITCOIN PREPARING FOR A STRONG BOUNCE?
Bitcoin is showing an interesting price movement on the 4-hour chart! At the time of this snapshot, BTC is trading around $82,513, after experiencing a sharp decline from the $85,000–$86,000 region toward a recent low of approximately $80,397.
📊 Key Technical Levels to Watch
🔹 Current Price: $82,513
🔹 Immediate Resistance: $82,881
🔹 Major Resistance: $83,816
🔹 Strong Resistance Zone: $85,868–$87,513
🔹 Immediate Support: $81,875
🔹 Major Support: $80,397–$80,935
📉 What Is the Chart Telling Us?
Bitcoin recently faced stron
post-image
BTC-0.47%
$ZEC Turns Short-Term, Why Has the 4-Hour Chart Still Not Capitulated?
$ZEC 24-hour -5.79%, current price 1,217.51. On the surface, this is just another move up or down, but the real conflict lies in the timeframes: the 1-hour chart is relatively strong, while the 4-hour chart is relatively weak. When the two charts give opposite answers, the least useful thing to do is pick the one you like and believe it completely.
Let’s return to the 24-hour range: low 1,112.77, high 1,292.4. Where does the current price of 1,217.51 sit within this range? That directly affects the meaning of the same signa
post-image
ZEC-2.08%
New Market update
live-cover
LIVE2,657
🌍 Gate Shines at TOKEN2049 Singapore, with Excitement Beyond the Venue
From product innovation and cross-industry collaborations to gatherings of the global community, Gate created many memorable moments at TOKEN2049.
💳 Gate Money officially launches, ushering in a new chapter of One Gate, Everything Money
🏎️ F1 Red Bull Racing driver interaction, where speed and innovation sparked new excitement
✨ Gate Gala brand celebration, bringing together global industry partners in Singapore
Every exciting moment showcased Gate’s exploration from digital asset trading toward a broader financial world
  • 9
  • 3
$BTC It is unfolding just as I said, friends!
BTC is moving along the trend I pointed out earlier. After falling toward the $80,500 support zone, Bitcoin rebounded and climbed back above $81,700, as expected. The reaction at the support level has progressed smoothly. Next, watch the $82,000–$82,500 range and wait for the next move; according to my chart, the upside target is $83,138. Patience and accurate analysis are important. Let the chart speak for itself. Buy and trade $BTC
post-image
BTC-0.47%
gm frens
tgif 🎉
post-image
#GatePartnersWithVisaToLaunchCrypto-LinkedCard 💳 — Crypto Moves Into Everyday Spending!
What if your crypto account could do more than hold assets or execute trades? What if it could also help you pay for everyday shopping, dining, and travel?
🌍 Gate is partnering with Visa to bring digital assets closer to real-world payments, with a crypto-linked card planned for more than 40 markets worldwide.
This is another step toward connecting the digital-asset economy with the payment infrastructure people already use.
💡 HOW DOES IT WORK?
The concept is simple:
🔹 Hold digital assets: Keep supporte
V+0.83%
10.9 ZEC public strategy
$ZEC Long position operation
Entry range: Buy long on a pullback around 1200
  Stop-loss defense: 1180 (previous low; execute planB if it breaks below ⬇️)
Take-profit levels
  First take-profit: Around 1240
  Second take-profit: 1300 (if it breaks above this level, prioritize executing planB)
Third take-profit: Above 1360 (previous high of 1384)
Reference factors: The price has risen above the Bollinger middle band and is currently between the middle and upper bands, forming a rebound pattern after being oversold. After the previous sharp drop h
ZEC-1.97%
$BTC BTC is currently priced at 82370, with overall intraday action remaining in a relatively weak, range-bound pattern. After the open, bulls attempted to test resistance higher, but upside momentum was insufficient, and the price gradually retreated after meeting resistance at the highs. From the four-hour chart, short-term moving averages are creating pressure, with initial resistance around 83300. If the price cannot effectively hold above this level, the market will likely continue to fluctuate lower, with the first support around 80400. Once this support is broken, it will further open u
post-image
BTC-0.47%
No risk, no Benz
post-image
Range traders are about to get wrecked by SYXS — here is why.

$SOXS /USDT - SHORT

Trade Plan:
Entry: 32.72 – 33.02
SL: 34.34
TP1: 31.76
TP2: 31.03
TP3: 29.92

Why this setup?
Why now? The daily trend is still range-bound, but the 1h price at 32.88 sits at the edge of a 32.72 to 33.02 entry zone that is primed to break down. A 15m RSI of 36.69 shows sellers already gaining ground without being oversold, so momentum has room to run. With the 1h ATR at 0.614553, a single move can carry the price straight toward TP1 at 31.76 and TP2 at 31.03 before deeper targets even register. The line in th
SOXS+6.05%
  • 2
This cycle’s key market focus is whether ETH can break below the 2400 level. There is some possibility of a breakdown, but market consensus does not favor a sustained deep decline.
2300 and 2200 would be low-probability black swan scenarios; if triggered, the potential returns would be huge. Overall, the expectation is for a pulse-like correction, with limited expectations of a one-sided plunge and range-bound trading as the main scenario.
post-image
ETH-2.91%
#BTCPullsBackTo81000 Bitcoin Pulls Back to $81,000. Is This a Healthy Correction or a Warning Sign for the Market?
Bitcoin remains one of the most closely watched assets in the global financial market, and its pullback toward the $81,000 level has created an important moment for traders, investors, and long term market participants. After a strong move toward higher prices, a correction can change market sentiment quickly. However, a pullback alone does not confirm that a bullish trend has ended.
The key question is not simply why Bitcoin has declined. The more important question is what happe
BTC-0.47%
ETH-2.91%
  • 3
  • 1
Load More

Join 40 M users in our growing community

⚡️ Join 40 M users in the crypto craze discussion

💬 Engage with your favorite top creators

👍 See what interests you

Trending Topics

GateAtTOKEN2049

35.2k Views20.8k Discussing

Gate brought a series of major events to TOKEN2049 Singapore! From the official launch of Gate Money to the F1 Red Bull driver meet-and-greet and the Gate Gala, we witnessed a new chapter of "One Gate, Borderless Finance." Which moment from TOKEN2049 stood out most to you?

BTC Pulls Back to 81000

25.41k Views35.7k Discussing

AIStocksFallALABDropsOver9%

24.61k Views554 Discussing

View More