Square
Following
Hot
News
Notifications
Profile
Share your thoughts
placeholder
Article
💰 Your stock insights deserve rewards—and to be seen
What signals do you look for when you’re bullish on a company? What concerns make you decide to keep waiting?

Join Gate Square’s stock discussion season to share your views and the reasoning behind them.
🌟 Each day, 3 quality creators will be selected to receive 5 USDT each, plus official featured placement to help more people see their valuable content.

Selection isn’t based on correctly predicting price movements or the number of posts. Well-supported opinions, valuable observations, and thoughtful reviews all have a chance to be selec
GateSquare
💰 Your stock insights deserve rewards—and to be seen
What signals do you look for when you’re bullish on a company? What concerns make you decide to keep waiting?

Join Gate Square’s stock discussion season to share your views and the reasoning behind them.
🌟 Each day, 3 quality creators will be selected to receive 5 USDT each, plus official featured placement to help more people see their valuable content.

Selection isn’t based on correctly predicting price movements or the number of posts. Well-supported opinions, valuable observations, and thoughtful reviews all have a chance to be selected.

Sign up first, then #Gate股票畅聊季 publish original content👇
👉 Sign up now:
https://www.gate.com/campaigns/6898
📄 Event details:
https://www.gate.com/announcements/article/102611
repost-content-media
Tesla CEO Elon Musk said the Cybertruck’s order backlog far exceeds production capacity ahead of next year’s planned production-line teardown to expand Cybercab capacity, so the company will add extra shifts.

Tesla says orders are strong while planning to dismantle the production line next year. Adding shifts addresses delivery speed, but doesn’t change the Cybertruck’s planned phaseout on Tesla’s roadmap.
$BTC
TSLA+4.26%
BTC-0.67%
Trenches
ZIG
Z
bade
b
ZIG
0x8c...1145
Market Cap
$.
Change
.
24h Vol
$.
Holders
.
STONK
S
bade
b
STONK
6GmA...UNgx
Market Cap
$.
Change
.
24h Vol
$.
Holders
.
IDOL
I
bade
b
IDOL
0x3b...ab07
Market Cap
$.
Change
.
24h Vol
$.
Holders
.
BTC
B
bade
b
BTC
C5xp...pump
Market Cap
$.
Change
.
24h Vol
$.
Holders
.
scamsem
s
bade
b
scamsem
41Wp...pump
Market Cap
$.
Change
.
24h Vol
$.
Holders
.
I found the bus Ansem rides in.
post-image
11.8 ETH Public Strategy
【Long Setup】$ETH
  Entry range: around 2200-2220
  Stop-loss: 2180
Take-profit levels
  First target: 2240
  Second target: 2260
Third target: around 2280
Fourth target: above 2300

Trading factors: The Bollinger Bands are opening downward. The current price is in a weak range below the middle band and above the lower band. MACD is below the zero line, and bearish momentum is continuing. Weekend liquidity is weakening, while market depth shows buyers in the lead.

Trading advice: Consider taking a small long position at 2220 and adding below 22
ETH-1.23%
BTC-0.65%
GT-2.24%
#AsiaPacificStocksPlunge #ShareWeekly

Asia-Pacific Markets Under Pressure: Is the AI Trade Facing a Major Reality Check?

The recent weakness across Asia-Pacific equity markets highlights an important change in global investor sentiment. After a powerful rally driven by artificial intelligence, semiconductor demand, and expectations of long-term technology growth, investors are beginning to question whether some valuations have moved too far ahead of actual business performance.

In my view, this is not simply a normal market correction. It looks more like a selective repricing of companies
CryptoChampion
#AsiaPacificStocksPlunge #ShareWeekly

Asia-Pacific Markets Under Pressure: Is the AI Trade Facing a Major Reality Check?

The recent weakness across Asia-Pacific equity markets highlights an important change in global investor sentiment. After a powerful rally driven by artificial intelligence, semiconductor demand, and expectations of long-term technology growth, investors are beginning to question whether some valuations have moved too far ahead of actual business performance.

In my view, this is not simply a normal market correction. It looks more like a selective repricing of companies that have become heavily dependent on the AI investment cycle. South Korea, Taiwan, and Japan are experiencing different levels of pressure because their market structures and exposure to technology stocks are not the same.

1. The AI Valuation Trade Is Losing Momentum

The correction began with significant weakness in U.S. semiconductor stocks. The Philadelphia Semiconductor Index reportedly dropped around 12% in one session, marking its biggest single-day decline since 2020.

The selling pressure quickly spread throughout Asia. SK hynix and Samsung Electronics experienced intraday declines exceeding 10%, while SoftBank briefly lost nearly 16%.

These movements suggest that investors are reducing exposure to crowded technology positions. The concern is not necessarily that AI demand is disappearing. Instead, the market may be questioning whether current share prices already reflect too much future growth.

This distinction matters because a strong industry can still experience a major stock market correction when valuations become excessive.

2. Why Different Asian Markets Are Reacting Differently

One interesting development is that not every Asian market experienced the same selling pressure.

The Hang Seng Tech Index recovered almost all its early losses after opening lower, while mainland Chinese A-shares showed greater resilience compared with Japanese, South Korean, and Taiwanese equities.

This suggests that investors are becoming more selective rather than abandoning every risky asset simultaneously.

Markets with expensive technology valuations and concentrated semiconductor exposure are facing stronger pressure. Meanwhile, markets with relatively lower valuations and different sector compositions are showing better resistance.

South Korea's finance minister also described the market reaction as excessive and indicated that margin-related rules would be relaxed for three months. This demonstrates that policymakers are paying attention to the potential impact of external volatility.

3. South Korea: High Risk, High Recovery Potential

South Korea is my first market to watch.

Samsung Electronics and SK hynix represent significant parts of its technology investment story. Both companies are closely connected to global memory demand, AI infrastructure, and semiconductor development.

If semiconductor sentiment improves, these stocks could potentially lead a strong recovery. However, concentrated foreign investor positioning and high sensitivity to global technology valuations could create additional volatility.

I would prefer to wait for U.S. semiconductor stocks to stabilize before considering opportunities in this market.

4. Taiwan: Watching TSMC for a Reversal

Taiwan is my second priority.

TSMC remains central to the global semiconductor supply chain, particularly because of its advanced manufacturing capabilities. However, the recent decline has placed considerable pressure on Taiwanese equities, with the index reportedly falling more than 20% from its peak.

After such a substantial correction, valuations and potential entry opportunities deserve attention. Still, a sustainable recovery will depend heavily on whether U.S. semiconductor stocks can establish a stable bottom.

5. Japan: A Different Recovery Story

Japan comes third in my ranking.

The Nikkei has entered technical bear-market territory, but not every sector is equally vulnerable. Traditional manufacturers and automakers, including Toyota, have shown relatively greater resilience compared with highly exposed technology-related assets.

SoftBank remains an important source of volatility because of its technology investment exposure.

Japan could experience an earlier technical rebound, but whether that recovery can continue will depend on global risk sentiment and corporate earnings.

My Market Strategy and Final View

My preferred order of attention is South Korea first, Taiwan second, and Japan third.

However, I am not treating falling prices as automatic buying opportunities. A sharp rebound after heavy selling does not necessarily confirm that a new bullish trend has started.

The signals I want to see are U.S. semiconductor stocks holding their lows for several consecutive sessions, SK hynix and TSMC stopping their downward momentum, and improving market breadth across Asian equities.

For now, capital protection, controlled leverage, and patience are more important than chasing short-term rebounds.

I believe the long-term AI story remains important, but investors must separate genuine business growth from excessive market expectations. The next opportunity may come when valuations become more reasonable and price action begins confirming that selling pressure is fading.

What matters most is not buying the first dip, but identifying the point where the market finally starts recovering with strength.

This is my market perspective, not financial advice.

#亚太股市集体重挫 #WCTCS9 @Gate_Square #GateSquareTradingChallenge
  • 4
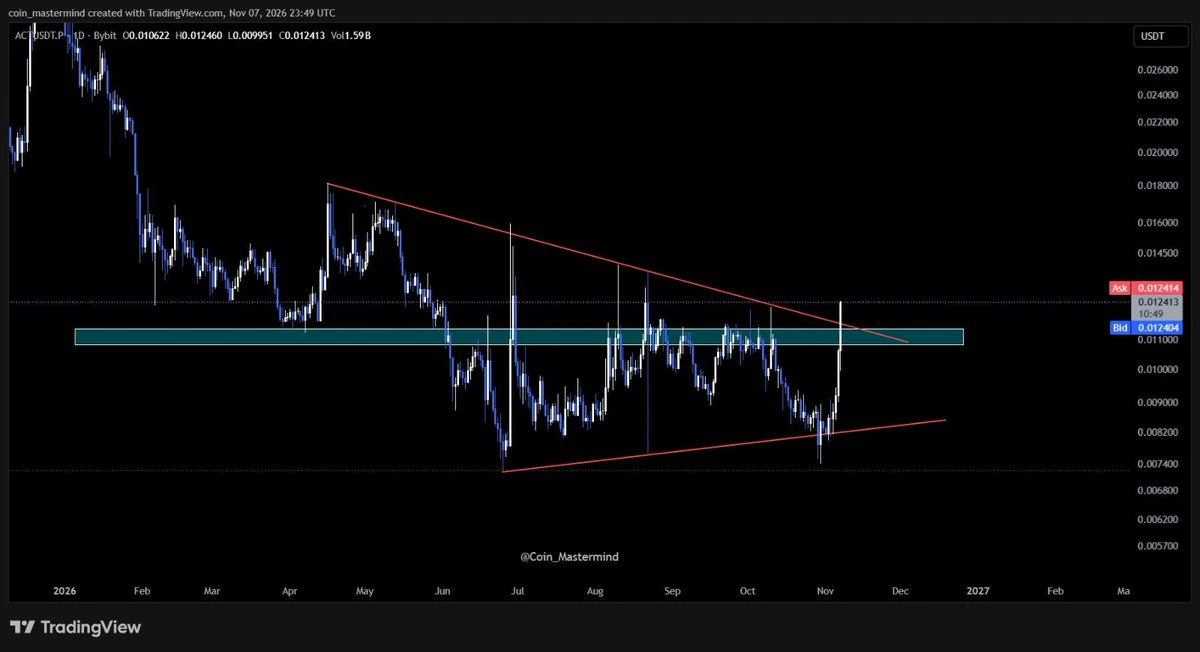
$ACT attempting a breakout! 🚀
📆 1D TF: Price is breaking out of a symmetrical triangle 🔺
Now watching for confirmation — a sustained breakout could open the door for further upside 📈
👀 Keep an eye on this setup!
#ACT #SymmetricalTriangle Not financial advice — DYOR!
post-image
ACT-1.19%
Today's breakfast
Spicy pepper soup + Fat Uncle brand pan-fried dumplings
Aren't these golden pan-fried dumplings making your mouth water? 😍
Everyone in Japan, thank you so much. I can feel that so many people are supporting me. I am truly grateful. I just wanted to say thank you. ❤️
post-image
Boom 💰$ONE Congratulations to everyone who joined us. All targets have been reached 0=002000 Keep an eye on it, secure your profits. Congratulations to you 🎉🤑💰👇
post-image
ONE-1.19%
🔹 High prices continue to erode purchasing power, and US consumer confidence remains weak.
live-cover
LIVE4,490
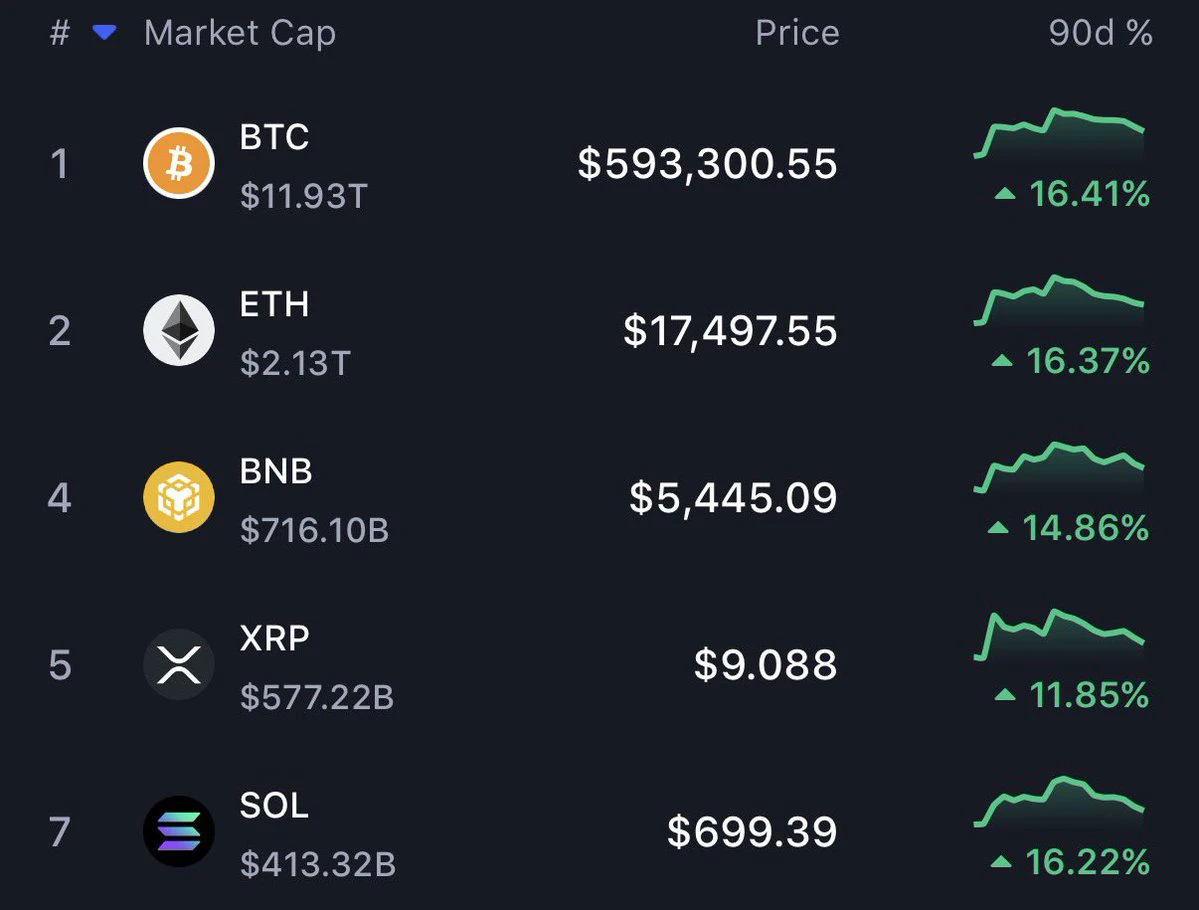
pov: crypto prices after republicans win in 2028
post-image
Then I’ll wear one too, so we can all be happy together.
post-image
$GT ‌ Sideways Bearish The price is at 9.67. Both the MA10 and MA30 are weakening, while the MACD indicates growing bearish momentum. Resistance: 9.70–9.75 Support: 9.60 and 9.51 Conclusion: $GT has the potential to continue its decline toward 9.60 if selling pressure persists. A breakout above 9.75 would open the door for a rebound.

Note: Crypto and stock transactions carry the risk of loss. Please conduct your own research (DYOR) before trading. This information is for general purposes only and does not constitute a solicitation, recommendation, or investment advice. You are solely respons
post-image
GT-2.24%
  • 2
Kidly send me followers red packet arrange a time 60 minut in my live streaming i am starting the
live-cover
LIVE50
$ETH ‌ Bearish (Downward Bias) Weakly bearish The current price of ETH at 2,235 USDT indicates selling pressure. The MA5 is positioned below the MA10 and MA30. The MACD is negative, signaling bearish momentum. Volume is low, suggesting that any upward movement lacks strength. Conclusion: ETH has the potential to continue its decline toward the 2,223–2,206 USDT range. If it manages to break through the 2,240–2,254 level, there is a possibility for a rebound.

Note: Crypto and stock transactions carry the risk of loss. Please conduct your own research (DYOR) before trading. This information is
post-image
ETH-1.23%
  • 1
$ETH Spot ETF flows ran into trouble again yesterday, with total net outflows of $93.3 million for the day. BlackRock's ETHA led the outflows, shedding $90.8 million in a single day. Although it still has $11.542 billion in cumulative historical net inflows as a cushion, that single-day figure is certainly eye-catching; Grayscale's Mini Trust ETH also saw modest outflows of $1.9 million.

Overall, selling pressure was fairly concentrated. The signal of capital flight cannot be ignored, and position management needs to keep pace.
$BT $ZEC #U.S. October nonfarm payrolls beat expectations, bet
post-image
ZEC+1.16%
Not the best but I cant complain about being in profit.
post-image
$MET Strong bullish momentum, bulls target $0.3500…‼️Entry: $0.3230 – $0.3290Take profit 1: $0.338…||…Take profit 2: $0.348…||…Take profit 3: $0.360Stop loss: $0.3130
post-image
MET-0.33%
Not many people could carry a whole pot like this, right?🤣
post-image
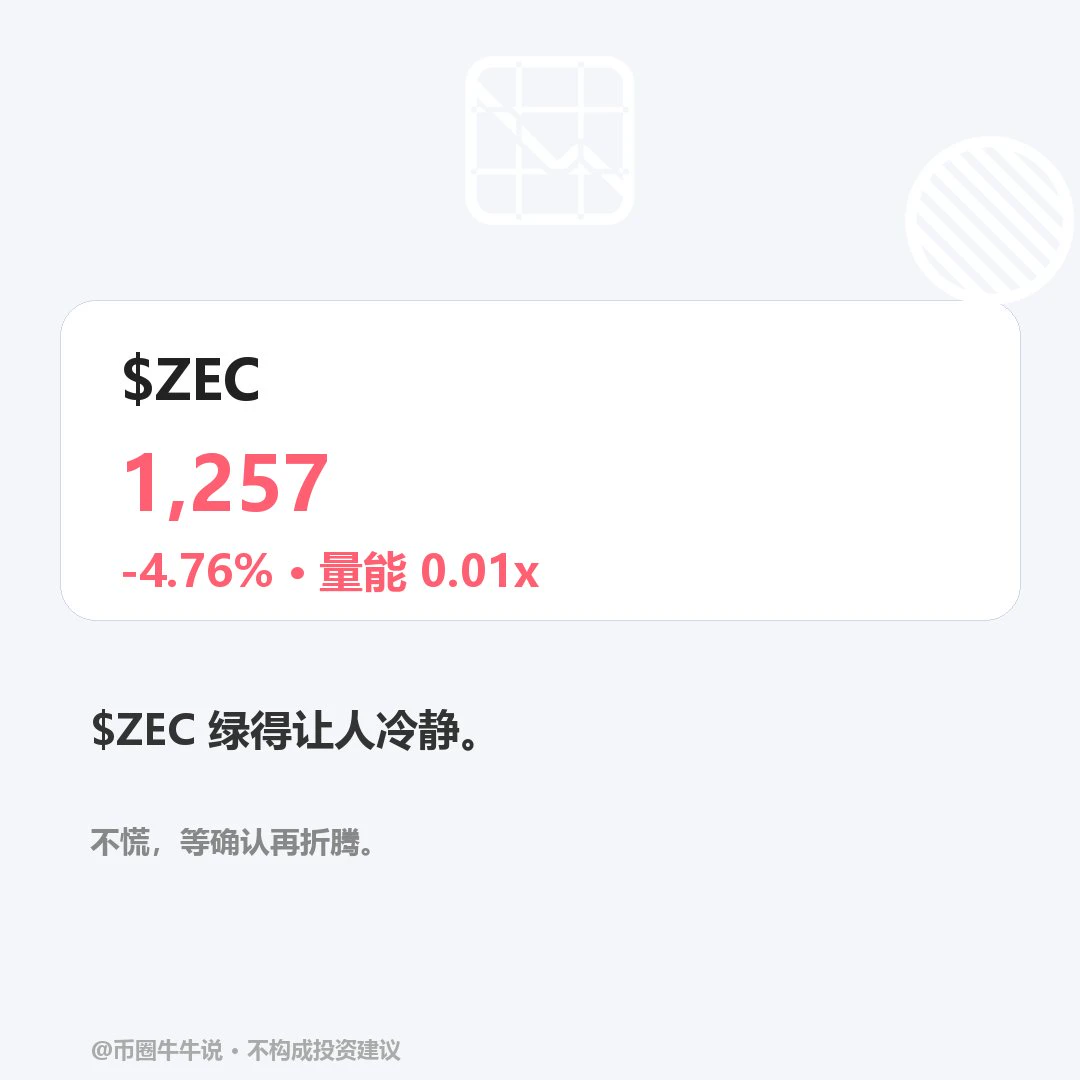
$ZEC Currently trading at 1257.17, down 4.76% over 24H (range: 1236.65–1364.08). Weak on the 1H, with RSI at 21.51, price below the EMA20 at 1278.54, and a volume ratio of 0.008; weak on the 4H, with RSI at 53.60 and price below the EMA20 at 1283.93. A sustained move above the 1364.08 resistance level is worth watching; a break below the 1236.65 support level would weaken the structure. For the review, check whether price holds above 1364.08 and reclaims 1236.65, with volume at only 0.008x. A low-volume hold above resistance, or a breakdown without a reclaim, would invalidate the setup. Market
post-image
ZEC+1.16%
Load More

Join 40 M users in our growing community

⚡️ Join 40 M users in the crypto craze discussion

💬 Engage with your favorite top creators

👍 See what interests you

Trending Topics

USAIStocksHitHard

21.93k Views3.68k Discussing

U.S. stocks sold off sharply on Thursday, November 5 (UTC). The Nasdaq closed down around 5.5%, entering correction territory, while the Philadelphia Semiconductor Index plunged roughly 12%, with chip stocks including $NVDA and $AMD posting steep losses. Beyond profit-taking, investors are growing concerned about the pace of AI data center construction, capital spending, and future returns on investment. The key question now is whether the AI sector’s lofty growth expectations need to be repriced. Where do you think the next opportunities will emerge: chip stocks, tech giants, or other sectors?

USNonfarmPayrolls

37.17k Views4.35k Discussing

StakeOnLaunchpoolToShare450KVLX

11.32k Views834 Discussing

View More