











#SKHynixQ3RevenueHitsRecordHigh
#Gate广场万圣节 Record Profits, ₩100 Trillion in Shareholder Returns and HBM4. Can SK Hynix Keep Its Edge Through 2030?
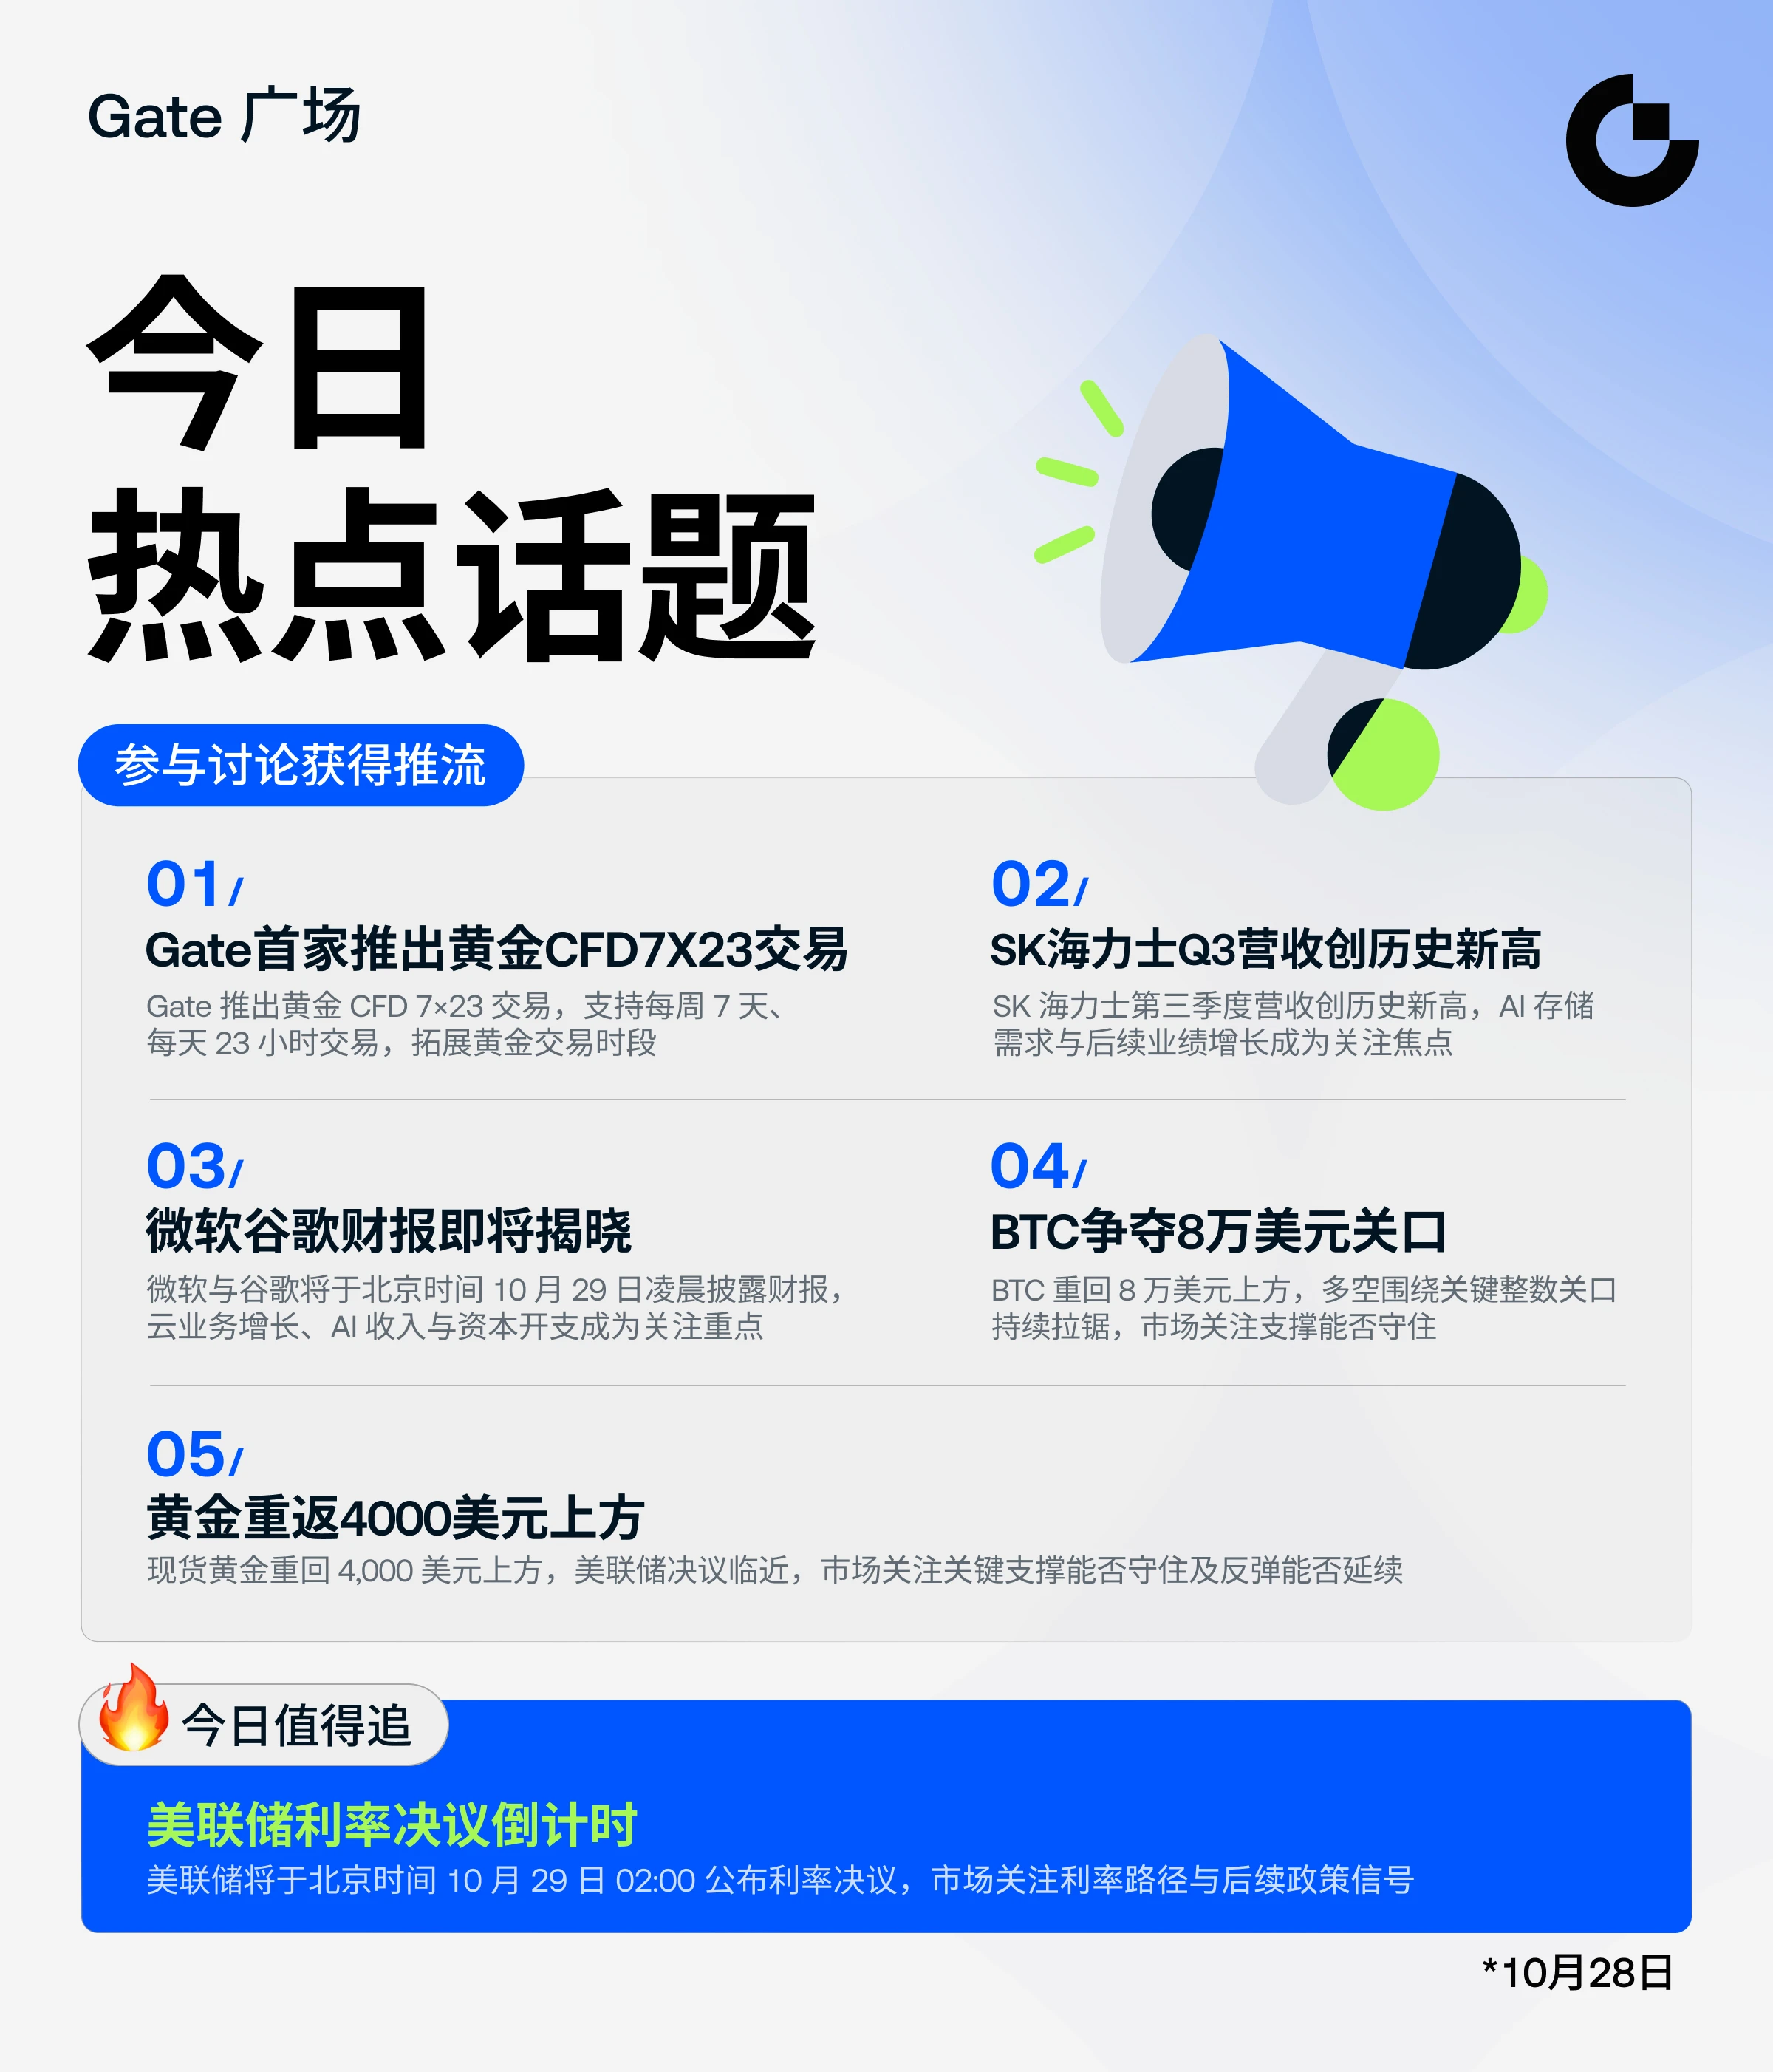
SK Hynix reported Q3 on October 28 and quarterly revenue crossed ₩100 trillion for the first time, at ₩104.62 trillion, about $73 to $79 billion depending on the exchange rate used. That is up 327.9% year over year and 31.9% from Q2. Shares jumped nearly 8% to ₩1,446,000 in Seoul, the KOSPI topped 5,800, and the US-listed ADR (SKHY), near $1,099.44, rose 4% in after-hours trade.
Profitability: an 80% operating margin
Operating profit was ₩83.33 trillion, up 632% year over year and 38% on the quarter. The margin reached 79.7%, versus 76% in Q2 and 47% a year ago. Net profit was ₩39.78 trillion, a 38% margin, down 58% from Q2's ₩93.92 trillion, so operating profit is the cleaner read. Results beat LSEG estimates of ₩98.34 trillion in revenue and ₩76.72 trillion in operating profit by 6.4% and 8.6%. Growth came from server DDR5, the start of HBM4 shipments and 321-layer enterprise SSDs.
The chart after the gap
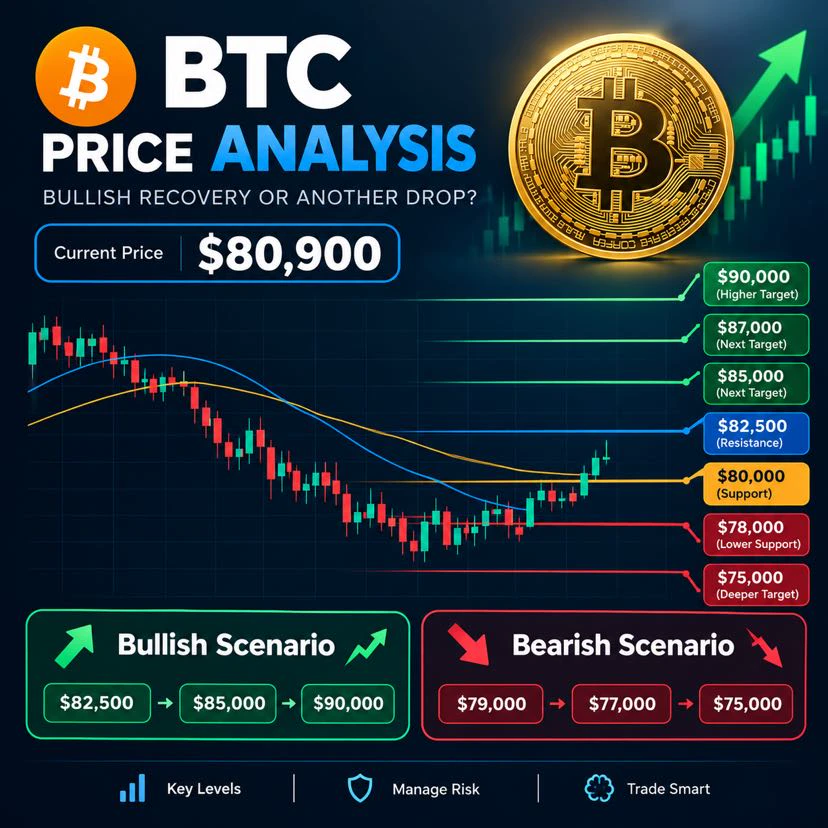
From Monday's close near ₩1.28 million, the stock is up about 13%. Tuesday's intraday high of ₩1,363,000 (5.7% below the ₩1,446,000 print) and the implied prior close near ₩1,339,000 (7.4% below) are the levels to watch. Holding above them on strong volume would confirm the gap. Falling back below ₩1,339,000 would suggest the beat was already priced in.
The ₩100 trillion shareholder-return plan
For 2026, SK Hynix plans about ₩100 trillion: at least ₩30 trillion in cash dividends and at least ₩60 trillion in buybacks and cancellations, including the ₩40 trillion announced in August, which was completed last week. The board approved a Q3 dividend of ₩14 trillion and a new ₩20 trillion buyback. Of that, ₩10 trillion will be cancelled and ₩10 trillion goes to employee compensation, outside the return total. The Q3 dividend is ₩20,000 per share, ₩10,000 from earnings and ₩10,000 special from Kioxia gains, about 1.4% of today's price in one quarter. The policy: return 50% or more of free cash flow, with special dividends for investment gains and buybacks every quarter.
Financial strength versus capex
Cash reached ₩114.5 trillion, up ₩26.5 trillion, while borrowings fell ₩2.8 trillion to ₩15.8 trillion, leaving net cash of ₩98.7 trillion. The full return plan equals roughly 1.2 quarters of current operating profit, so it is affordable. The test is next year: investment is set to rise significantly as Yongin Phase 1 enters full-scale operation, though management says it will adjust timing and scale flexibly. SK Hynix also discontinued its Solidigm IPO review, citing financial market conditions, which removes one outside source of capex funding.
HBM4 transition
HBM4 shipments began in earnest, and SK Hynix expects HBM4 to surpass HBM3E in both shipment volume and revenue in Q4 and become the mainstream product. It will ramp the M15X fab to maximum capacity by year-end to support that.
Demand visibility: long-term agreements
SK Hynix has signed long-term agreements with 14 major customers, including leading cloud providers, covering more than 50% of 2027 and 2028 production capacity. Terms typically run five years, with a mechanism that adjusts to market conditions within an agreed price range. That stabilizes profitability but also bounds the upside if prices keep rising.
Shortage through 2030, and capacity
Management expects demand to exceed supply through 2030, citing the technical difficulty of leading-edge processes and long fab lead times, with AI spending broadening from a few companies to enterprises and governments. Capacity plans include a larger share of 10nm-class 1c DRAM, more DDR5 and LPDDR5 SOCAMM for AI servers, and 321-layer NAND above half of domestic NAND capacity in Q4.
Competition and market share
Nvidia's CEO said in June that Samsung, SK Hynix and Micron all passed HBM4 qualification for the Vera Rubin platform. Supply-chain estimates give SK Hynix 60% to 70% of that volume, Samsung 25% to 30% and Micron the rest. IDC puts SK Hynix's HBM revenue share at 63.2% for 2025 and 56.4% in Q1 2026, and Counterpoint shows it slipping from 58% to 50% by Q2. Samsung reports on October 29. SK Hynix still leads, but its lead is narrowing as the market grows.
**Bullish scenario:** AI infrastructure spending continues, HBM4 adoption widens and supply stays tight, keeping margins near 80%.
**Bearish scenario:** Samsung and Micron close the gap, AI investment slows or memory prices fall, and a valuation built on peak margins compresses despite record earnings.
The central question
Long-term contracts, net cash and a first-mover HBM position point to a real competitive advantage. The risk is that an 80% margin is a peak that rivals and cycles tend to erode. The next proof points are Samsung's results, Q4 HBM4 volumes and whether 2027 capex stays disciplined. @Gate_Square