
Square
Following
Hot
News
Notifications
Profile
Share your thoughts
placeholder
Article
Read through the Primus FHE docs tonight.
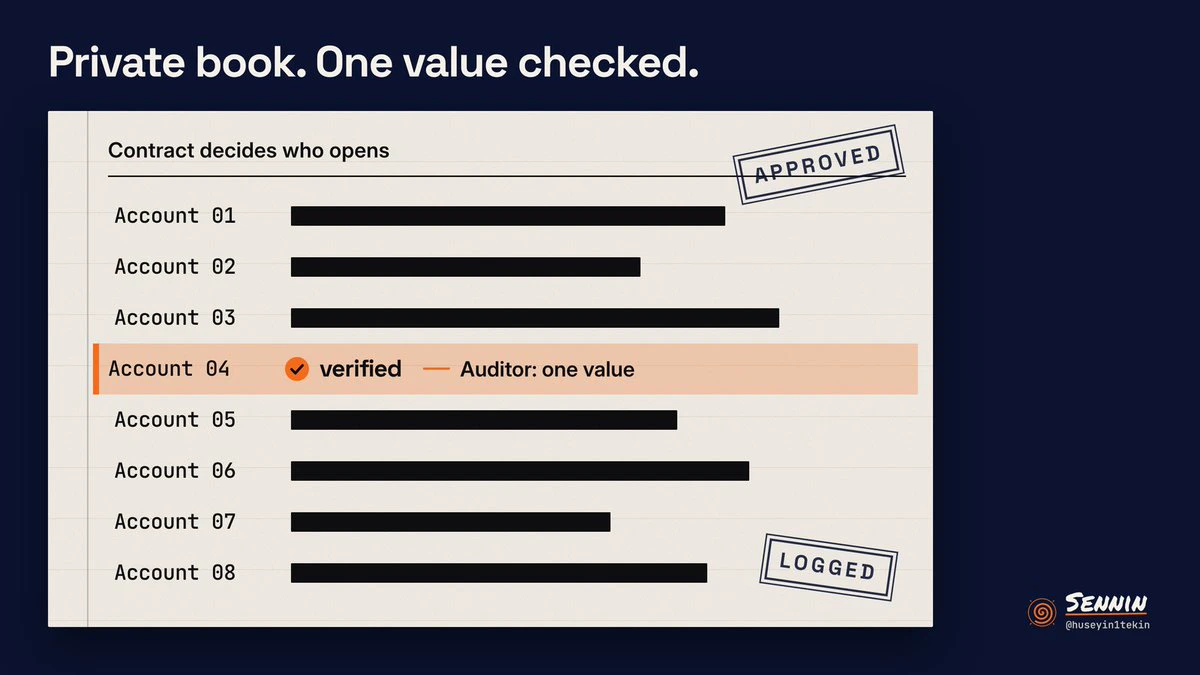
Balances and amounts stay encrypted onchain. The contract decides who can open each value, and every opening has to be approved and recorded. So an auditor can check one number without the whole book going public.
They mention it for payroll and treasuries.
I still want to see that record of who opened what. For now decryption runs through a TEE-protected service, with threshold MPC planned later.
post-image
FHE-3.50%
Trenches
IDOL
I
bade
b
IDOL
0x3b...ab07
Market Cap
$.
Change
.
24h Vol
$.
Holders
.
PIEVERSE
P
bade
b
PIEVERSE
0x0e...25a9
Market Cap
$.
Change
.
24h Vol
$.
Holders
.
FIONA
F
bade
b
FIONA
B34n...pump
Market Cap
$
Change
.
24h Vol
$.
Holders
.
Singularity
S
bade
b
Singularity
7R4M...pump
Market Cap
$.
Change
.
24h Vol
$.
Holders
.
CLAUDIA
C
bade
b
CLAUDIA
2j5S...W2ZM
Market Cap
$.
Change
.
24h Vol
$.
Holders
.
Lao Hei is clearly putting his own skin in the game with this trading call $VVV ! The project is also currently offering open-source models at half price, and if they sell well, 40 will probably be coming soon too!
post-image
VVV+0.37%
Open a short position on $SUI . Trade setup: Entry 0.6459 - 0.6491, targets 0.6160 and 0.591, stop loss 0.6686. SUI failed to reclaim local moving-average resistance; price is expected to quickly move lower and retest support below. Note: A strong 1-hour rebound trend could invalidate this short if price reclaims 0.6500. Don't go all in, bro. Position size should suit your own account.
post-image
SUI-1.05%
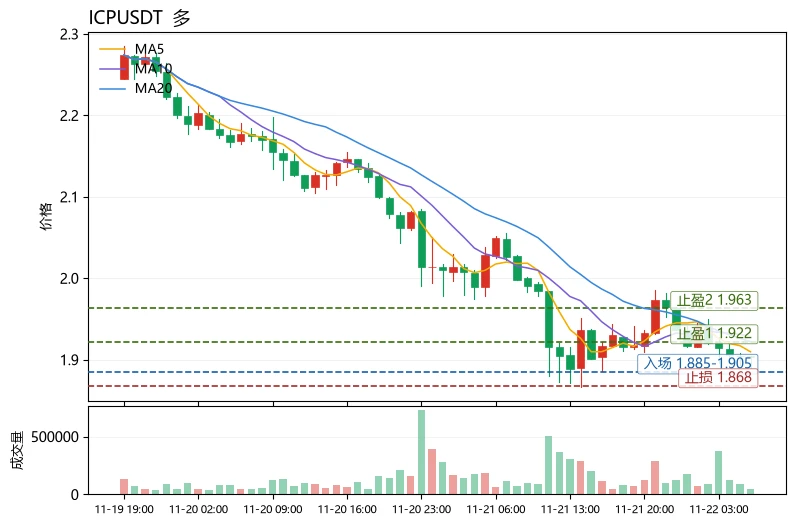
The Extreme Fear Index plunged to 12, yet $ICP fell only 6.26% and the MACD histogram remains positive—this is the most unusual detail in today's market: panic selling is underway, but bearish momentum has not expanded in tandem. Dragged down by BTC's weakness, ICP is now at 1.903, close to the lower Bollinger Band at 1.881. MA5 is below MA20 in a bearish alignment, RSI at 37.8 is nearing oversold territory, and the funding rate of -0.0041% shows shorts are paying to hold positions, indicating elevated crowding. Extreme sentiment combined with a negative funding rate often provides fertile gr
post-image
ICP-1.14%
DOT-1.51%
UNI+3.05%
XRP Technical Outlook: Bearish Pressure Continues as Price Tests $0.93 Support

XRP is trading around $0.9364 after another strong bearish move on the daily chart. Price has broken below the previous support structure and is trading beneath all four major EMAs. Sellers remain in control, while the $0.8619 area is now an important support zone to watch.

EMA Structure

XRP is trading below all major moving averages, confirming a bearish market structure.

- 20 EMA: $1.0502
- 50 EMA: $1.1777
- 100 EMA: $1.2374
- 200 EMA: $1.3108

The 20 EMA remains below the 50, 100, and 200 EMAs. This alignment
XRP-1.12%
BEAR CARNIVAL ROUND 2?
$BTC
post-image
BTC-0.67%
Nov 22 morning session: ETH resumed moving sideways after a rebound. Watch the 1674–1692 range first.

There is support at 1674–1676, where you can wait for a brief long opportunity after the price stabilizes. If it fails to break through 1689–1692, watch for a pullback. If it later holds above 1692 on increased volume, look next at 1697–1705; if it breaks below 1672, watch 1663 and 1653.

My approach is to stay mostly inactive in the middle and wait for confirmation at key levels. Don’t let a sharp rally or sell-off throw off your rhythm. The key now is which of these two levels gives a direc
post-image
ETH-1.23%
#pi Buy when the price is low if you have liquid funds. Absolutely do not take out online loans to buy in. Even if the DEX launches in Q1 2027, it may not be available in many regions. Anyone familiar with the team knows trading won’t launch in regions without licenses. Don’t expect to make a quick profit; keep accumulating gradually for the long term.
PI-0.60%
  • 3
Market Prediction
live-cover
LIVE2,465
BTC-0.67%
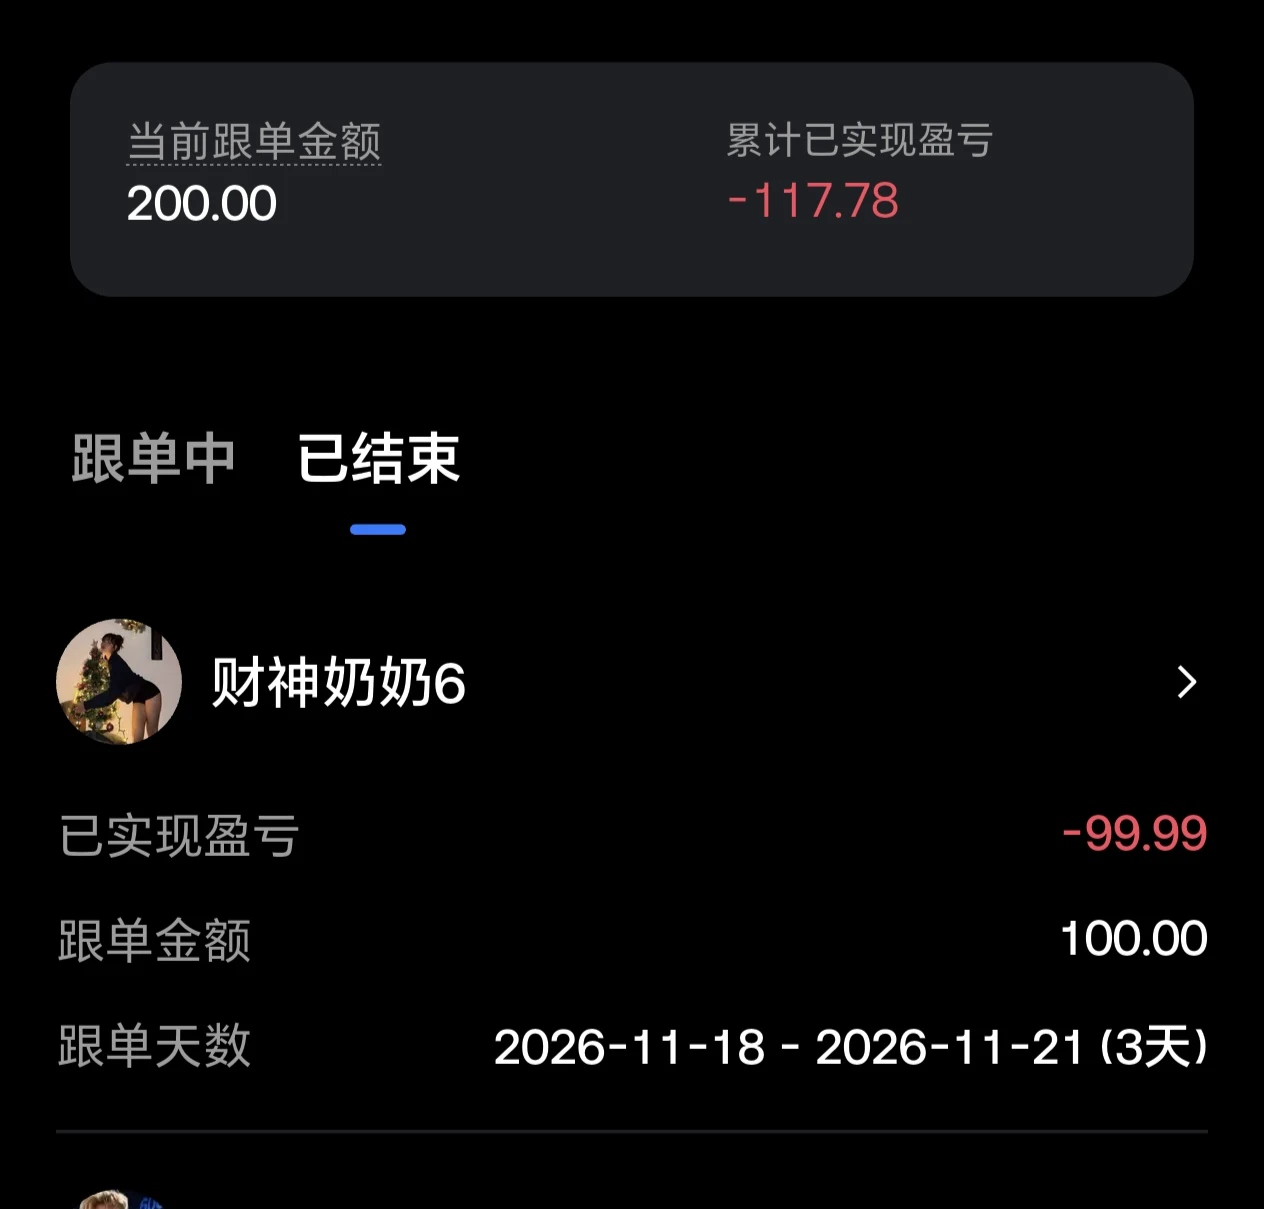
The shady trading signal provider Caishen Nainai 6 blew it all in two days🤬🤬🤬
post-image
  • 1
BTC markets predictions
live-cover
LIVE2,140
BTC-0.67%
Driven by active trading volume, price action continues to edge higher; despite limited overall market participation, resistance remains intact. The uptrend is showing initial momentum, but the indicators have yet to fully align, suggesting the move may stall. $AKE — Long entry: 0.005343 Take-profit 1: 0.005401 Take-profit 2: 0.005450 Stop-loss: 0.005129
post-image
AKE+6.07%
Towards the end of the week, something interesting unfolded in the markets. While stocks faced a sharp sell-off, the bond market moved in the opposite direction. The yield on the 10-year U.S. Treasury note fell by more than 10 basis points to 4.948%, while the 2-year Treasury yield dropped by over 13 basis points to 4.647%. In short, capital fleeing the stock market sought a "safe haven"—and it found one in bonds.

Why is this surprising? Because, typically, the expectation of a Federal Reserve interest rate hike pushes bond yields higher. Indeed, the market still views a rate hike in December
BTC-0.67%
GT-2.41%
SOL-0.77%
IDOL-6.71%
4STOCK-3.94%
  • 2
  • 1
I was wrong. When I used to look at chart patterns, I always wanted to see everything at once, and ended up getting more and more confused. Now I’ve changed my approach: I only look at four things.
My own rule is to first check whether a token like $PIEVERSE , which rose 13.11% in a day, has repeatedly tested its high of 3.4994. One test doesn’t count. If it tests three times and still can’t hold, that’s hitting a wall, not a breakout. Let it make its own move; don’t try to force it.
Next, look at the depth of the pullback. If it gives back no more than half the rise, the structure is still in
PIEVERSE+0.58%
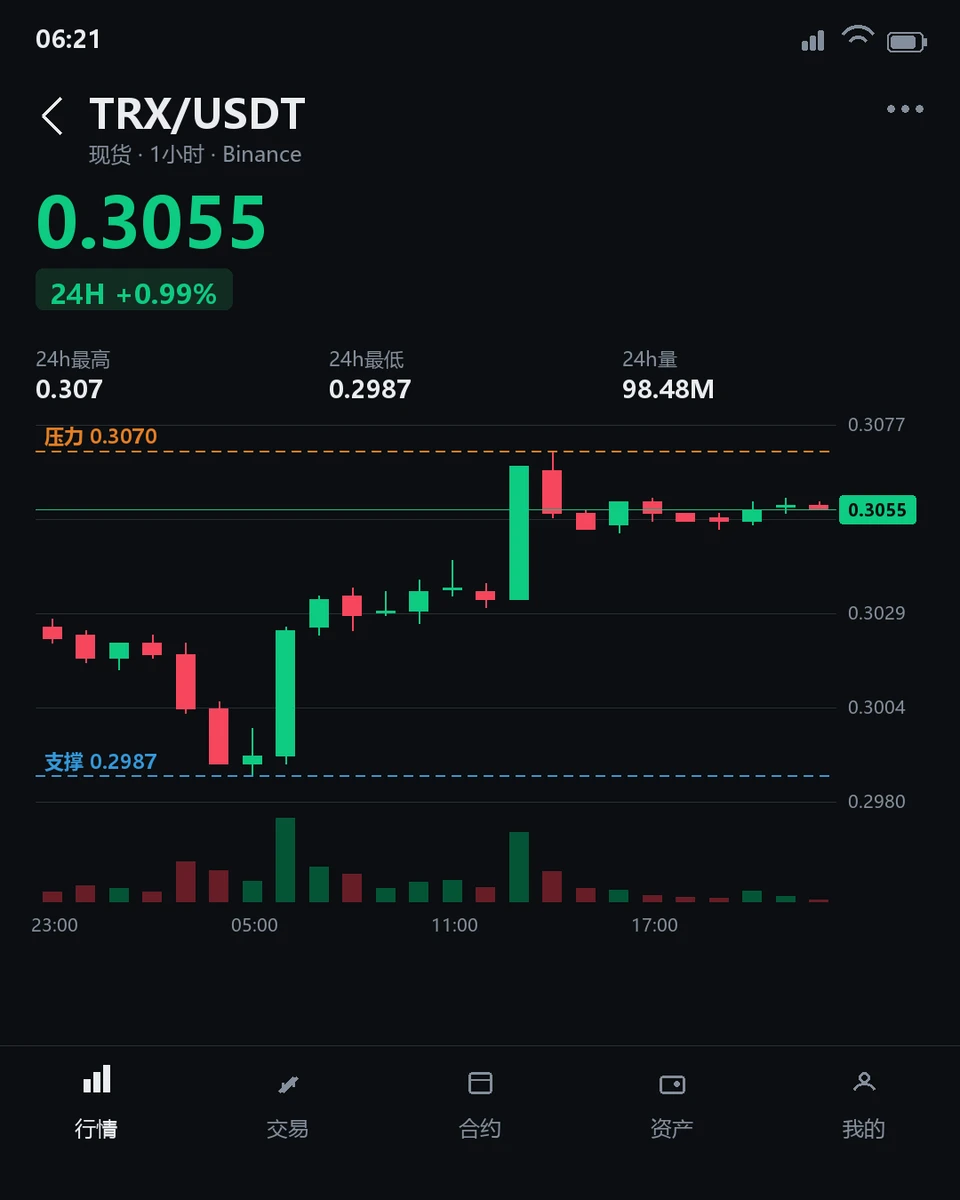
$TRX Current price: 0.3054, up 1.09% in 24h. The 1-hour RSI of 63.89 signals relative strength, but the 4-hour RSI of 34.55 is deeply weak, while the volume ratio is only 0.20, indicating a clear drop in volume. The two timeframes are at odds above the same support at 0.2987, with no clear directional consensus. I’ll wait for confirmation. A break above 0.307 confirms the move once reached; a break below 0.2987 is my stop-loss. Low-volume standoffs are most likely to lure traders into one-sided thinking, so I’ll wait for volume confirmation before making a call. Not investment advice
#TRX #波场
post-image
TRX+0.42%
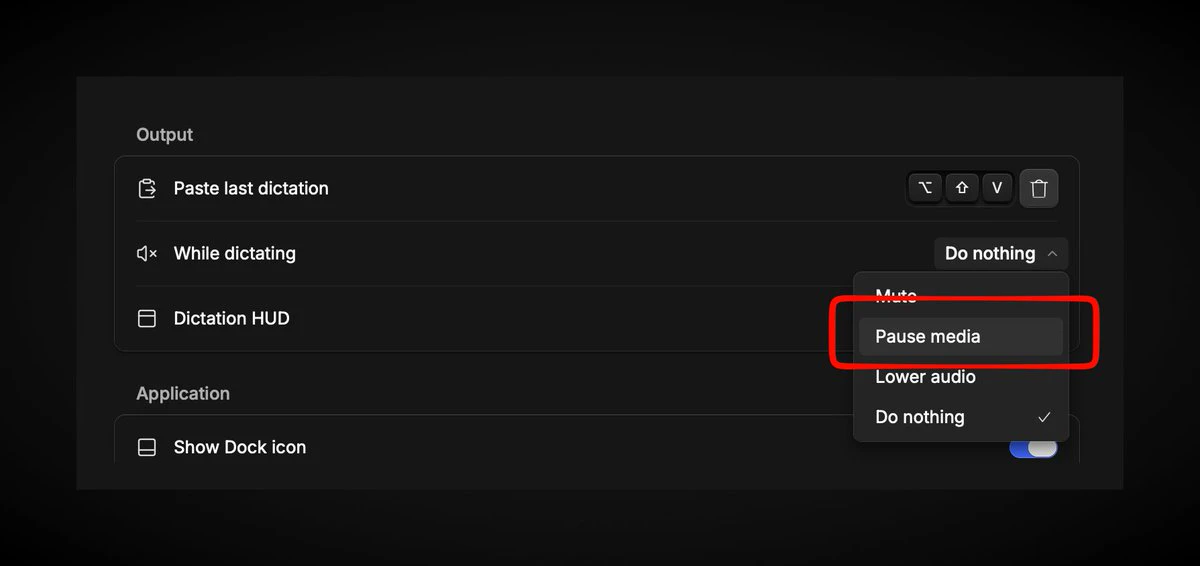
TIL, Hex let's you pause media when you are dictating 🙌
post-image
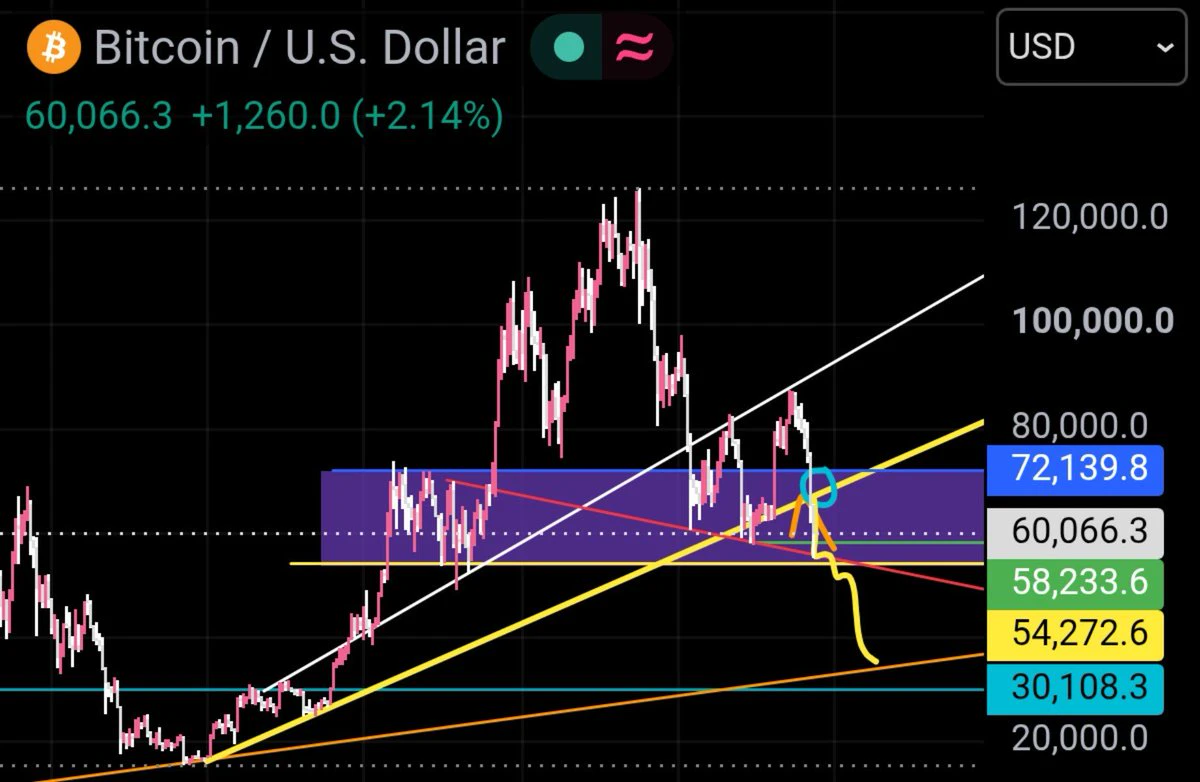
Short-term view on $BTC and U.S. stocks: Bitcoin’s realized price is at $53,000, and the long-term holder cost basis is $48,000. This crash took it from $87,000 to $55,000, a drop of $32,000 already. Even if it falls another $10,000, averaging down means you still wouldn’t be at a loss if it rebounds to $60,000. Bitcoin’s 3-day and 5-day moving averages and weekly KDJ are all already negative, so a rebound could happen at any moment. Wait for a Fibonacci retracement bounce before considering shorting. Given the current market, BTC is only one wave away from completing its seven-wave pattern o
post-image
BTC-0.67%
NAS100-0.07%
$TRX Is Strong in the Short Term but Weak on the 4-Hour Chart—Which Will Turn First?
$TRX is currently trading at 0.3055, up 0.958% over the past 24 hours, with an intraday range of 0.2987–0.307. The 1-hour chart shows strength, with the price above the EMA20 at 0.30456. The RSI14 is 67.53, in neutral-to-bullish territory, but the volume ratio is just 0.21, far below average, indicating limited participation from short-term buyers. The 4-hour chart remains weak: the price is still below the EMA20 at 0.30594, and the RSI14 at 37.21 has yet to recover from weak territory. Resistance is far above
post-image
TRX+0.42%
Load More

Join 40 M users in our growing community

⚡️ Join 40 M users in the crypto craze discussion

💬 Engage with your favorite top creators

👍 See what interests you

Trending Topics

BTCBreaksBelow60K

2.1M Views30.1K Discussing

BTC fell below $60,000 on November 20 for the first time since July, alongside a tech stock selloff and broader pressure on risk assets. Will $60K become resistance, or can BTC quickly reclaim it? What price or volume signals would convince you that selling pressure is easing?

GateDirectIPOPhase3ANTAllocates92100Shares

797.2K Views4.9K Discussing

NvidiaDropsNearly14Percent

333.9K Views7.6K Discussing

View More