Square
Following
Hot
News
Notifications
Profile
Share your thoughts
placeholder
Article
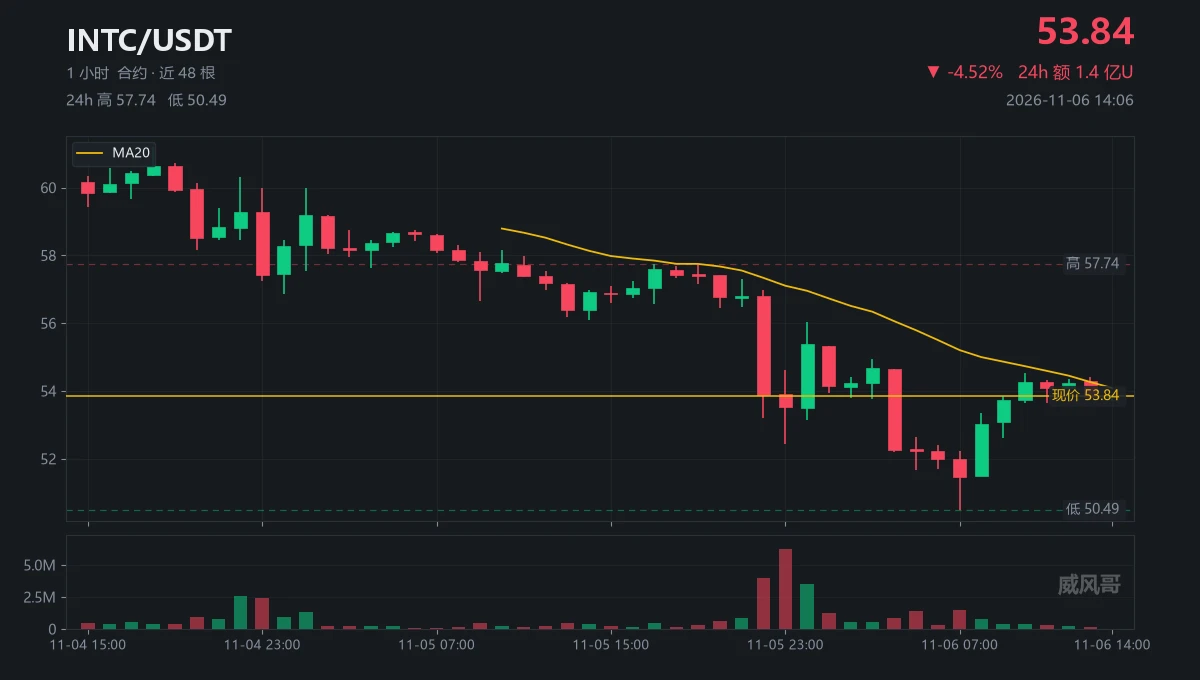
Over ten hours, $INTC made two moves in exactly the same direction.
The first came during the first hour of U.S. stock trading: two candles dumped ten million contracts.
The price slid from 57.74 to 50.49, finishing the day at -12.6%.
Ten million contracts—that’s someone clearing out.
The second took just four million contracts to give back that early-morning rebound, and then some.
Volume was down 60%, but the price fell even harder.
The order book is thin. It’s not that someone wants to dump; no one’s willing to catch it.
After the close, it recovered, climbing eight points over eight hours
post-image
INTC+0.05%
  • 7
$PI Xiaopaipai took 2 Viagra pills and was relatively erect and firm.
post-image
PI-0.60%
Trenches
ZIG
Z
bade
b
ZIG
0x8c...1145
Market Cap
$.
Change
.
24h Vol
$.
Holders
.
BTC
B
bade
b
BTC
C5xp...pump
Market Cap
$.
Change
.
24h Vol
$.
Holders
.
STONK
S
bade
b
STONK
6GmA...UNgx
Market Cap
$.
Change
.
24h Vol
$.
Holders
.
CORLA
C
bade
b
CORLA
0xba...7777
Market Cap
$.
Change
.
24h Vol
$.
Holders
.
DESSA
D
bade
b
DESSA
npz2...pump
Market Cap
$.
Change
.
24h Vol
$.
Holders
.
#CryptoMarketUnderPressure

The cryptocurrency market is facing increasing pressure as major digital assets experience price fluctuations and investors become more cautious. Market uncertainty is growing, and traders are closely watching Bitcoin, Ethereum, and other leading cryptocurrencies to understand the next direction.

The crypto market is highly sensitive to global economic conditions, investor sentiment, and financial developments. When traditional stock markets face heavy selling pressure, cryptocurrency markets can also experience uncertainty. This connect
BTC-0.67%
ETH-1.26%
  • 1
#USNonfarmPayrolls #USNonfarmPayrolls

The US Nonfarm Payrolls report is one of the most important economic events for global financial markets. Investors, traders, and financial experts closely watch this report because it provides a clear picture of employment growth and the overall strength of the United States economy.

Nonfarm Payrolls measures the number of jobs added or lost in the United States during the previous month, excluding agricultural employment and certain other categories. This information helps investors understand whether businesses are expanding, hiring more workers, or b
BTC-0.67%
ETH-1.26%
$BCH

$BTC is still churning within its range, refusing to pick a direction, while $BCH has quietly tightened its grip on the reins!
The broader market plunged 5.6%, as retail traders rushed to cut their positions and exit.
$BCH dipped to $270 but was quickly bought back up. Negative funding rates have been pushed to the extreme, with 82,000 short contracts crowded below.
The big players are probably already laughing—this pile of short contracts is ready-made fuel for a rally!
#BCH$BCH
👇
Risk warning: The above is only market observation and personal opinion and does not constitute invest
post-image
BTC-0.67%
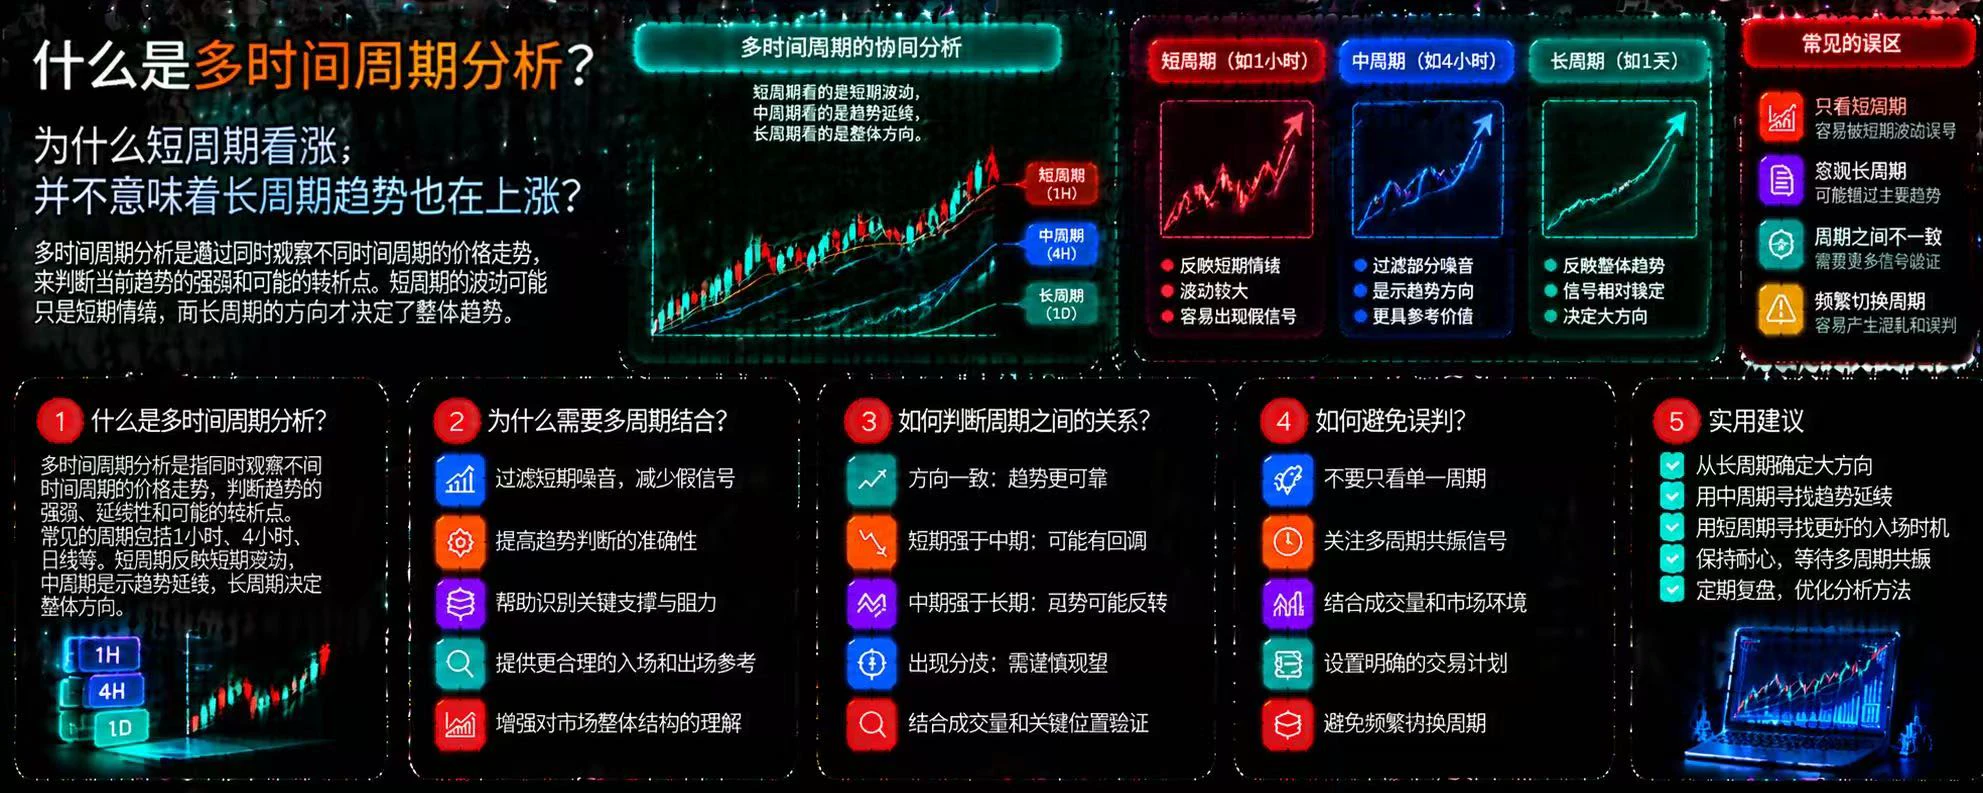
What Is Multi-Timeframe Analysis? Why Doesn’t a Bullish Short-Term View Mean the Long-Term Trend Is Also Rising?

In cryptocurrency trading, the same asset can show completely different price action across timeframes. The 15-minute chart may be rising while the 4-hour chart remains in a downtrend, and the daily chart may show a market moving sideways. Looking at just one timeframe can easily lead you to mistake a temporary rebound for a trend reversal.

First, what is multi-timeframe analysis?

Multi-timeframe analysis means observing price action across different timeframes at the same time t
post-image
🔹South Koreas KOSPI Plunges 8, Triggering a Trading Halt! Losses Narrow After Trading Resumes. Are
live-cover
LIVE1,968
The fourth trade is already up 8 points. I’ve moved the stop to breakeven—holding tight #Gate安全卫士免费开通
#USStocksFaceHistoricSelloff
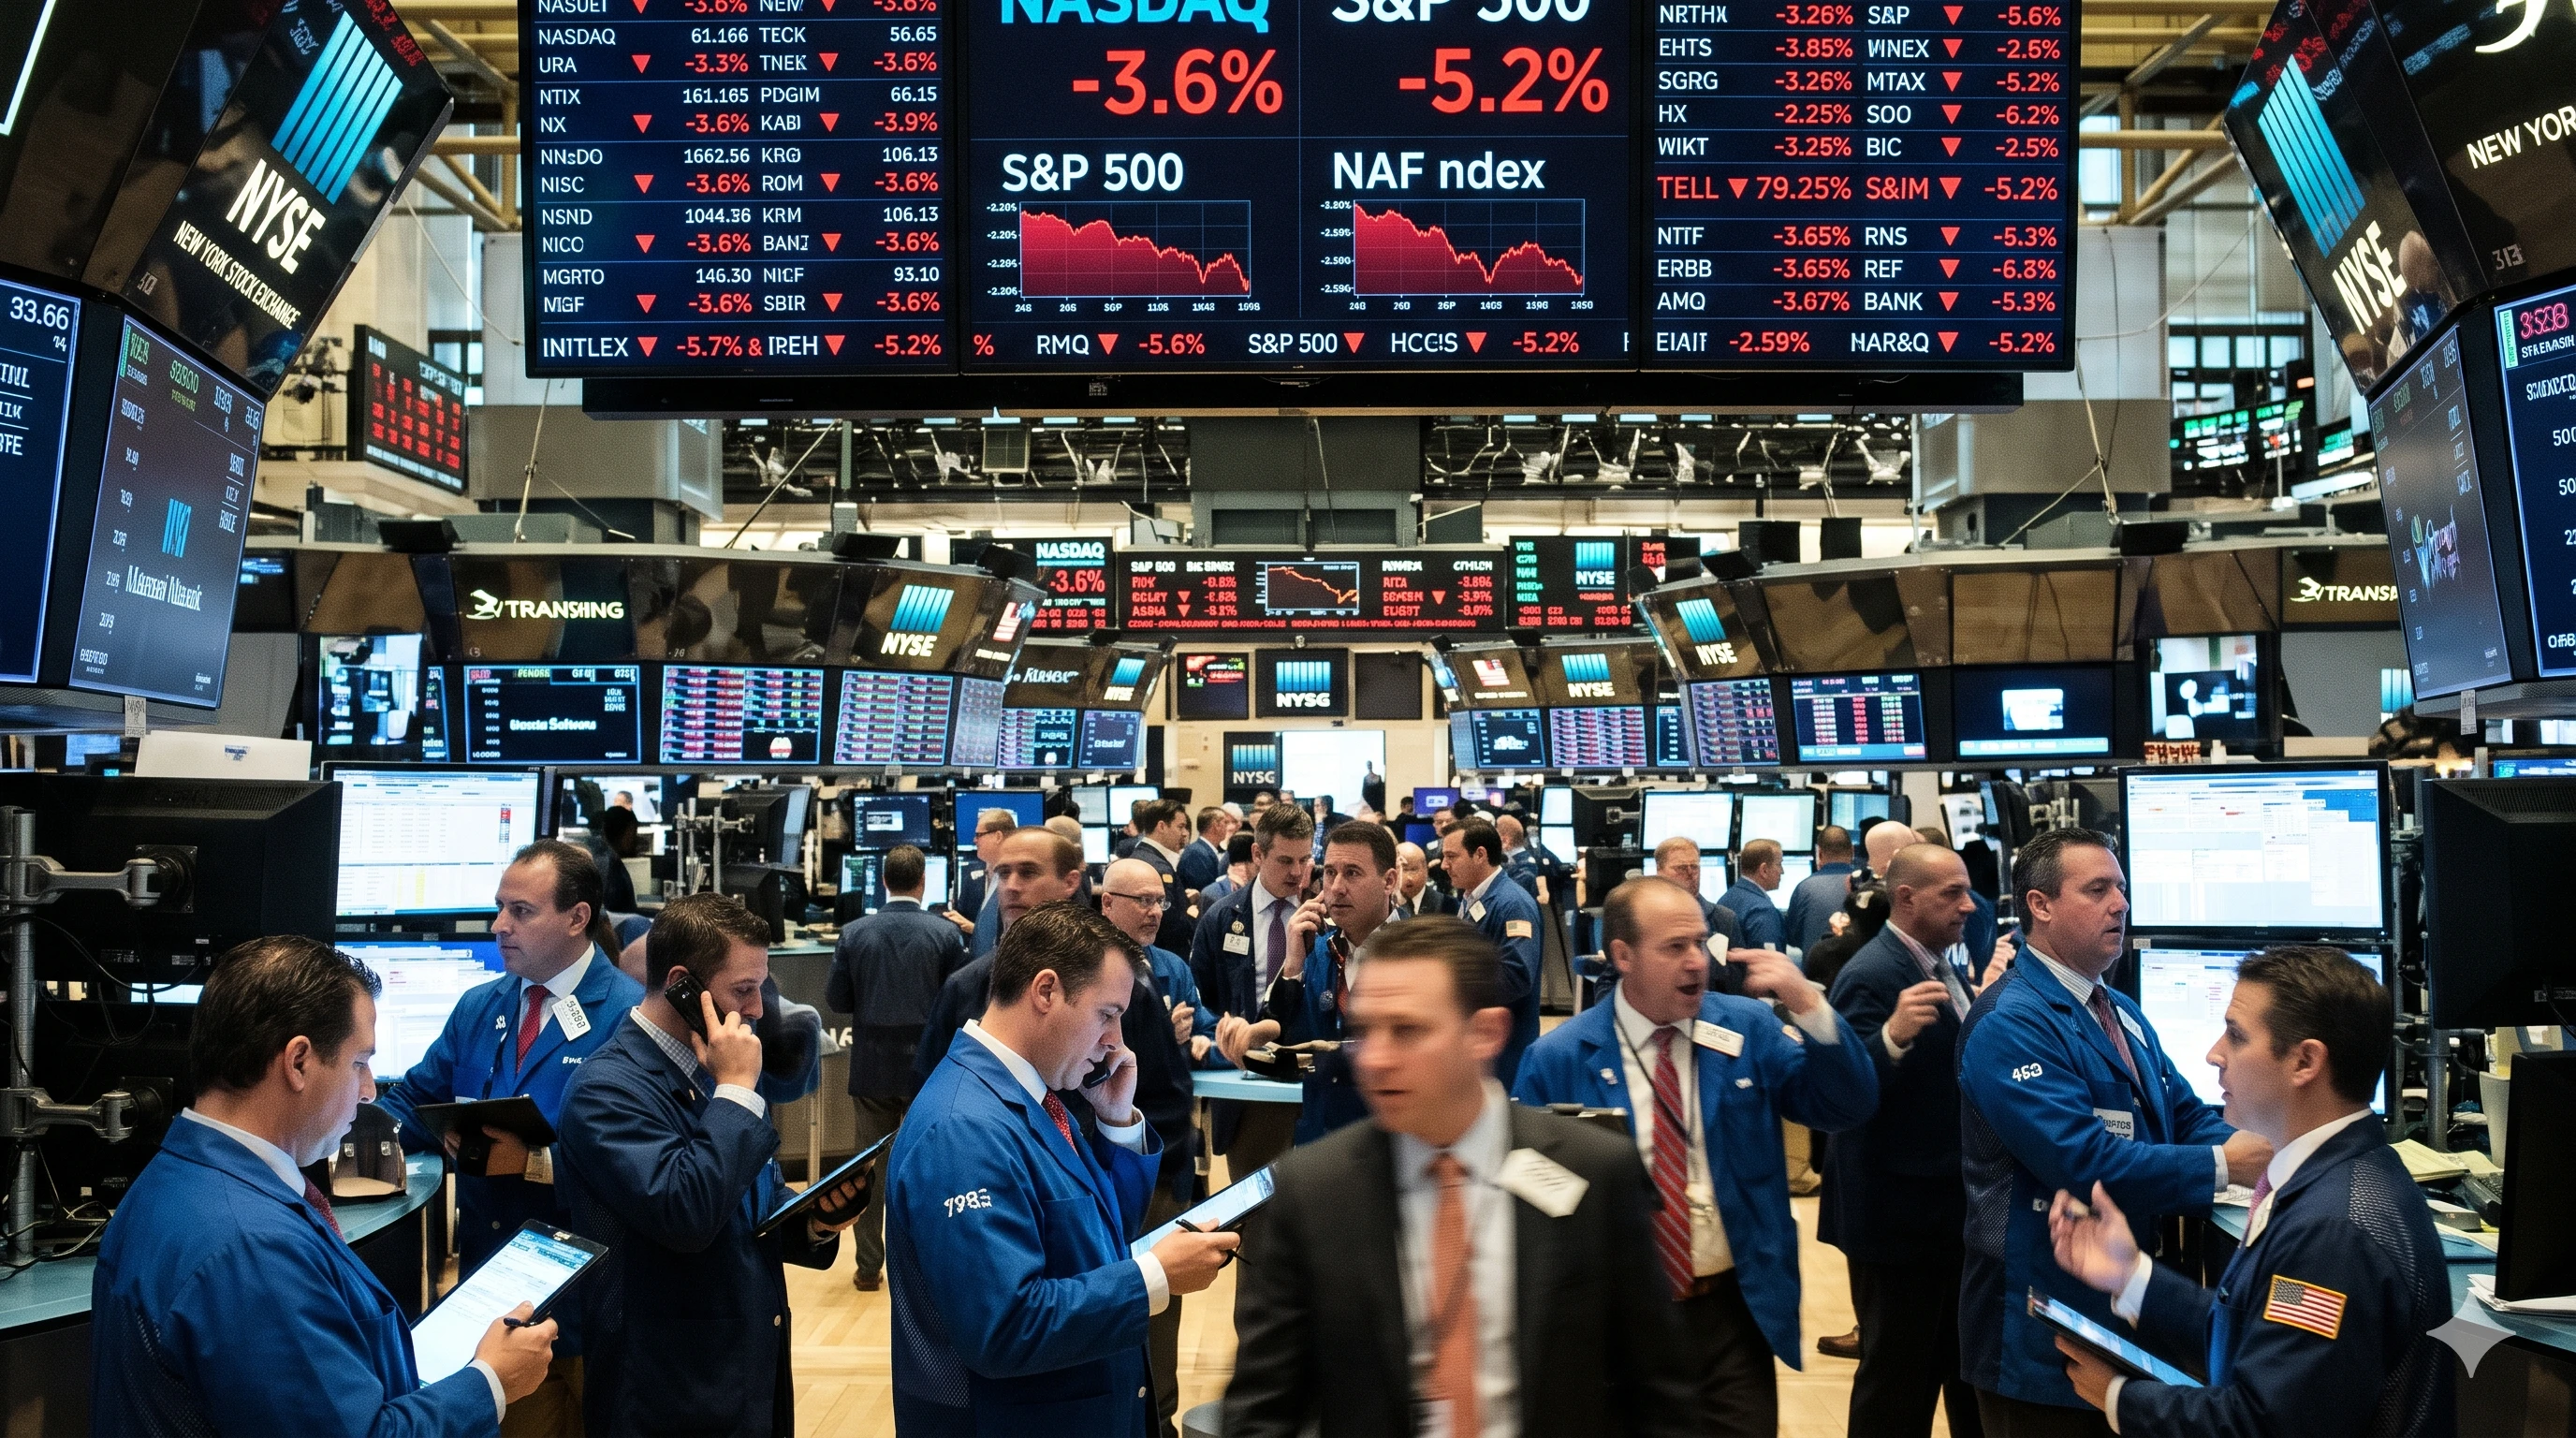
Tech Tumble: Wall Street Suffers Sharp Sell-Off as AI Trade Unravels
​U.S. technology stocks took a severe beating, dragging Wall Street into its steepest slump in months as investors rapidly reassessed valuations and capital spending across the sector. The tech-heavy Nasdaq led the downturn, sliding over 5% into official correction territory. The broader S&P 500 and Dow Jones Industrial Average followed closely, each shedding substantial ground.
​The rout was heavily concentrated in the semiconductor and AI infrastructure ecosystem. Chipmakers bore the brunt of
post-image
US500+0.32%
US30-0.46%
VOLX-5.58%
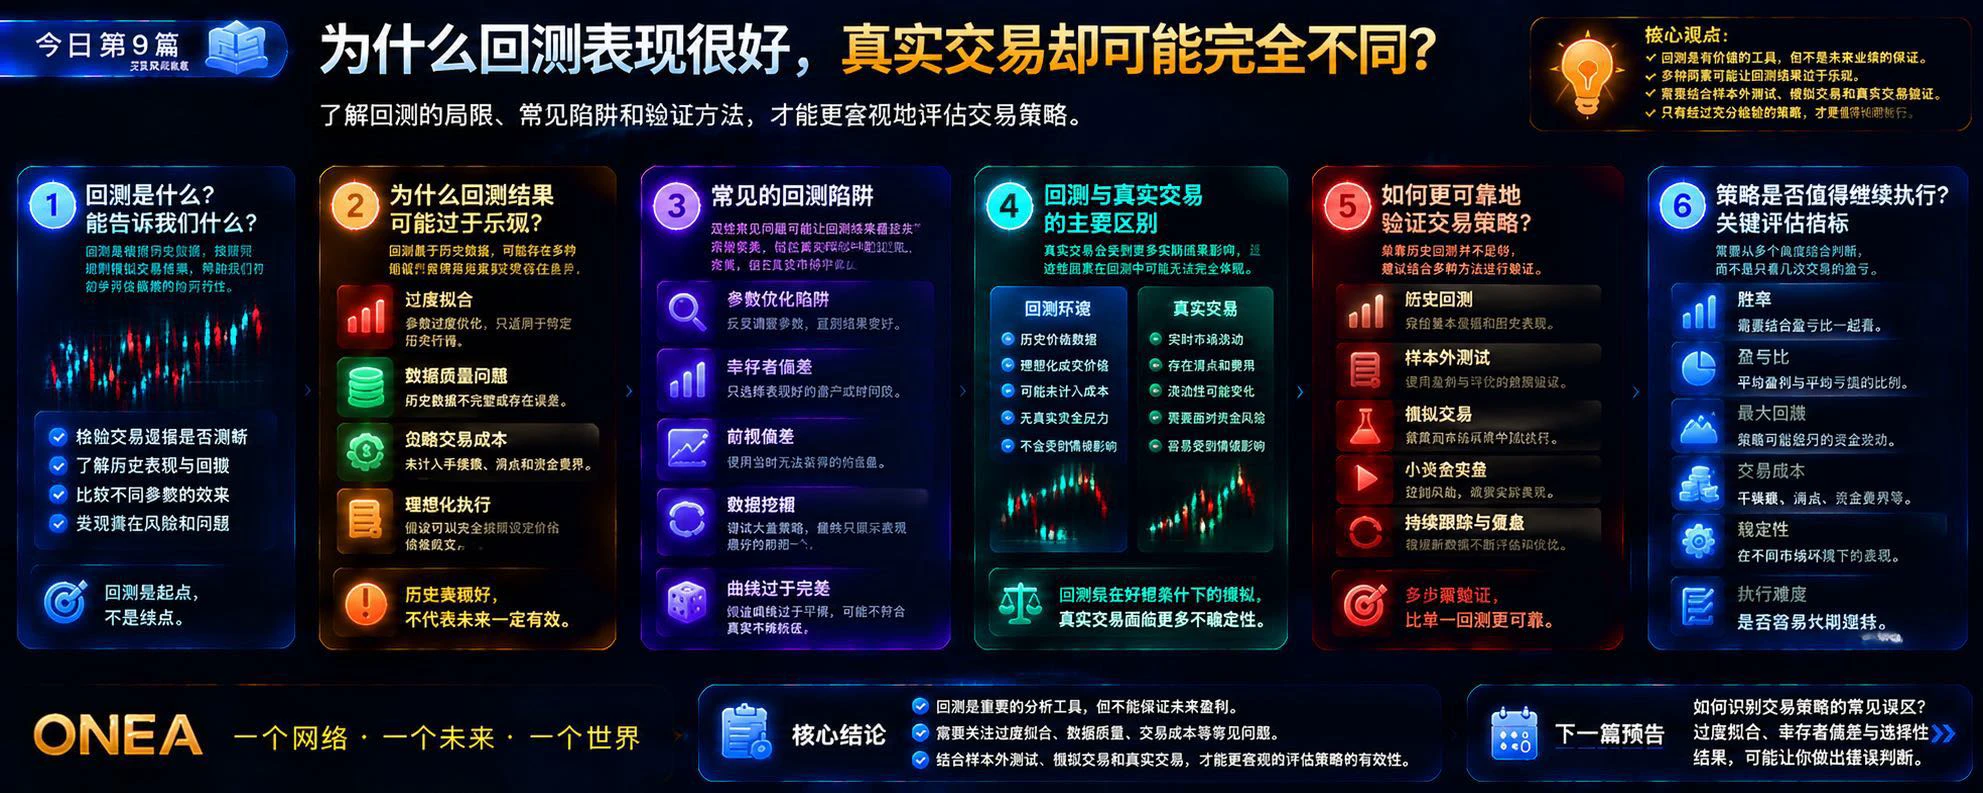
Why Can Backtest Results Look Great While Live Trading Turns Out Completely Different? Beware These Four Easily Overlooked Traps

In the cryptocurrency market, you may have seen trading strategies like these:

Historical backtests show a high win rate, an equity curve that keeps rising, and an apparently acceptable maximum drawdown. Strategy developers even show off impressive historical charts, making it seem that simply following the rules will produce good results.

But once you actually enter the market, the results may be completely different.

Actual execution prices differ from backtest
post-image
A friend has sold it before.
That's true, and this can significantly increase profits.
post-image
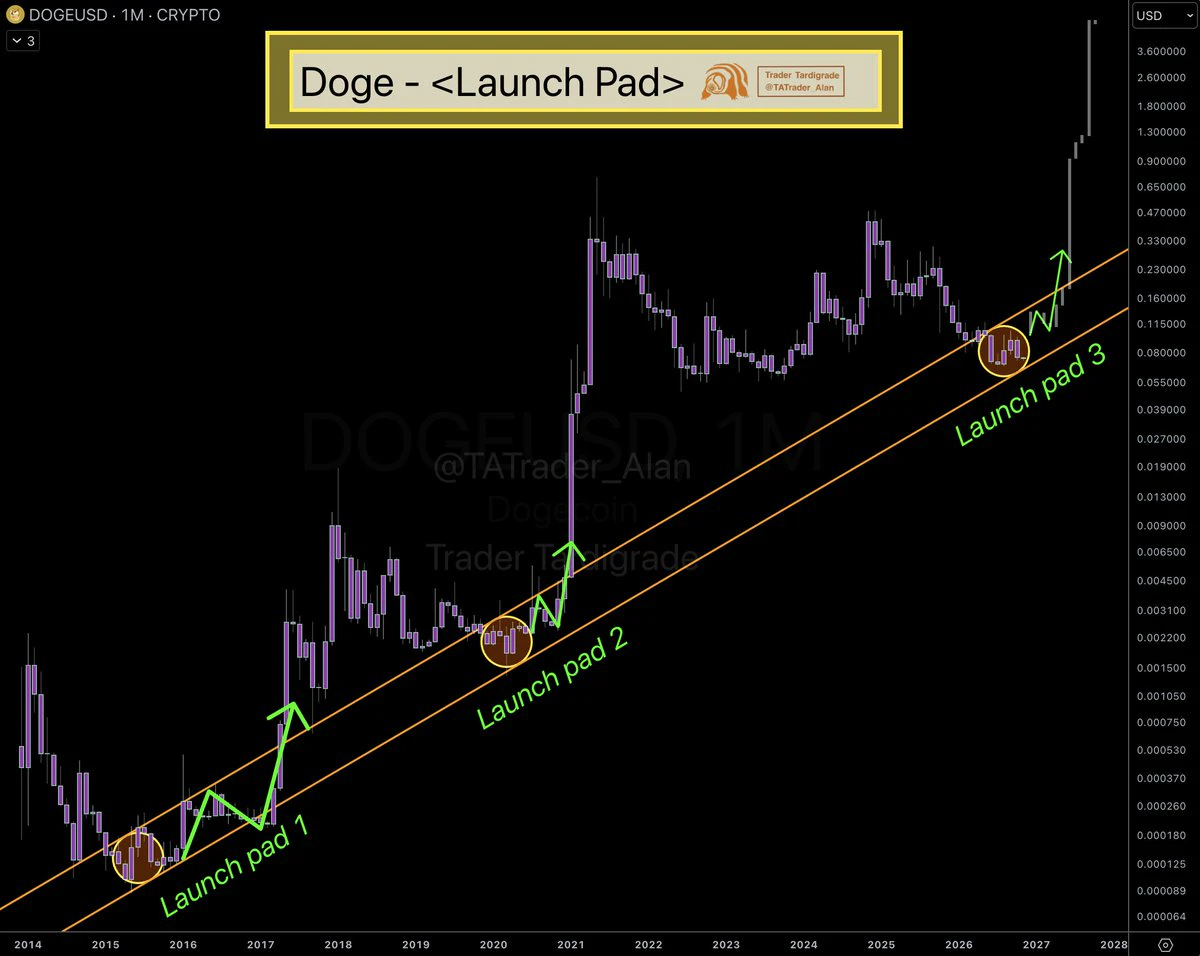
$DOGE /monthly
#Dogecoin is forming the third Launch Pad ❇️
The first two sat inside the same channel, consolidated, then took off.
Price is now back at the same spot in the channel, building the base for the next launch 🚀
post-image
DOGE-0.22%
Guys, market rallies are never smooth sailing. Spikes followed by pullbacks and retests after breakouts are common market rhythms.
Especially now, new developments in the news are causing fresh turbulence.

Some Democratic lawmakers have proposed restrictions on superintelligent AI agents, weighing on sentiment in the AI sector. Tech stocks such as SanDisk came under pressure, and weakness in the Nasdaq also dragged major risk assets lower.
Looking back at the past two days, after the US election results came in on November 4, $BTC briefly climbed back above 81000, and ETH also rebounded to a
post-image
BTC-0.65%
AKE+6.39%
Storage stock bagholders, check these levels! Don't panic #​MU #sndk
See the chart for specific levels:
I. SanDisk:
1. If you have little margin and are at risk of liquidation, hedge with a short at 902; it’s unlikely to reach 1000 in the short term.
2. Don’t blindly average down on your trapped long positions. Calculate based on your margin. 724 below is part of the weekly trend. If you haven’t averaged down before, add here. If your average entry price isn’t too high, add at 619; if it’s very high, wait for 520.
To reiterate, although we’re currently in a profit-distribution phase, the mar
SNDK-0.18%
#CryptoMarketUnderPressure
‍#DailyStandouts #ShareWeekly $ETH $XRP $SOL
Crypto Market Under Pressure: Macro Selloff or Internal Liquidity Stress?

Crypto is facing pressure from two directions at the same time. Bitcoin, Ethereum, Solana and XRP have all moved lower as global risk appetite weakened, but the decline is exposing something deeper: the crypto market's own liquidity and positioning conditions are not particularly strong either.

I would not treat this as just another temporary reaction to falling technology stocks.

The macro connection is becoming harder to ignore

The November 5
post-image
ETH-1.23%
XRP-1.12%
SOL-0.74%
  • 2
💰 Your stock insights deserve rewards—and to be seen
What signals do you look for when you’re bullish on a company? What concerns make you decide to keep waiting?

Join Gate Square’s stock discussion season to share your views and the reasoning behind them.
🌟 Each day, 3 quality creators will be selected to receive 5 USDT each, plus official featured placement to help more people see their valuable content.

Selection isn’t based on correctly predicting price movements or the number of posts. Well-supported opinions, valuable observations, and thoughtful reviews all have a chance to be selec
post-image
  • 1
  • 1
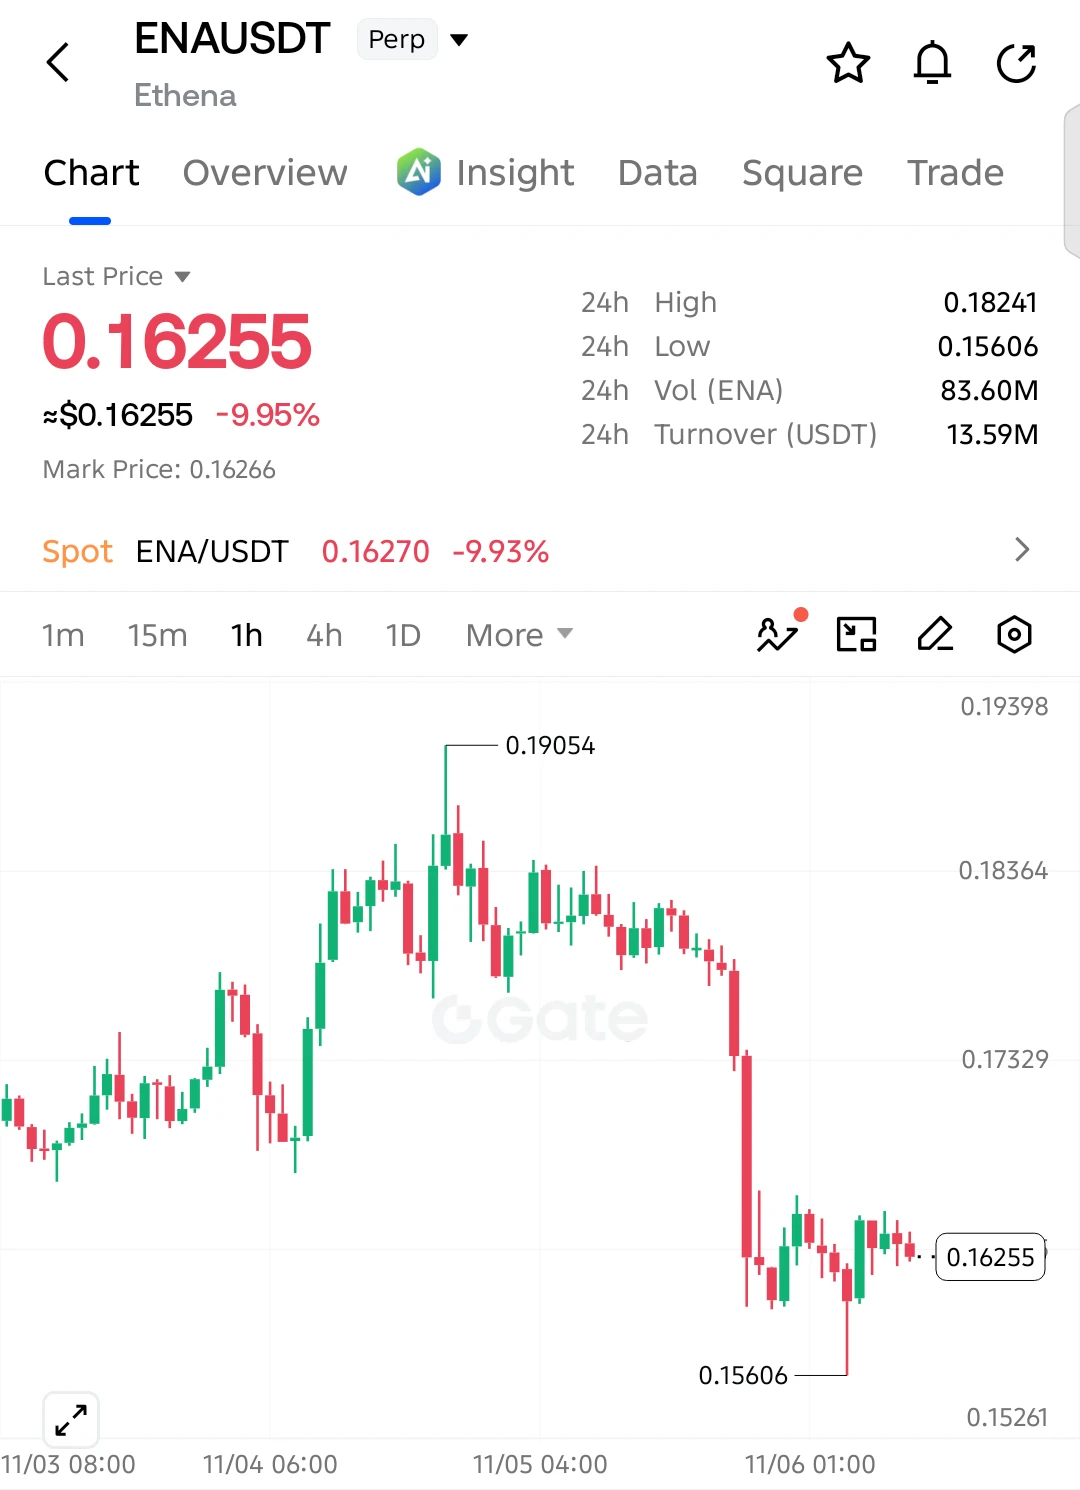
$ENA SHORT SETUP — BEARS ARE NOT DONE YET!

$ENA has plunged 9.95%, and sellers remain in control after a massive breakdown. The weak recovery suggests another downside move could be developing.

Entry: 0.16255
SL: 0.16620

TP1: 0.16000
TP2: 0.15800
TP3: 0.15606
Final Target: 0.15300

The chart shows strong bearish momentum, with price struggling to recover above 0.1650. If sellers maintain pressure and 0.15606 breaks, another wave of selling could push $ENA toward 0.15300.

Invalidation: A sustained recovery above 0.16620 weakens the bearish setup.
post-image
ENA+8.04%
  • 3
  • 2
CRYPTO MARKET AND CONCEPTS
live-cover
LIVE1,926
https://www.gate.com/zh/profile/网红迷迷佬

Subscriber-only link

Registration invitation code: VFGSXQ8JAA
  • 10
The daily correlation between the S&P 500 and the 10-year Treasury yield is close to zero. The latest reading on Bloomberg’s rolling correlation chart is just 0.0766, almost right on the zero line. This indicator ranges from -1 to 1. The closer it is to zero, the weaker the link between their daily moves. A negative reading represents the “inverse relationship” between bond and stock prices, where yields rise as the stock index falls; a positive reading means they move in the same direction. For most of the past, it was in negative territory, at one point reaching close to -0.8. Back then, whe
post-image
SPYX+0.01%
SPX+0.33%
NAS100-0.07%
  • 6
  • 2
Load More

Join 40 M users in our growing community

⚡️ Join 40 M users in the crypto craze discussion

💬 Engage with your favorite top creators

👍 See what interests you

Trending Topics

USStocksFaceHistoricSelloff

2.23k Views3.57k Discussing

U.S. stocks suffered a sharp selloff on Thursday, with the Nasdaq closing down more than 5% and the Philadelphia Semiconductor Index falling over 12%. AI and chip stocks including $NVDA and $AMD were hit especially hard. Markets are reassessing AI valuations, data-center spending and future returns. Is this just short-term deleveraging, or the start of a deeper correction in the AI trade? Which sectors are you watching next?

GateLaunchesPoSECProofOfSecurity

13.06k Views577 Discussing

USNonfarmPayrolls

11.25k Views4.01k Discussing

View More