Square
Following
Hot
News
Profile
Share your thoughts
placeholder
Article
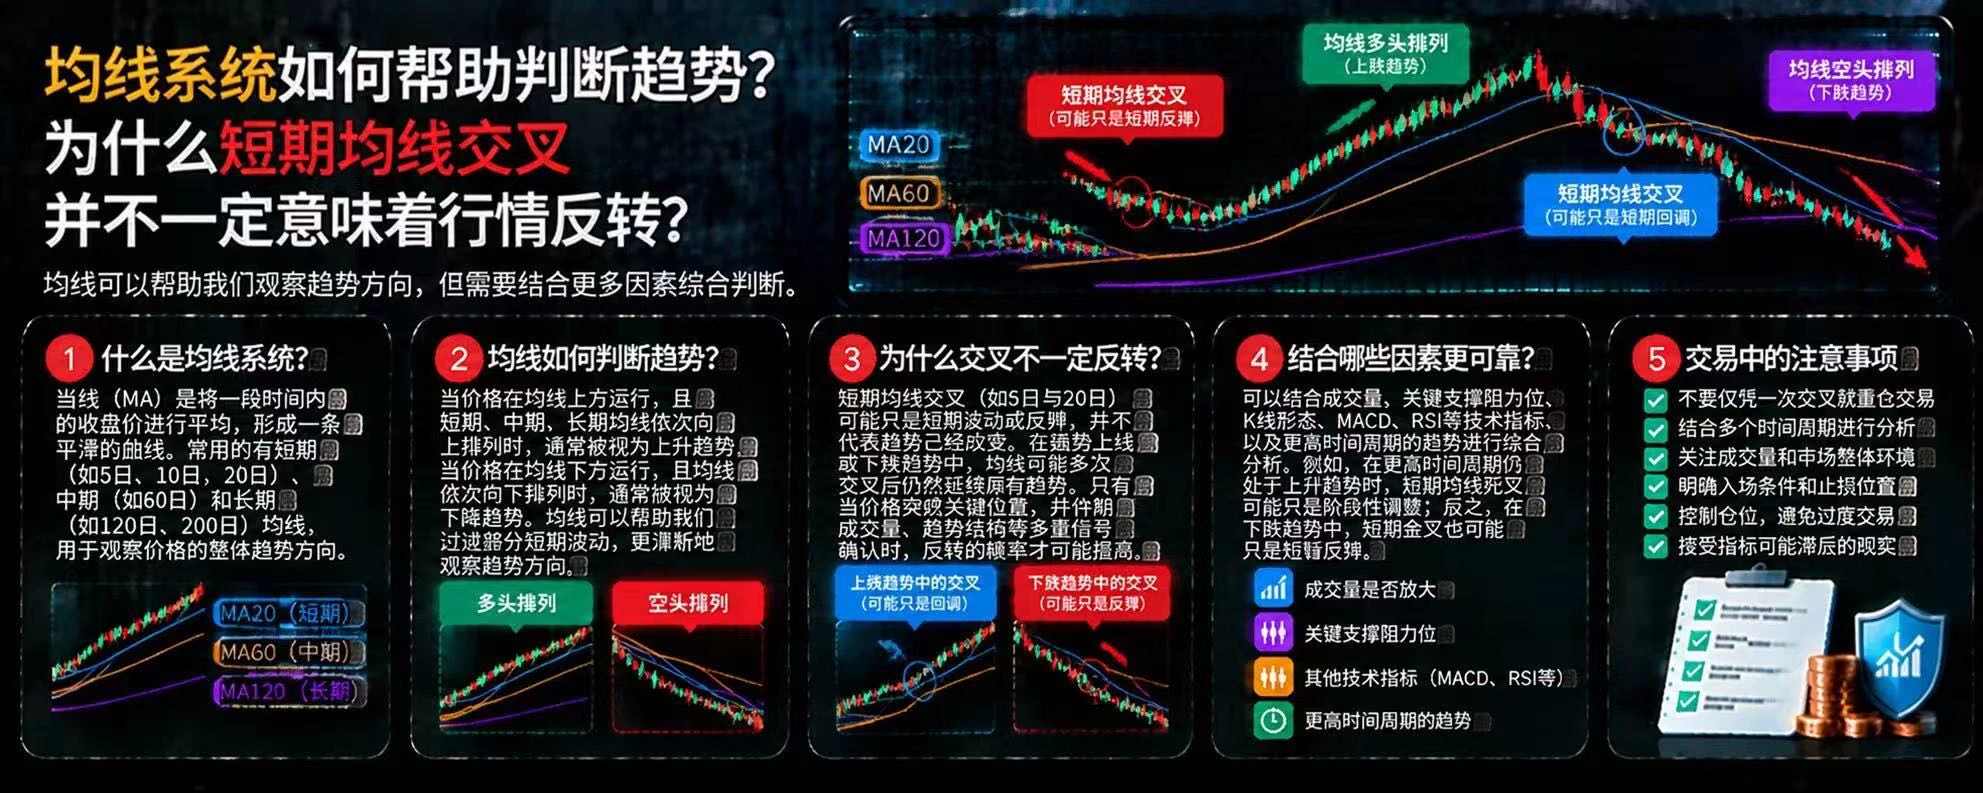
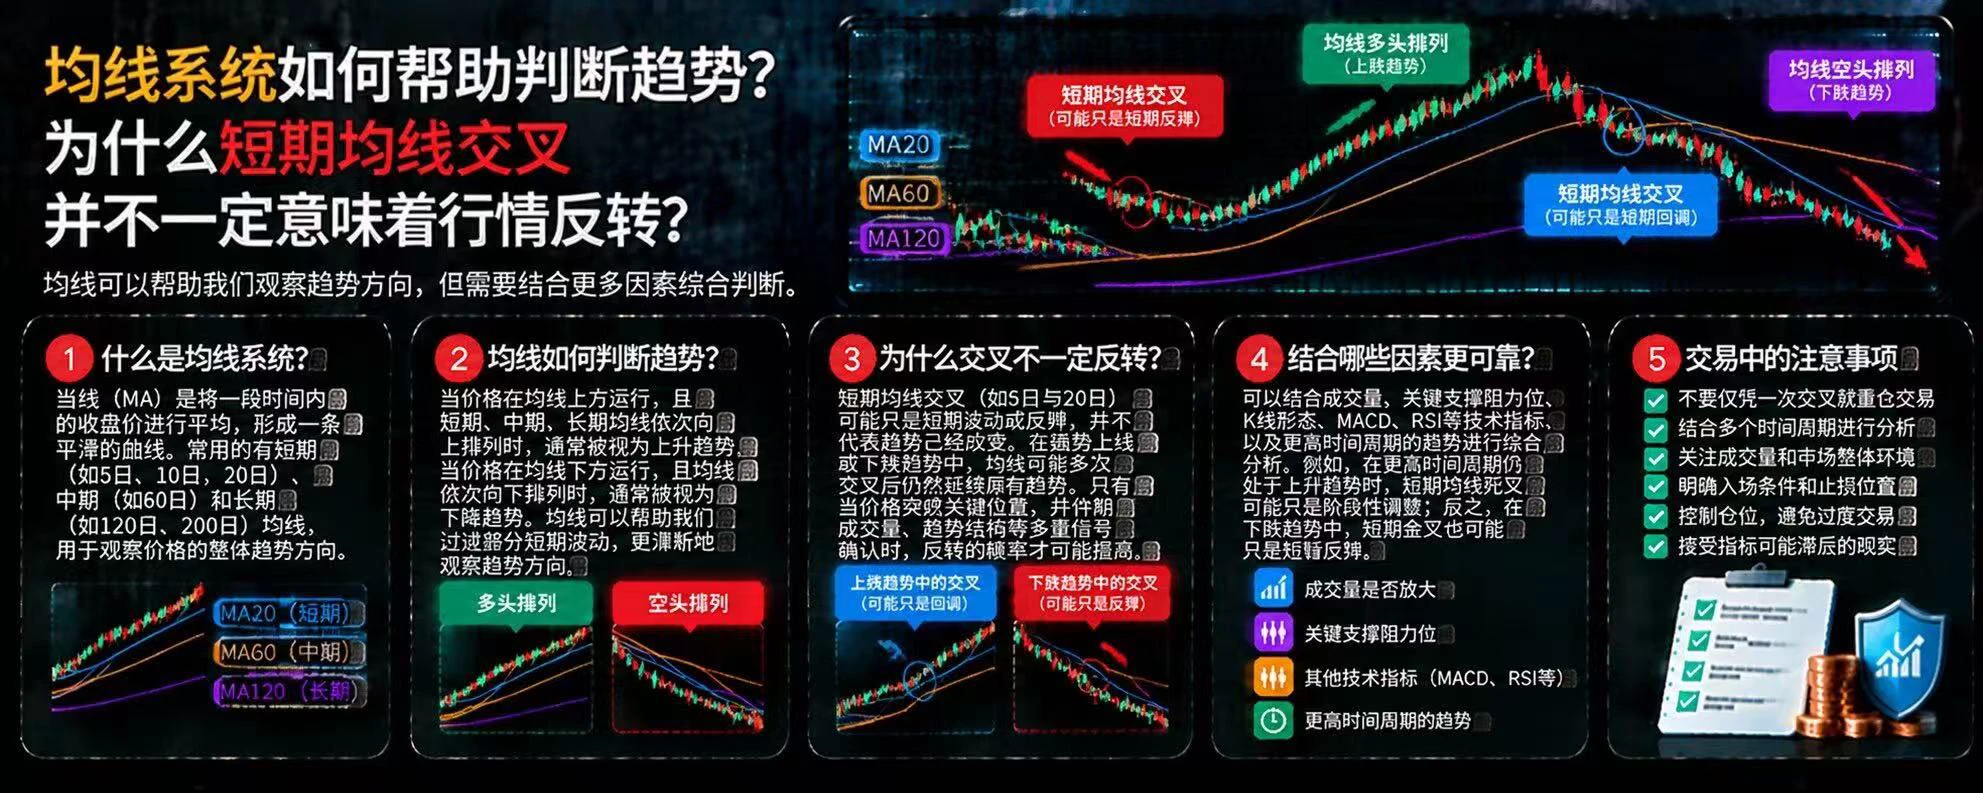
How Can Moving Average Systems Help Identify Trends? Why Don’t Short-Term Moving Average Crossovers Necessarily Signal a Reversal?
In the crypto market, moving averages (MAs) are a common tool for observing price trends. They smooth out short-term price fluctuations and help traders identify market direction, but moving average crossovers are not definitive signals for predicting price movements.
First, what is a moving average system?
A moving average is a curve formed by calculating the average price over a specific period. Common settings include MA20, MA60, and MA120, which are used to obs
post-image
$BTC – Bulls could be preparing for a strong rebound toward higher resistance levels ₿🚀Long $BTCEntry: 77,100 - 77,500SL: 76,000TP: 78,500 - 79,500 - 81,000$BTC is approaching a potential demand zone where buyers could step in and defend the current price structure. If this area holds and buying pressure starts to build, Bitcoin may regain bullish momentum and push toward the next resistance levels. A strong bounce supported by increasing volume would help confirm this recovery scenario.**Disclaimer: "This is only my personal opinion, not investment advice, and is not intended for Vietnamese
post-image
BTC-0.67%
Trenches
ZIG
Z
bade
b
ZIG
0x8c...1145
Market Cap
$.
Change
.
24h Vol
$.
Holders
.
IDOL
I
bade
b
IDOL
0x3b...ab07
Market Cap
$.
Change
.
24h Vol
$.
Holders
.
SAFU
S
bade
b
SAFU
0x7c...7777
Market Cap
$.
Change
.
24h Vol
$.
Holders
.
Q
Q
bade
b
Q
0xc0...0589
Market Cap
$.
Change
.
24h Vol
$.
Holders
.
STONK
S
bade
b
STONK
6GmA...UNgx
Market Cap
$.
Change
.
24h Vol
$
Holders
.
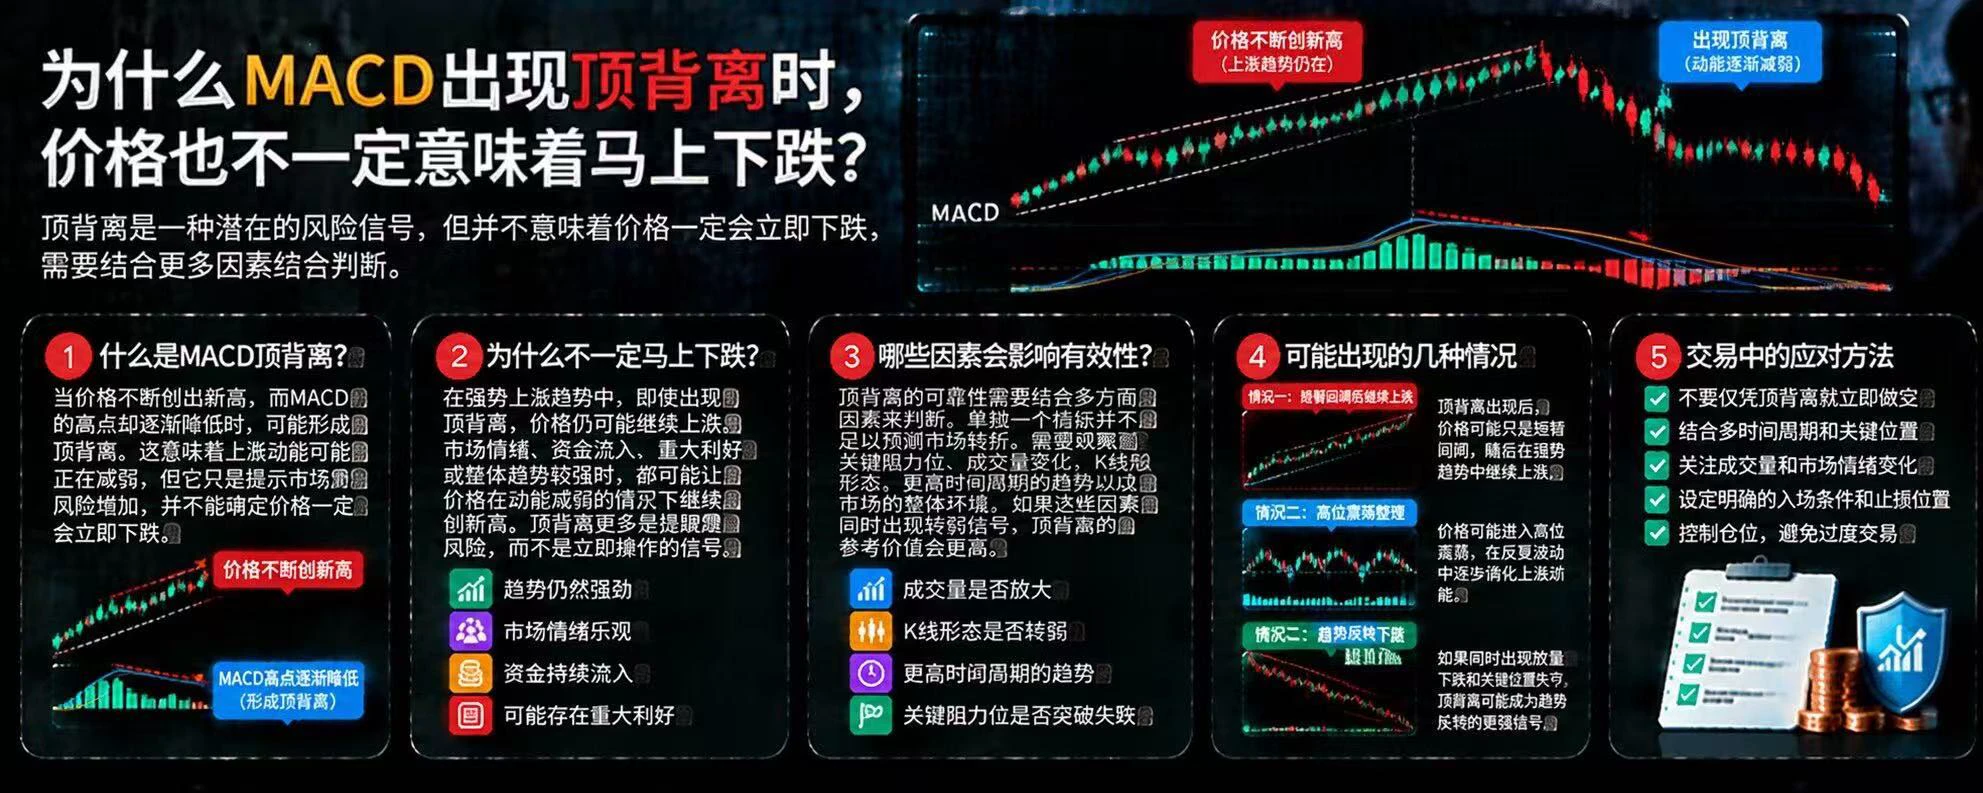
Why Doesn’t Price Necessarily Fall Immediately When MACD Shows Bearish Divergence?
In crypto markets, when prices keep making new highs while the highs on the MACD indicator gradually decline, bearish divergence may be forming. Many traders treat it as a short signal, but bearish divergence indicates that upward momentum may be weakening; it does not mean prices will necessarily fall immediately.
First, understand what bearish divergence means.
Bearish divergence typically occurs when price highs keep rising while the corresponding MACD highs gradually decline. This may indicate that upward mo
post-image
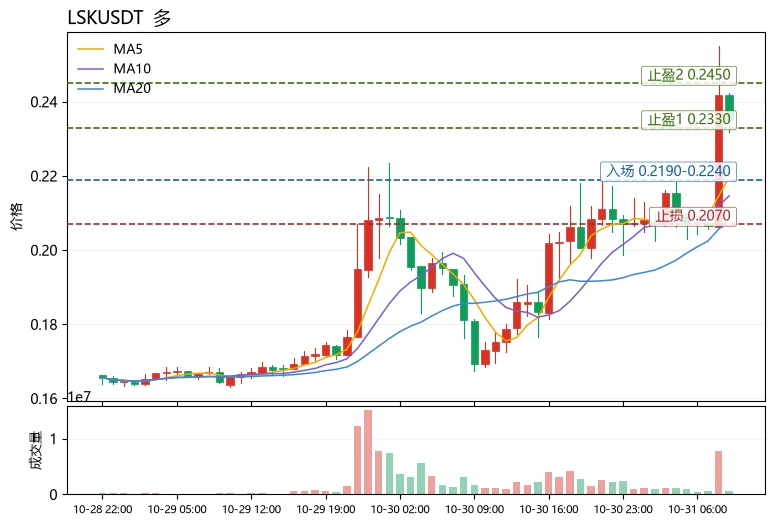
$LSK $LSK is currently at 0.2352. The upper Bollinger Band at 0.2333 has been breached, putting the price in a short-term overbought zone; MA5 at 0.2196 and MA20 at 0.2081 provide two levels of pullback support. The 24h range is approximately 37%, with volatility elevated, making the risk/reward for chasing longs unattractive.
Indicators show RSI at 69.7, nearing the 70 overbought threshold. The MACD histogram at +0.002167 remains bullish but is nearing the end of its acceleration phase. The funding rate is negative at -0.2225%, indicating shorts are paying and squeeze momentum remains, but als
post-image
LSK-5.32%
PARTI-1.06%
DOGE-0.22%
Is the economy really this bad now?
post-image
Short $IDOL ‼️ Entry: now / current market price Take profit: 0.01872 Stop loss: 0.02850
post-image
IDOL-6.71%
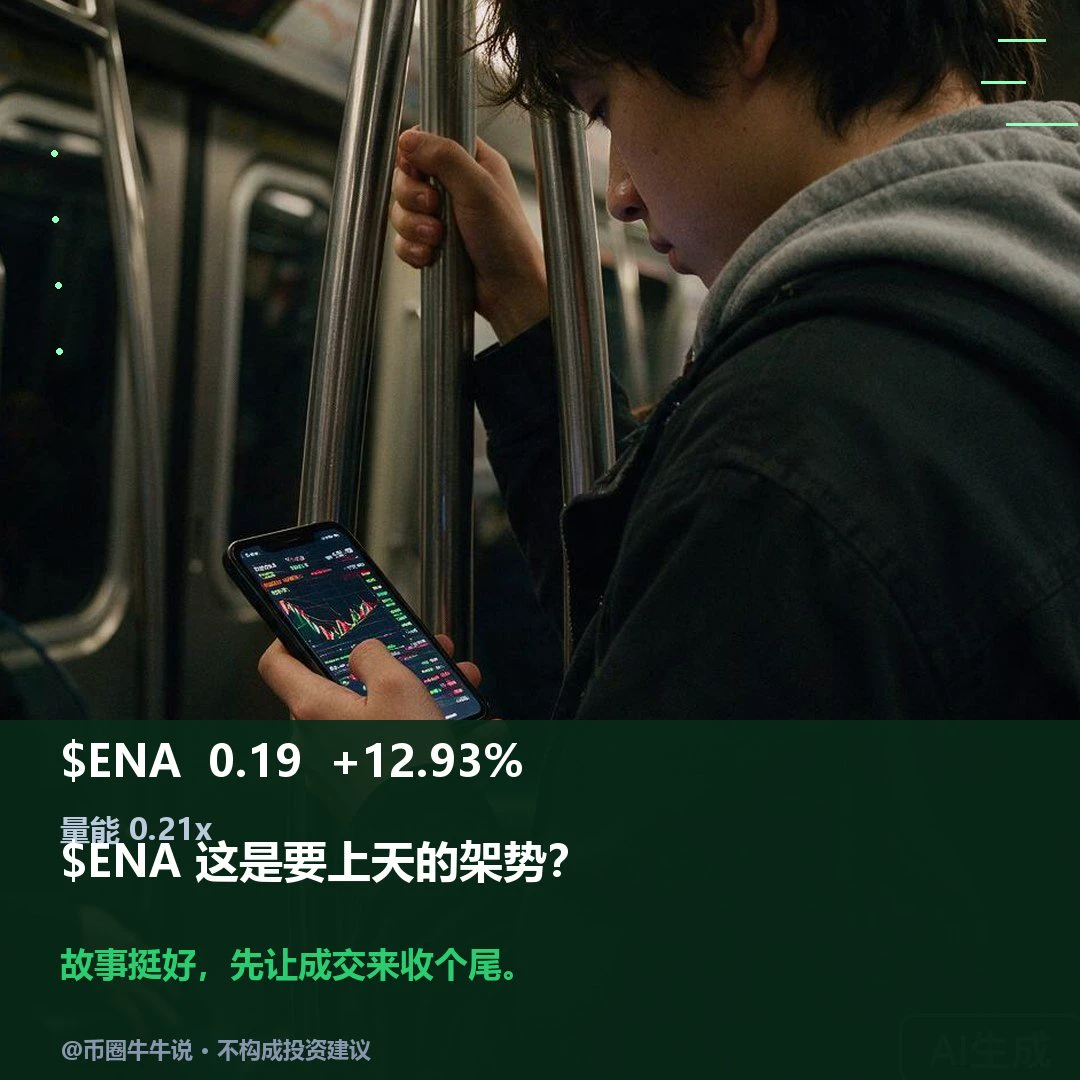
$ENA is currently trading at 0.1913, up 12.93% over the past 24 hours. The 1H trend is strong, while the 4H trend is weak, indicating a clear short-term divergence. If it holds above the 0.1973 resistance, the outlook may turn bullish; if it falls below the 0.1724 support, it may weaken. Watch whether it can hold above resistance and reclaim support if it breaks down. The market is volatile; for observation purposes only.
post-image
ENA+8.04%
Quant, which builds tokenized deposit rails for The Clearing House and 7 UK banks, says a Singapore supplier can be paid once a London bank locks the funds.
Today that can take days.
@quantnetwork
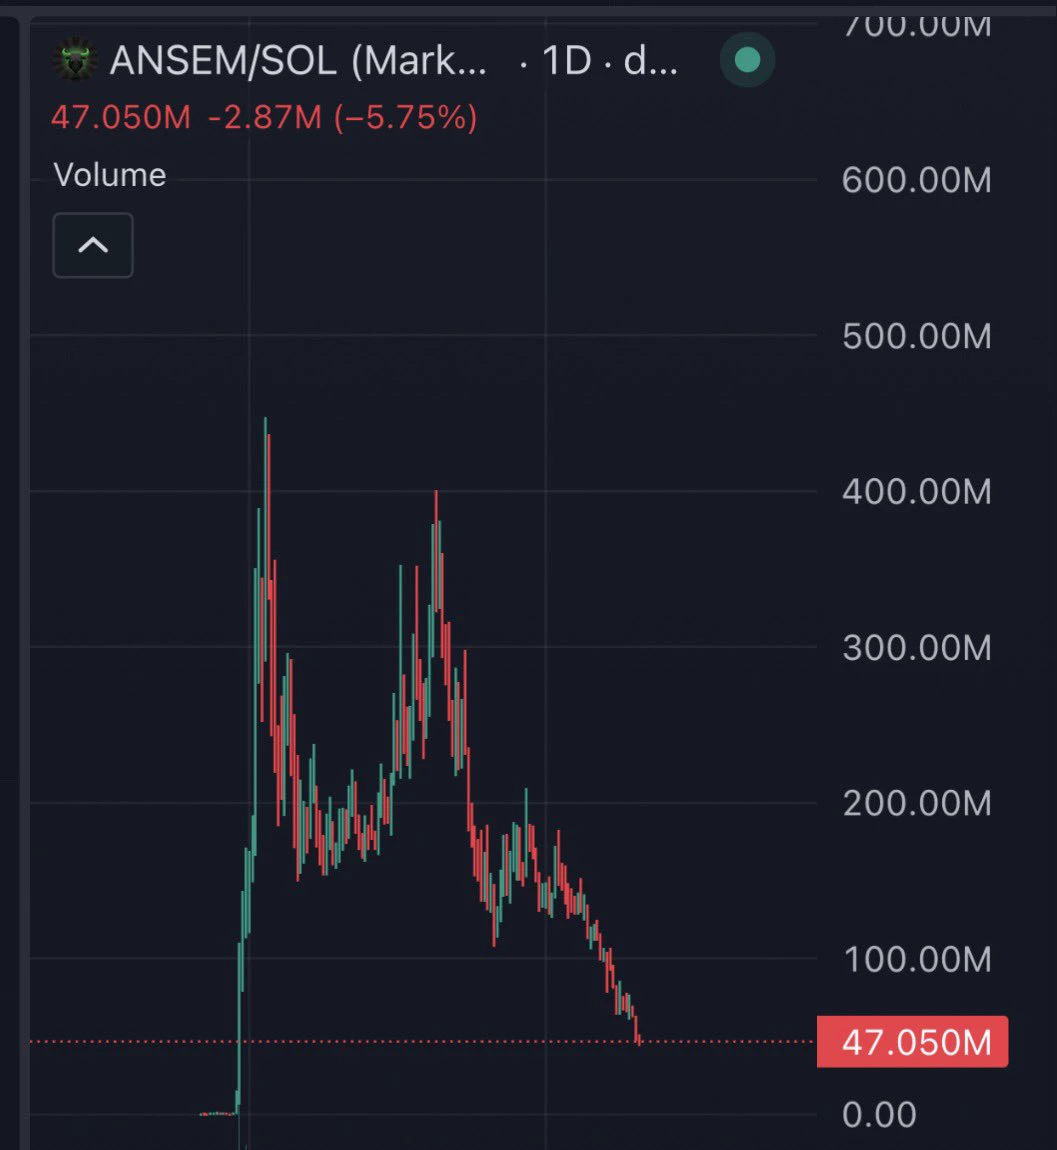
Ansem will soon realise attaching yourself to your own meme coin was biggest mistake
You sent that shit to 400m and they STiLL weren’t happy
Now your stuck with a bunch of parasites begging for the next pump 🚶🏾‍♂️🚶🏾‍♂️🚶🏾‍♂️🚶🏾‍♂️🚶🏾‍♂️
post-image
MEME-0.94%
Those who followed are making big gains$BTC ‌
post-image
BTC-0.65%
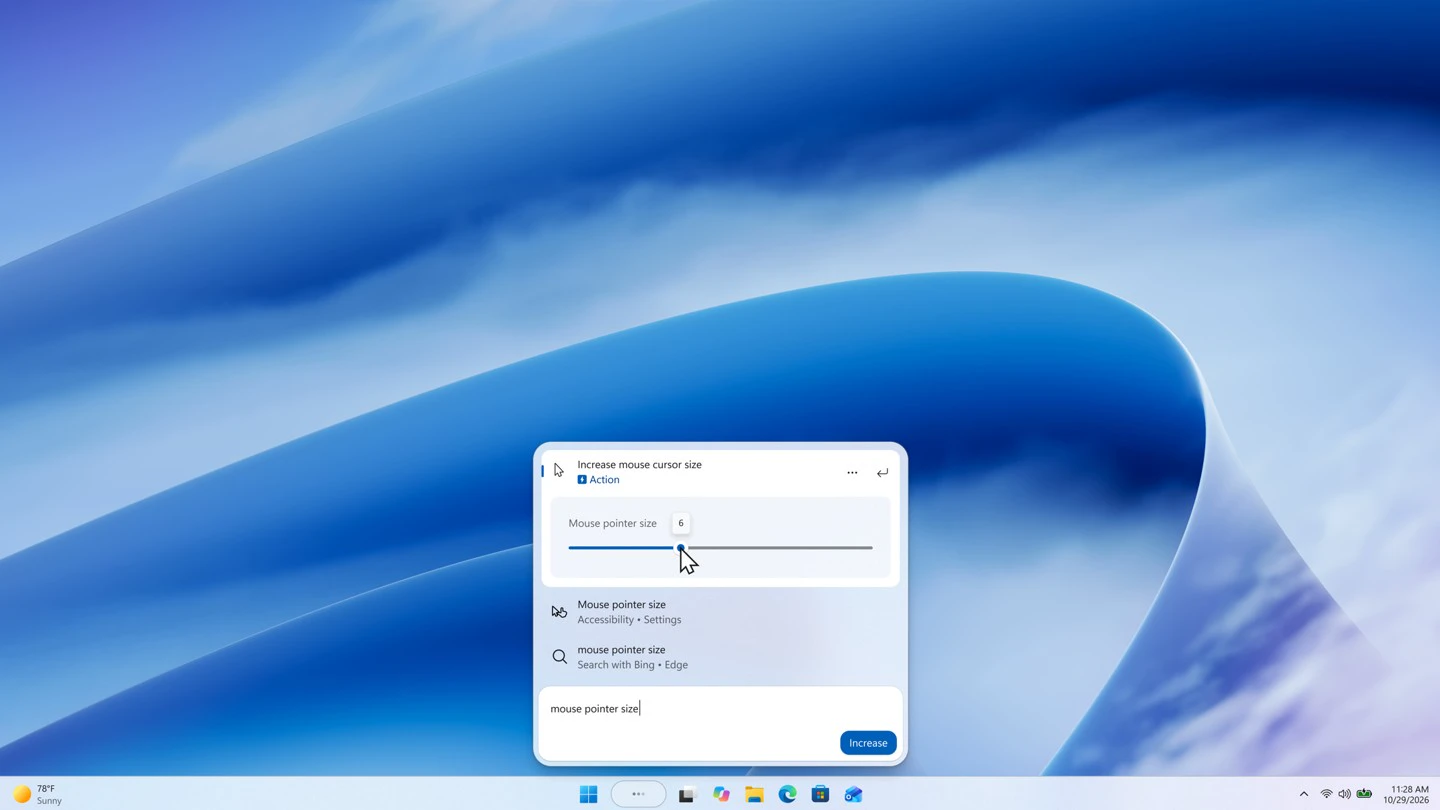
Microsoft lets users adjust brightness and volume directly from the search bar in a Win11 preview build, replacing the traditional Settings entry.
Centralizing controls seems convenient, but the added sliders may make the search bar more complex.
$BTC
#量化达人# Let’s talk about quant trading and market trends. What do you think?
post-image
BTC-0.67%
Hey @grok remove the most hated crypto guy from the photo?
post-image
[New Streamer] Whales Moves in Sync!
live-cover
LIVE1,899
$PREDICT is gearing up for a major move, with a huge liquidity zone now appearing overhead🤩Long now🔥🔥Tp1: 1.45Tp2: 1.7Tp3: 2.1Sl: 1.02predict congabeo$IDOL $EVAA
post-image
PREDICT+13.07%
IDOL-6.71%
EVAA-0.49%
Bad Boy Watch: SPCX Update 10.31
Big Rocket closed at 134.72 in Friday's US trading session, down 6.37%, with an intraday high of 140.20 and a low of 134.50.
On Black Friday, most tech stocks couldn't escape a sharp sell-off.
Let's look at Big Rocket's candlestick chart. It has now reached the lower edge of the price channel. Whether it can hold at this level next week is quite important.
The intraday chart shows the bad boy opened a long position (137.20), rebounded to a high near 140, then fell all the way below the IPO price of 135.
There are still several key levels to trade. First, let's
SPCX+0.20%
BTC falls below $80k, and I actually start keeping a close eye on these prices!
Bitcoin has fallen to $77k, breaking below the key $80k level, and the market has instantly switched from “the bull market is just around the corner” to “are we heading into a bear market?” I have to say, crypto investors’ emotions are even more intense than Bitcoin’s candlestick chart!
But viewed from another angle, this pullback may not be all bad. The concentrated liquidation of leveraged longs means some irrational positions are being cleared out. What’s really worth watching isn’t how much prices have fallen t
NVDA-4.16%
  • 35
How Can Moving Average Systems Help Identify Trends? Why Don’t Short-Term Moving Average Crossovers Necessarily Signal a Reversal?
In the crypto market, moving averages (MAs) are a common tool for observing price trends. They smooth out short-term price fluctuations and help traders identify market direction, but moving average crossovers are not absolute signals for predicting price movements.
First, what is a moving average system?
A moving average forms a curve by calculating the average price over a given period. Common settings include MA20, MA60, and MA120, which are used to observe shor
post-image
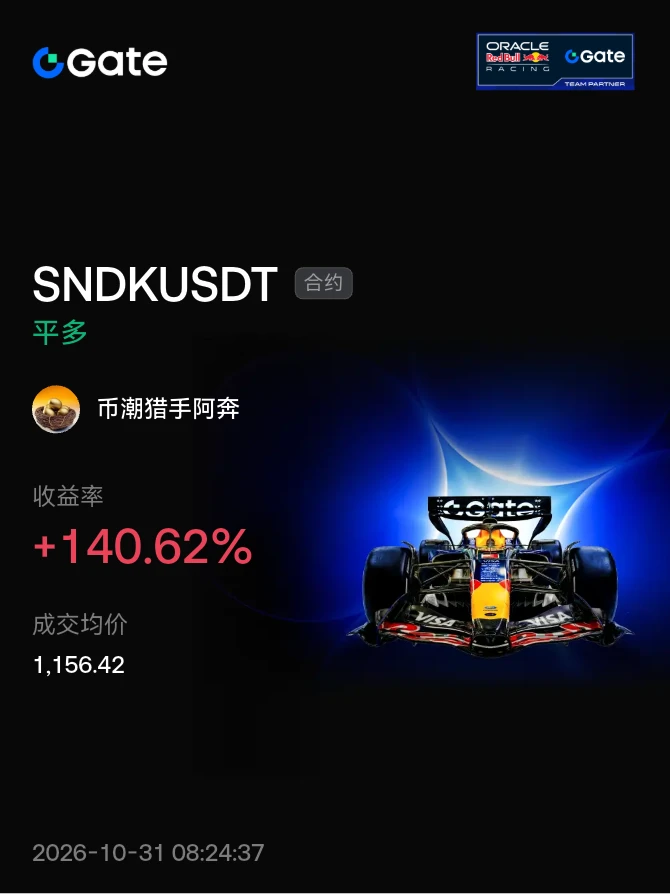
#晒出我的合约收益 SanDisk plunged as U.S. stocks tumbled last night. As for the trade I shared with everyone on livestream, following Friday’s sell-off and with U.S. markets closed over the weekend, a rebound and recovery may be in store over these two days. I woke up and grabbed a bite; now that it’s pulled back below 40, I’m preparing to keep going long at lower levels
post-image
SNDK-0.18%
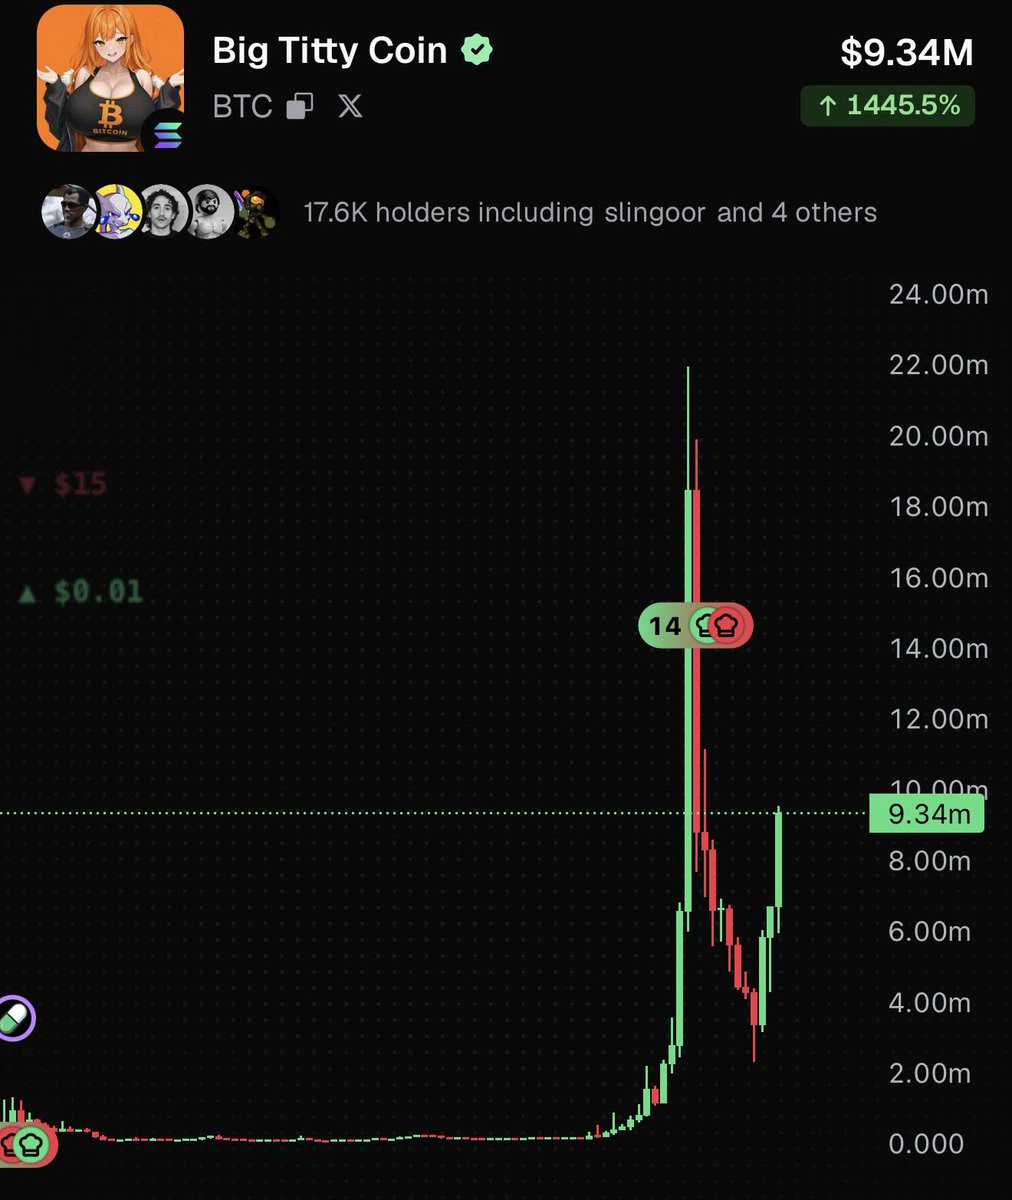
Slingoor has injected over $200,000 back into his own project and sold none.
Meanwhile Ansem has let his project die while he pocketed millions.
post-image
ANSEM-4.82%
Load More

Join 40 M users in our growing community

⚡️ Join 40 M users in the crypto craze discussion

💬 Engage with your favorite top creators

👍 See what interests you

Trending Topics

BTC大跌

195.25k Views39.51k Discussing

$BTC briefly fell below $77,000 and remains under pressure around the $77K zone, with its 24-hour decline still above 4%. With risk appetite weakening and Fed uncertainty rising, where is the next key support after losing $80K?

IntelBeatsEarningsButStockPlunges

13.91k Views732 Discussing

StrategySTRCNears100ParValue

17.57k Views4.03k Discussing

View More