




Square
Following
Hot
News
Notifications
Profile
Share your thoughts
placeholder
Article
#ShareWeekly #BTC #WCTCS9

The U.S. spot Bitcoin ETF market has recorded another significant wave of institutional withdrawals, with total net outflows reaching approximately $412 million. What makes this development particularly noteworthy is BlackRock's iShares Bitcoin Trust (IBIT), which alone recorded approximately $403 million in net outflows. This means IBIT accounted for nearly 98% of the total reported withdrawals, making it the central focus of this market development.

Rather than viewing this figure as an ordinary daily movement, I believe it deserves a deeper examination of instit
post-image
BTC-0.67%
IBIT-1.56%
Market Updates ABout BTC, ETH, SOL and ZEC...
live-cover
LIVE547
Trenches
牛逼
牛
bade
b
牛逼
0x96...7777
Market Cap
$.
Change
.
24h Vol
$.
Holders
.
STONK
S
bade
b
STONK
6GmA...UNgx
Market Cap
$.
Change
.
24h Vol
$.
Holders
.
BTC
B
bade
b
BTC
C5xp...pump
Market Cap
$.
Change
.
24h Vol
$.
Holders
.
PUSSY
P
bade
b
PUSSY
FZxH...Loat
Market Cap
$.
Change
.
24h Vol
$.
Holders
.
PIEVERSE
P
bade
b
PIEVERSE
0x0e...25a9
Market Cap
$.
Change
.
24h Vol
$.
Holders
.
JUST IN: Anthropic officially launches world's most powerful Claude AI models 'Fable 5.2' and 'Mythos 5.2.'
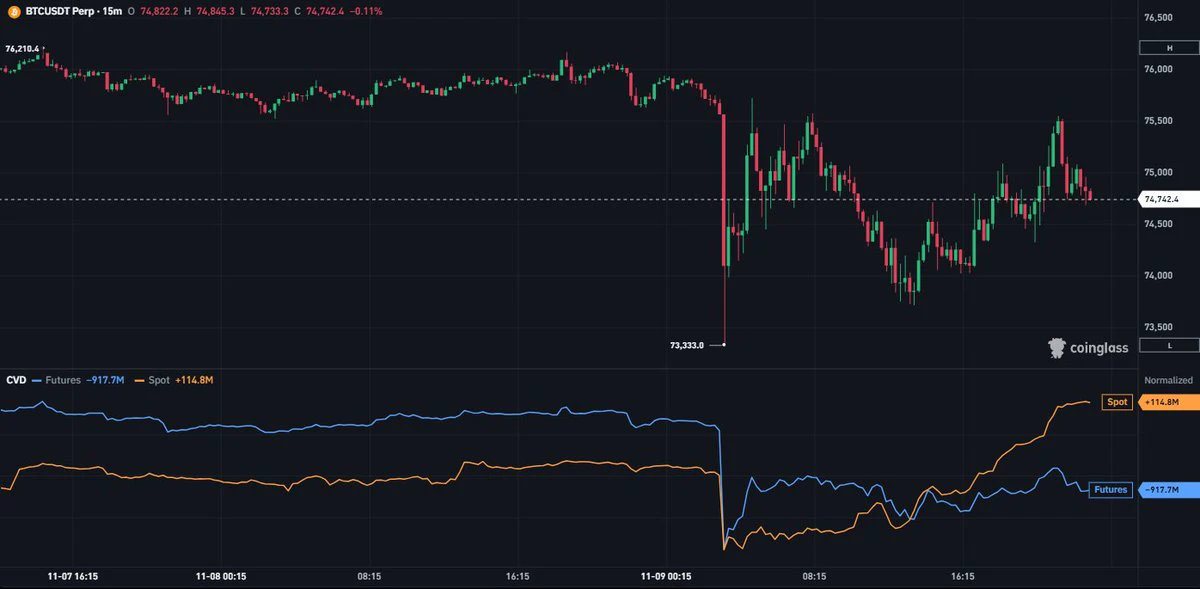
Take a look at the spot buying
It has been going up since the US market open and yet Bitcoin has been underperforming stocks
Why?
Because perps are shorting like hell, and this has been happening for weeks now
It looks like someone is trying to fill their billion dollar balance sheet hole
post-image
BTC-0.67%
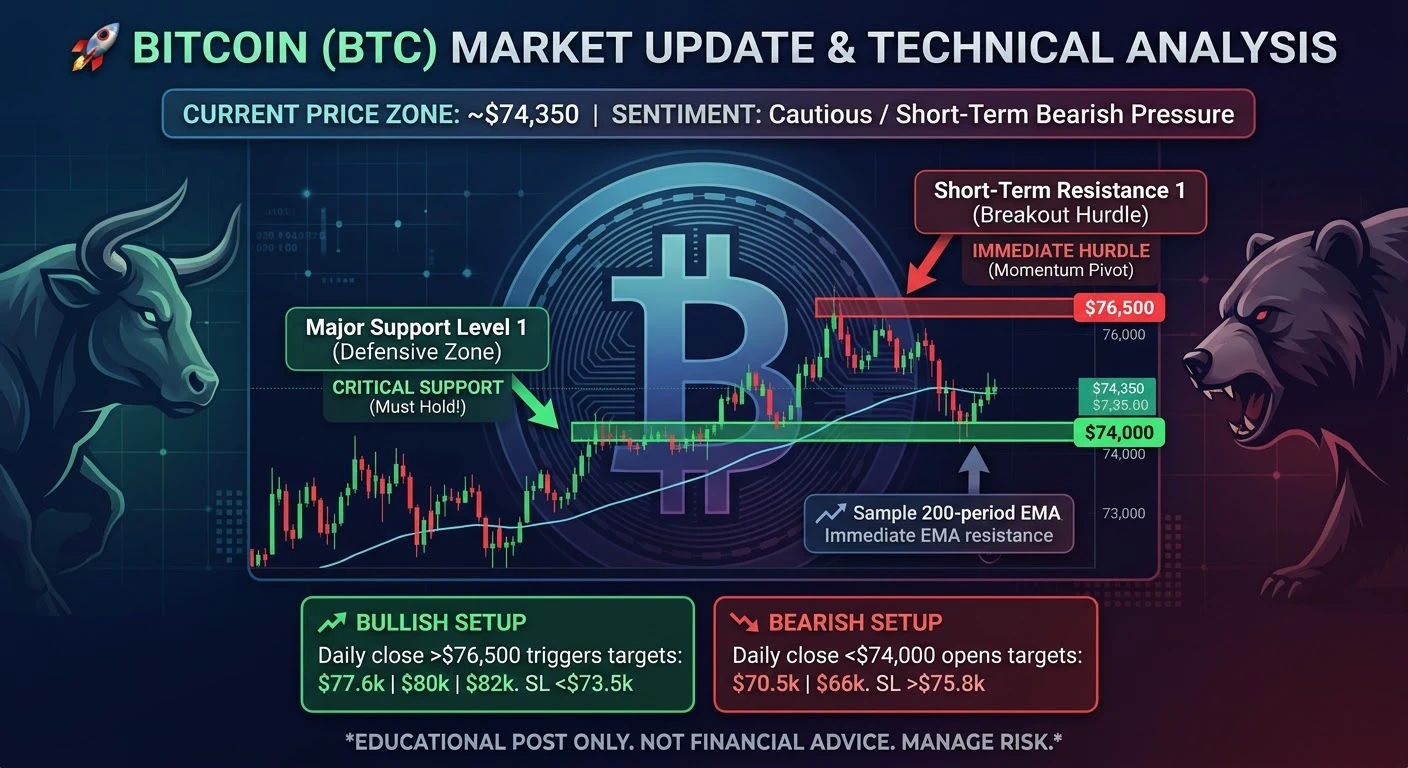
Market Overview:
Bitcoin has faced downward pressure, slipping toward the $74,000 region. Recent market headwinds—including shifting political developments, regulatory uncertainties, and institutional ETF outflows—have dampened immediate risk appetite. Bulls are currently fighting to defend critical multi-week support floors to prevent a deeper correction.
📈 Key Technical Levels to Watch:
🟢 Key Support Levels:
$74,000 – $74,200: Immediate test zone. Holding this level is vital for a short-term relief bounce.
$66,000: Major medium-term structural support level.
$NVDA ‌$GOOGL ‌#USCPIDataIn
post-image
NVDA-5.60%
GOOGL+1.84%
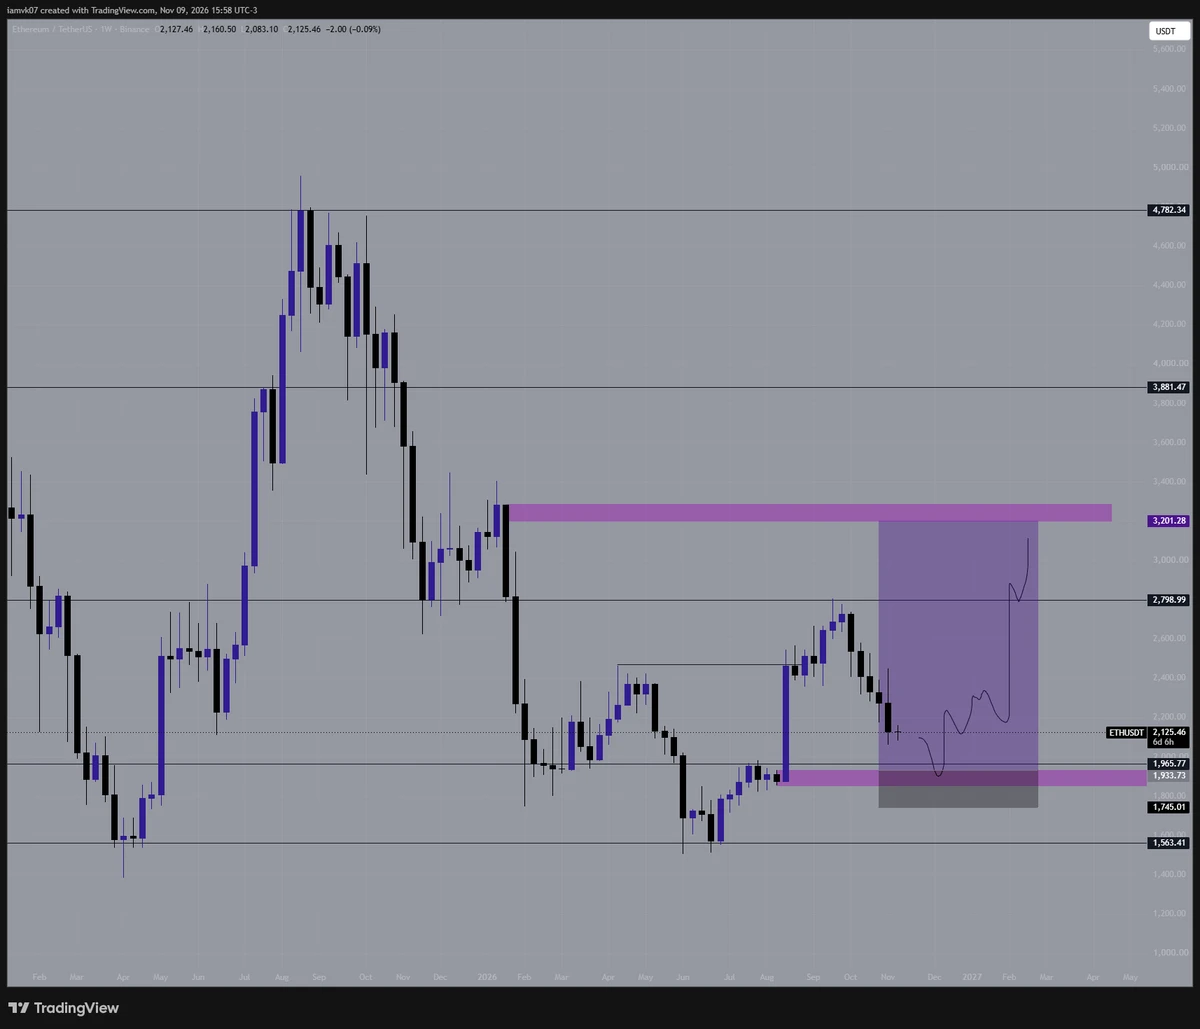
$ETH the only swing long i'm looking at right now.
post-image
ETH-1.26%
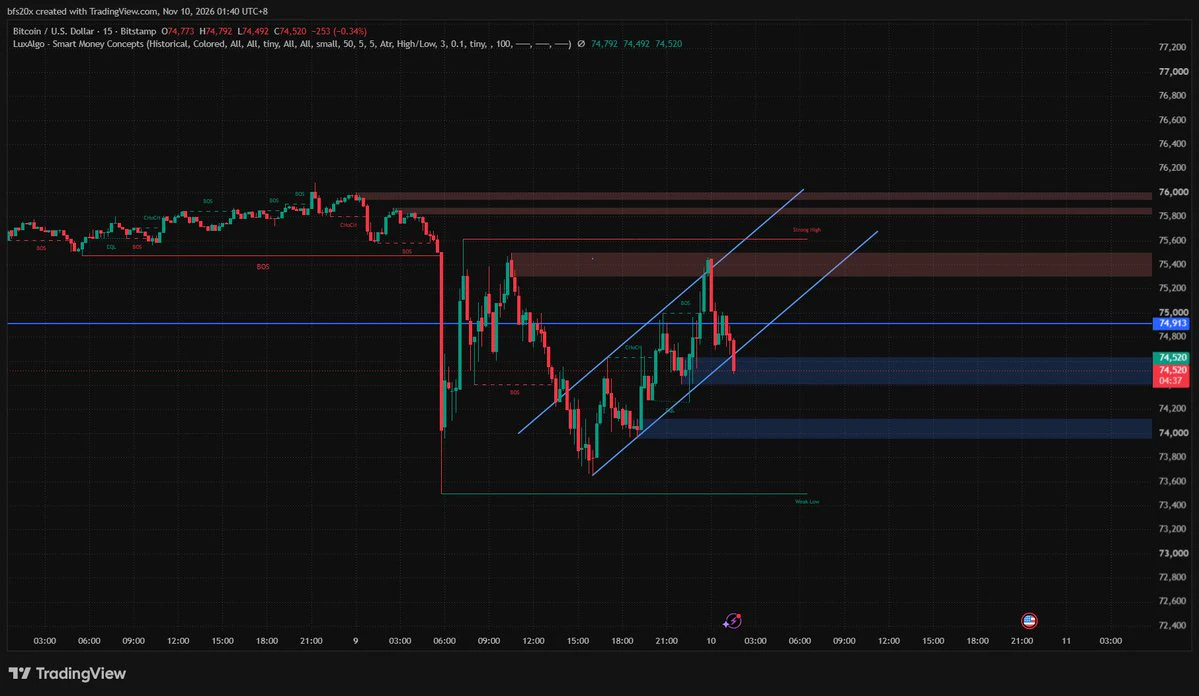
A night without volatility
live-cover
LIVE36
bitcoin:native This drop has me feeling a little uncertain. I’m scared I’ll wake up one day, check the price, and see 58,000.

It seems like developing sleep problems because of crypto has become the norm for most people in the industry.
post-image
BTC-0.67%
A friend who had held NVIDIA $NVDA for three years saw Huang send an all-hands letter admitting to an affair and was so frightened he placed sell orders overnight, ready to liquidate his entire position.
With a position worth millions, he ignored NVIDIA’s monopoly over global computing power and instead fell for a sex scandal script cooked up by Washington politicians.
At two in the morning, he was still frantically sending me voice messages: “It’s over, it’s over. Huang’s reputation is ruined—he got involved with a female spy and is under congressional investigation. The stock has already lo
NVDA-5.60%
Looking at this move for ethereum:0x232ce3bd40fcd6f80f3d55a522d03f25df784ee2
Has been pretty resilient during this downtrend. Pointing out the bullish narrative around the CFTC license for the next DEX in the USA going to the Lighter team.
Buy the rumor, sell the news.
post-image
ETH-1.26%
LIT-4.56%
#70%OfAltcoinsFallBelow200DMA
70% Of Altcoins Fall Below 200DMA: Is the Crypto Market Entering a Deeper Correction?
The cryptocurrency market is facing a challenging phase as approximately 70% of altcoins are reportedly trading below their 200-day moving average (200DMA). This development has attracted significant attention from traders, long-term investors, and market analysts because the 200DMA is one of the most widely followed indicators for evaluating the overall market trend.
When a large percentage of altcoins fall below this important technical level, it suggests that market weakness
BTC-0.67%
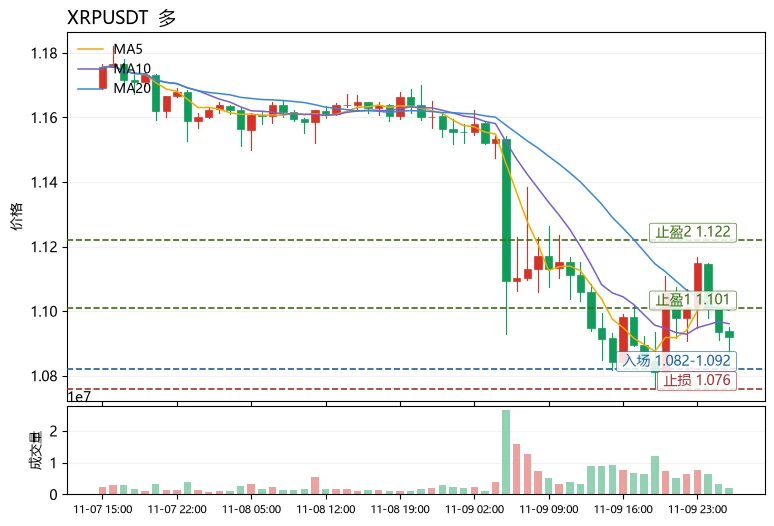
Many people use “it has fallen so much, it must rebound” as a reason to enter. This is a classic bottom-fishing fallacy—cheap prices do not mean the trend is strengthening; first check whether the moving-average structure is still healthy. Take $XRP as an example: the current price is 1.0919, and MA5 is only slightly above MA20 (1.10044 vs. 1.10028). The two lines are almost converging, indicating the medium-term trend is flattening rather than clearly rising; RSI at 39.9 is weak but not oversold, while the MACD histogram at +0.002212 remains bullish, suggesting an early momentum recovery aft
post-image
TQQQB
TQQQBTQQQB
Four.meme
MC:$3.36KHolders:2
0%
XRP-1.15%
Franklin Templeton Uses OpenAI to Compare Stock Research

Fund managers often have several research reports on the same stock piled on their desks: their views are not entirely consistent, and they describe risks differently. Franklin Templeton is using OpenAI to have an AI workflow assist with this comparison.
【Starting with Equity Research】
OpenAI announced that Franklin Templeton has used its technology to support investment research. The initial use case is equity research: helping portfolio managers compare different research views and examine investment risks. Public information currentl
post-image
There's not much to say; all I can say is that the followers who got in are making money again. Actually, the biggest problem with my articles is that you saw them at the time but didn't dare to follow because your understanding wasn't there
UchihaUltraShort
As for this SanDisk dip-buying situation, here’s an update: just as I said before, those who bought the dip at 1,000 are already trapped. When SanDisk was at 1,300, I told everyone not to buy the dip at 1,000—you could only start entering around 850. Let me explain the current situation. This entire downturn is due to overwhelming strength from the bears, with an extremely strong consensus on the short side. Wall Street funds may be aggressively shorting it, and institutions are all selling. Only a small number of retail investors are buying the dip. In this rally, from 794 to 880, retail investors played very little part. First, their capital isn’t coordinated around a shared conviction, and their orders are scattered. It was entirely partial profit-taking on short positions that pushed the price up. Don’t think you were the ones who drove it up by buying the dip—don’t overestimate yourselves. The key right now isn’t when the price will rally. You’re all waiting for this revenge rebound.

U.S. stocks are liquid assets, and after becoming oversold, a lot of people will come in to buy. That’s true. But for an asset this liquid, a bottom is only confirmed when it either rebounds quickly or nobody buys or sells anymore and it moves sideways. That’s when you can go in and buy. You should focus on price action, not just the price itself. In other words, the real bottom-buying zone is where everyone wants to buy and scramble for shares, and short sellers’ profit-taking overlap. After all, closing short positions is equivalent to buying, and when so many shorts are taking profits, that creates powerful market buys. If you buy the dip then, you can really make a lot of money. Otherwise, either build your position in batches with leverage of 5x or less, or do what I do and try to catch the turning point.

I’ve already told you what turning points look like and what it feels like when it’s time to buy the dip. My prediction for next week is that it’ll first stabilize and move sideways around 720–750, then rebound.

  • 6
Monday may be the start of a large-scale stock market sell-off.
What’s truly unsettling is—we’ve seen this script before.
1999: The dot-com bubble burst, and the Nasdaq plunged 78%. 2007: The housing bubble burst, and the S&P 500 tumbled 57%. 2026: The AI bubble—what comes next?
The bubbles take different forms, but the narrative is remarkably consistent.
Everyone believes the rally will last forever. Everyone adds to their positions on dips. No one thinks the market will really crash.
Until selling pressure hits. Those who rushed in to buy every dip suddenly scramble for the exits.
That’s how
post-image
NVDAB
NVDABNVDAB
Pump.Fun
MC:$3.5KHolders:1
4.36%
NAS100-0.07%
SPYX+0.01%
XAU+0.38%
$RUNE Short setup update:

On the 4-hour chart, price is capped below the EMA50, and the current structure is weak. The 0.5931–0.5947 area is the shorting zone I’m watching, but I won’t chase price blindly. I’ll wait for it to return to this range before considering an entry.
🔴 Short entry zone: 0.5931–0.5947Target levels: 0.5881 / 0.5843 / 0.5785Stop level: 0.6035
Rationale: 0.594 is below the 4-hour EMA50 (0.599), and the moving averages point downward. The 1-hour RSI is 61, so momentum is not extreme, meaning there may still be room to move lower. The funding rate is -0.006%, indicating su
post-image
RUNE-0.14%
$XAG – Bearish Bias (Correction) The price has the potential to move lower or sideways in the short term. - The previous sharp rally is beginning to lose momentum. - The price is facing resistance in the 53.00–53.15 area. - Should selling pressure intensify, the price may test the 52.51 level. - A breakout above 53.15 would reopen the possibility for a bullish move. Conclusion: Mildly bearish, with the potential for a correction as long as the price remains below 53.15.

Note: Crypto and stock transactions carry the risk of loss. Please conduct your own research (DYOR) before trading. This in
post-image
XAG+0.47%
  • 3
I am NOT a chinese spy :)
post-image
Still adding $RYFT at these levels price seems to be stabilised
Team is rolling out 3D Agentic Game Creation now. Beta testers get it first this week after they tested it for a month and a half.
Founder made it clear they stabilized first then put the bigger product in people’s hands while the chart finds its footing.
That’s the order I want from a team I’m holding longer term.
Sitting around $11.5M MC after pulling back from the ATH. Good time to DCA or start a position imo if you’re still in on the AI game narrative like myself. My biggest holding on RH chain currently, if it pulls a $NEUR
post-image
Load More

Join 40 M users in our growing community

⚡️ Join 40 M users in the crypto craze discussion

💬 Engage with your favorite top creators

👍 See what interests you

Trending Topics

USCPIDataIncoming

43.08k Views2.03k Discussing

The U.S. October CPI report will be released on November 10 at 8:30 a.m. ET. September CPI came in at 3.7% year over year, and markets will be watching closely for signs that inflation is cooling, especially in core CPI. A softer-than-expected reading could strengthen rate-cut expectations, while hotter inflation may pressure risk assets through higher Treasury yields and a stronger dollar. How do you think this CPI print will move $BTC, U.S. stocks and gold?

RedBullDoublePodiumInBrazil

9.24k Views30.59k Discussing

BTCFlashCrash

201.03k Views66.58k Discussing

View More