


Square
Following
Hot
News
Notifications
Profile
Share your thoughts
placeholder
Article
Jindun also went from 700 to 1000u on 11/10 and is currently slightly profitable. Copy traders should keep their positions at 200u or more; even small positions are earning nicely.
post-image
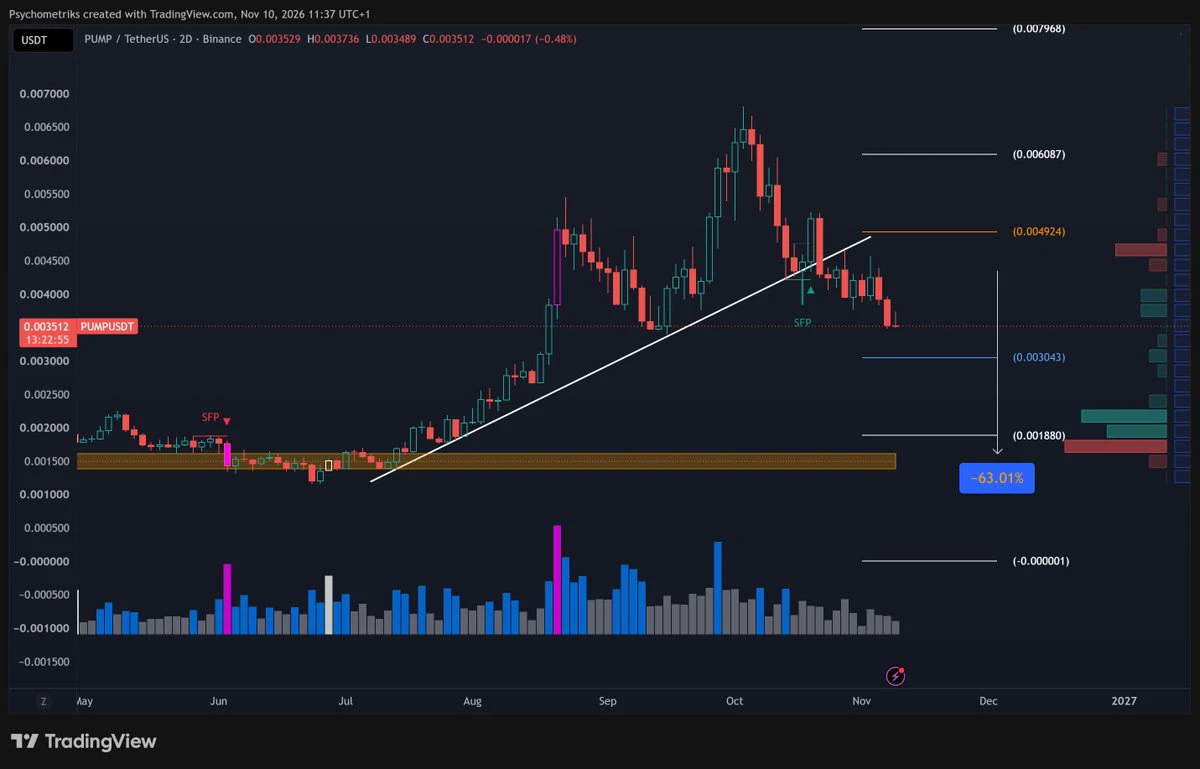
solana:pumpCmXqMfrsAkQ5r49WcJnRayYRqmXz6ae8H7H9Dfn ready for laving in price
#pump
post-image
SOL-0.77%
PUMP-1.06%
Trenches
PIEVERSE
P
bade
b
PIEVERSE
0x0e...25a9
Market Cap
$.
Change
.
24h Vol
$.
Holders
.
牛逼
牛
bade
b
牛逼
0x96...7777
Market Cap
$.
Change
.
24h Vol
$.
Holders
.
STONK
S
bade
b
STONK
6GmA...UNgx
Market Cap
$.
Change
.
24h Vol
$.
Holders
.
ON
O
bade
b
ON
0x0e...1d48
Market Cap
$.
Change
.
24h Vol
$.
Holders
.
FLOAT
F
bade
b
FLOAT
Bv1a...BMmr
Market Cap
$.
Change
.
24h Vol
$.
Holders
.
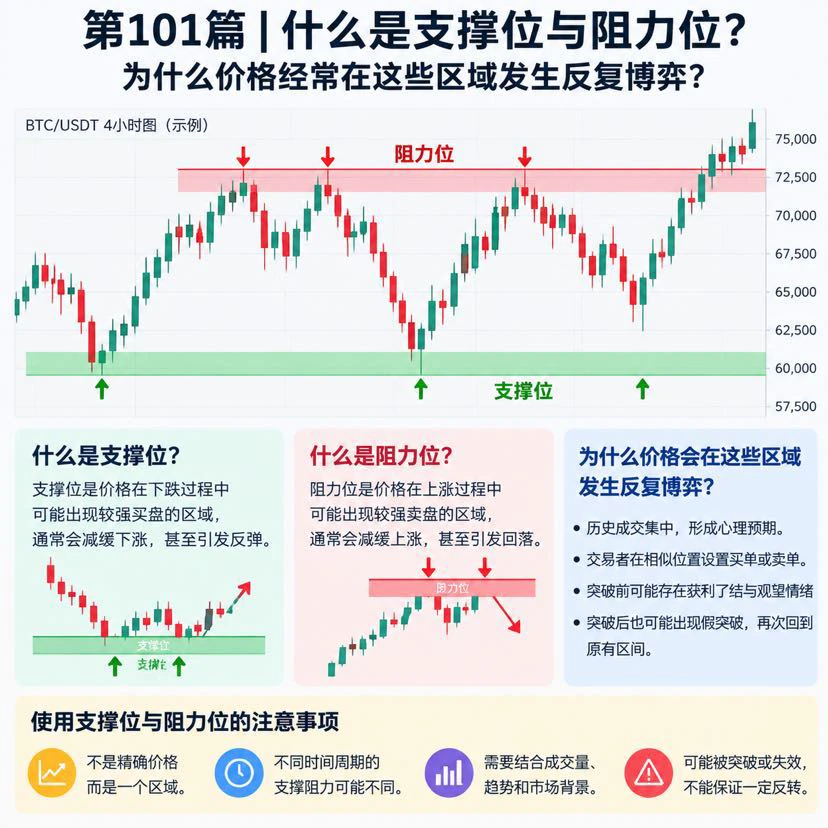
What Are Support and Resistance Levels? Why Does Price Often See Repeated Battles in These Areas?

In cryptocurrency trading, BTC may sometimes rebound after falling to a certain area, or pull back after rising to another. These recurring price reaction points are often related to support and resistance levels. However, they are not precise boundaries that guarantee a price reversal, but important tools for helping traders analyze market structure.

First, what is a support level?

A support level is a price area where stronger buying may emerge as prices fall, slowing the decline. If the pric
post-image
BTC-0.67%
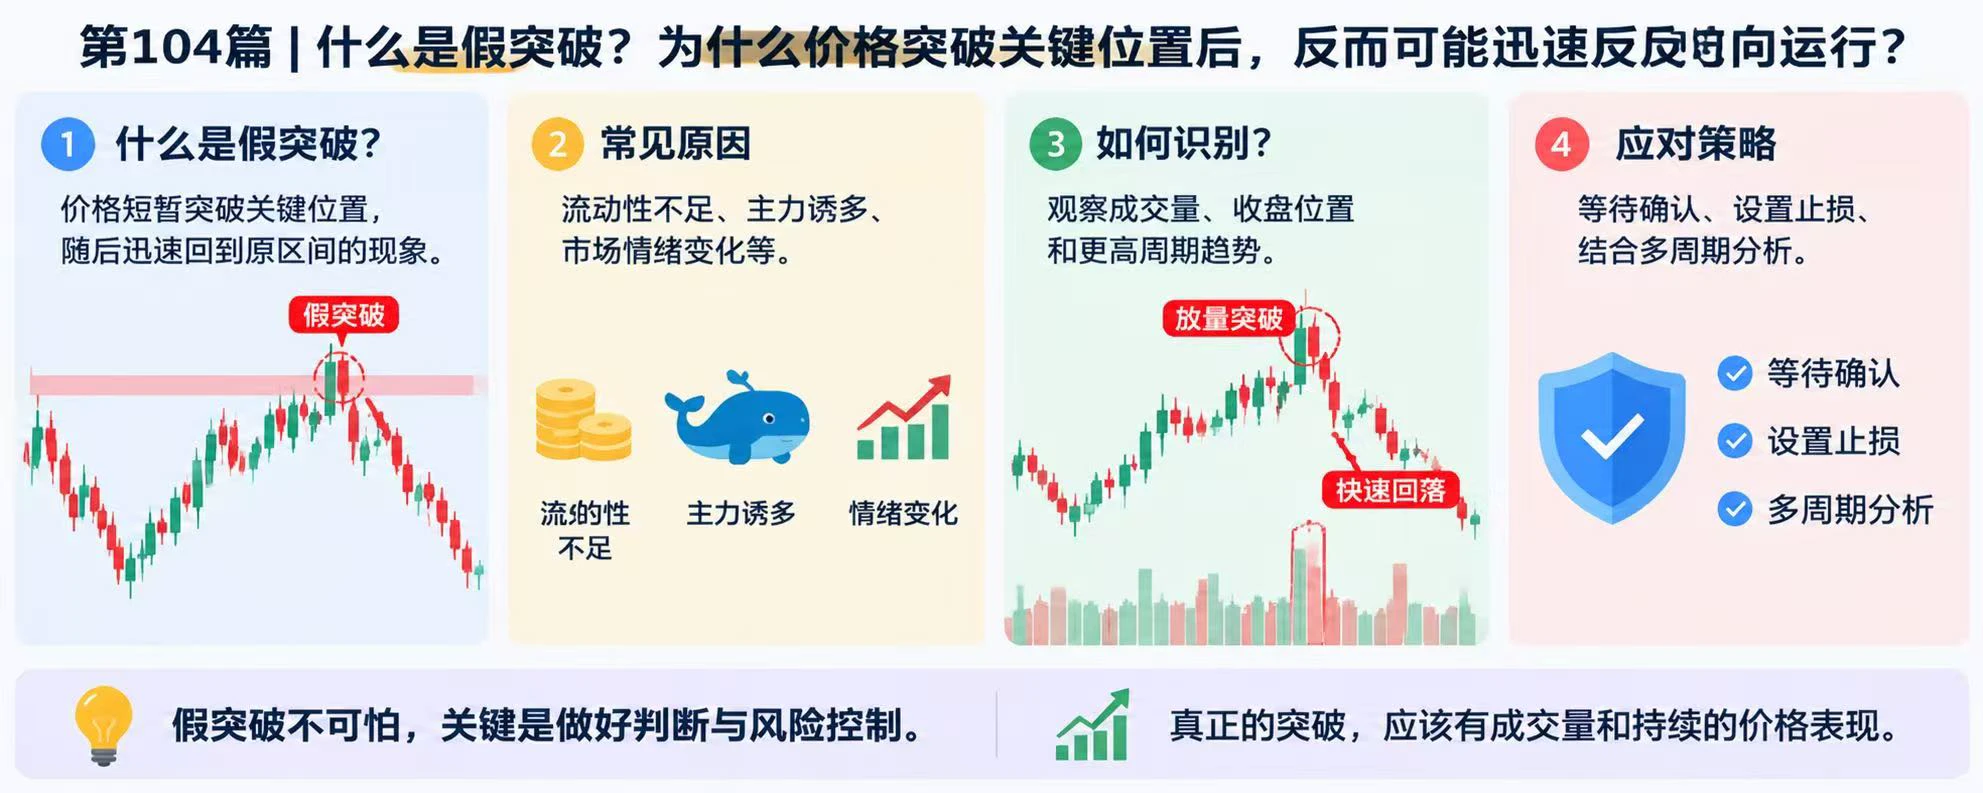
What Is a Retest Confirmation? Why Can a Retest After a Breakout Sometimes Be an Opportunity and Sometimes a Reversal Signal?

In cryptocurrency trading, after the price breaks through a key resistance level, it may pull back to around the former resistance, find support again, and continue rising. But it may also fall quickly after the breakout and return to its previous trading range. That is why retest confirmation is an important aspect of breakout trading worth examining.

First, what is a retest confirmation?

After the price breaks through a resistance level, it returns to test the area
post-image
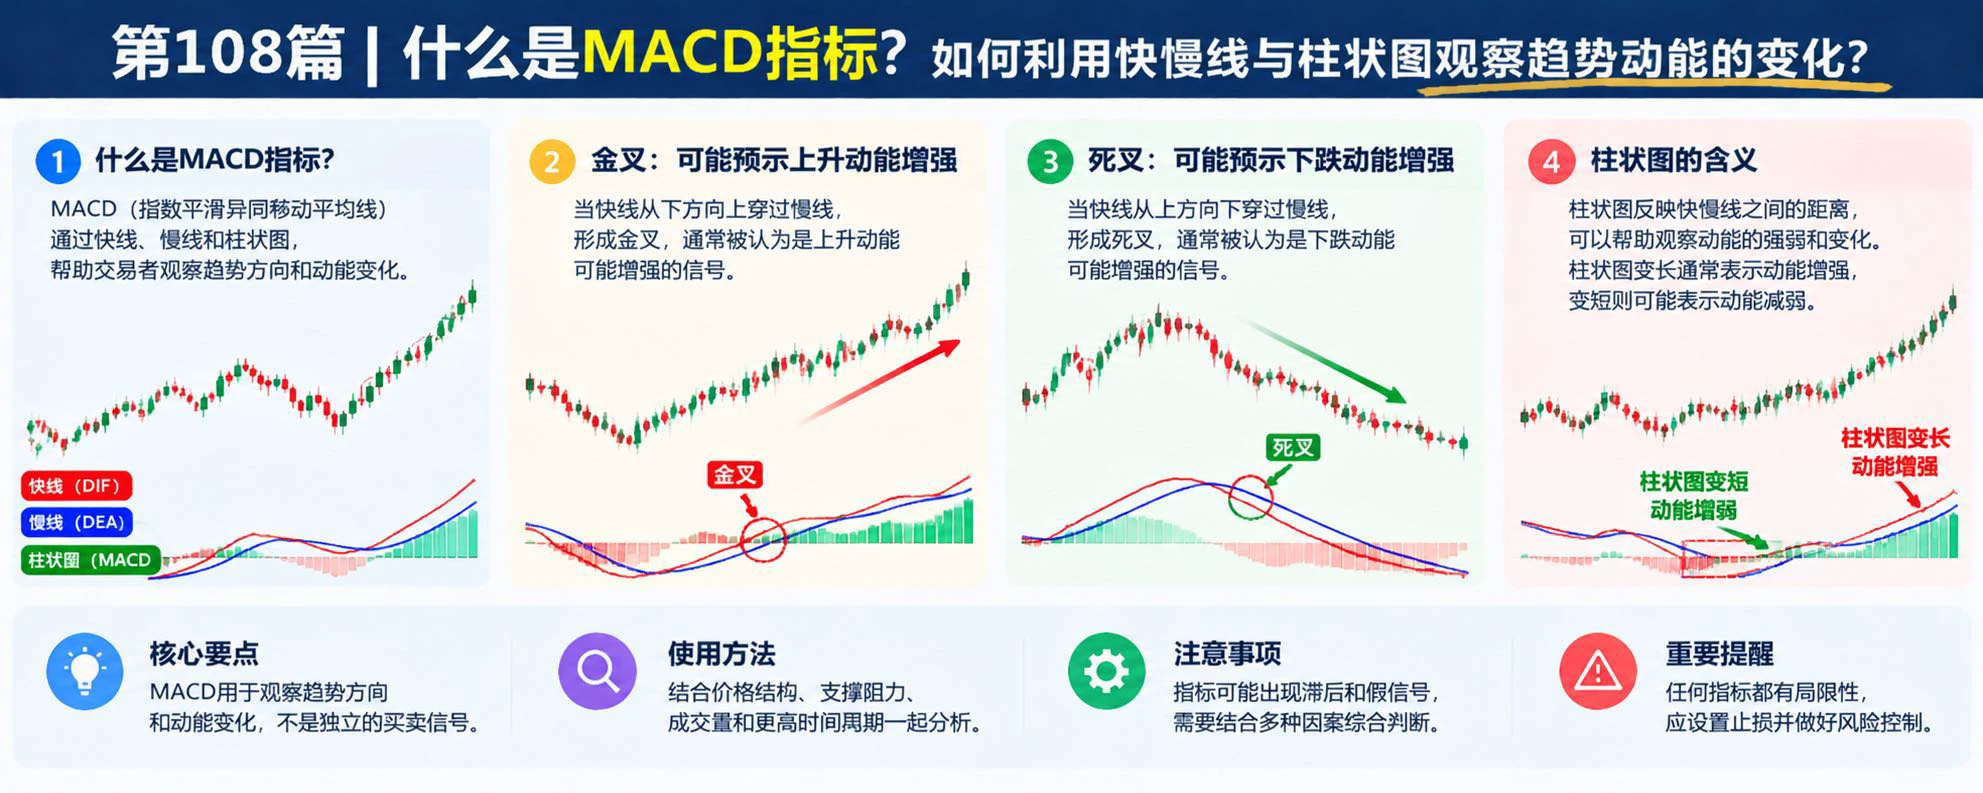
What Is the MACD Indicator? How Can You Use the Fast and Slow Lines and Histogram to Observe Changes in Trend Momentum?

In cryptocurrency trading, a short-term price increase does not necessarily mean the trend has reversed, and a short-term decline does not necessarily mean the current market move is about to end. MACD is a common technical analysis indicator that can help traders observe trend direction and changes in momentum, but it cannot guarantee correct buy or sell decisions on its own.

First, what is MACD?

MACD consists of the fast line DIF, the slow line DEA, and a histogram. DIF
post-image
This is the only way to keep seeing money-making news instead of gossip.
post-image
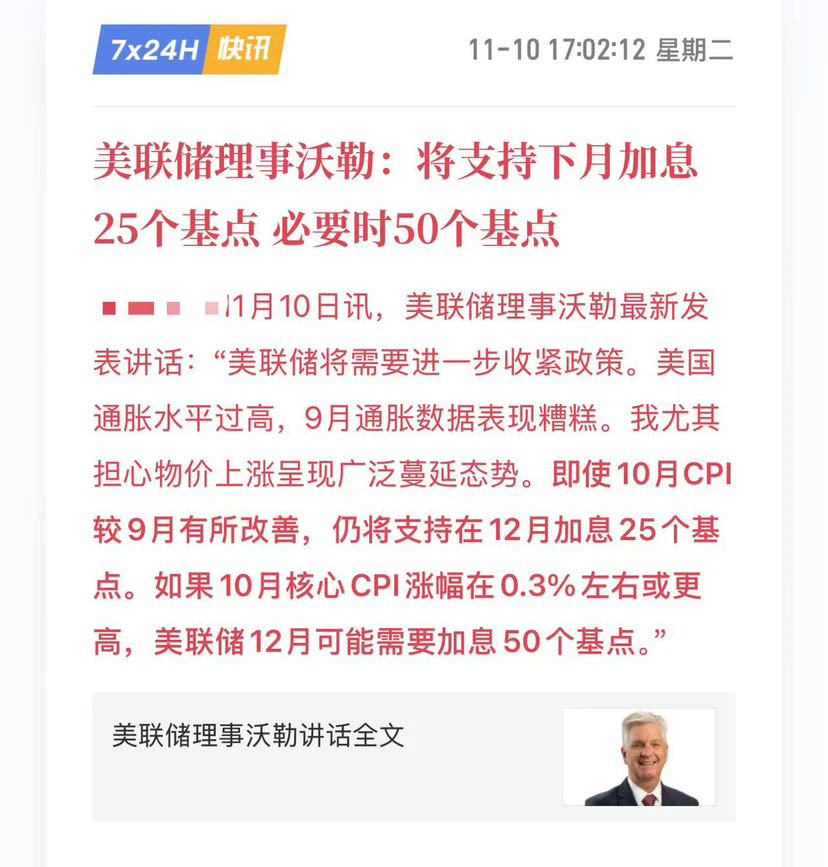
Maintains view of a 99% chance of a rate hike in December! #美国10月CPI即将公布
post-image
XiuHu_charts
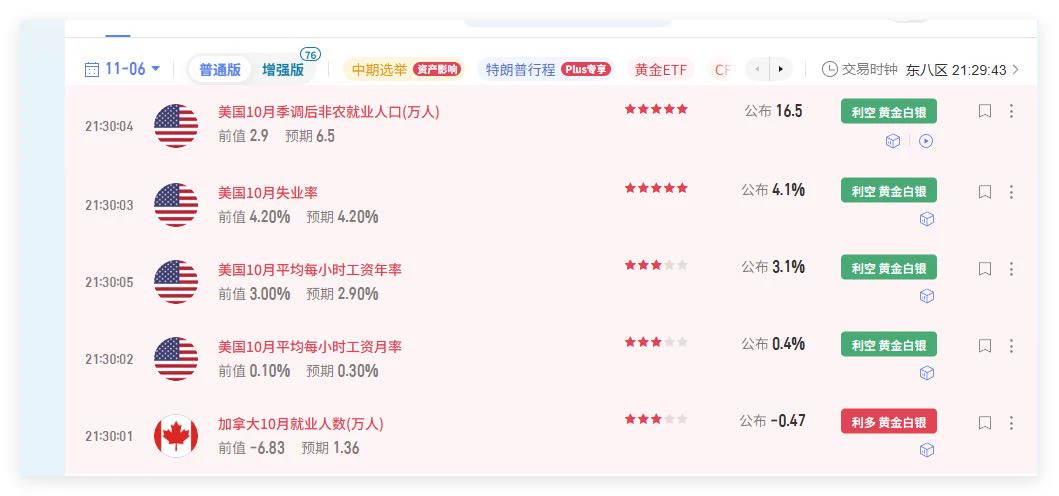
Based on today's nonfarm payrolls and unemployment rate, a rate hike in December is almost 99% certain!

Never mind that nonfarm payrolls far exceeded expectations; the drop in the unemployment rate looks bad on its own. Only a meaningful rise in unemployment can open the door to rate cuts.

Good luck to those trying to catch the bottom. I’m maintaining my bearish outlook. #10月非农数据聚焦
repost-content-media
Without exaggeration.
This monkey has been involved with at least a hundred women.
post-image
Will inflation continue to cool, or will it disrupt rate-cut expectations again?🔹
live-cover
LIVE2,119
No Monday-morning quarterbacking
Understand monetization
Don't chase quick profits
Meet the right people, do the right things!!!
post-image
  • 2
$AIN Another wave of longs, and it dumps after such a tiny pump. Is this damn market maker broke or what?🤣
post-image
AIN+3.85%
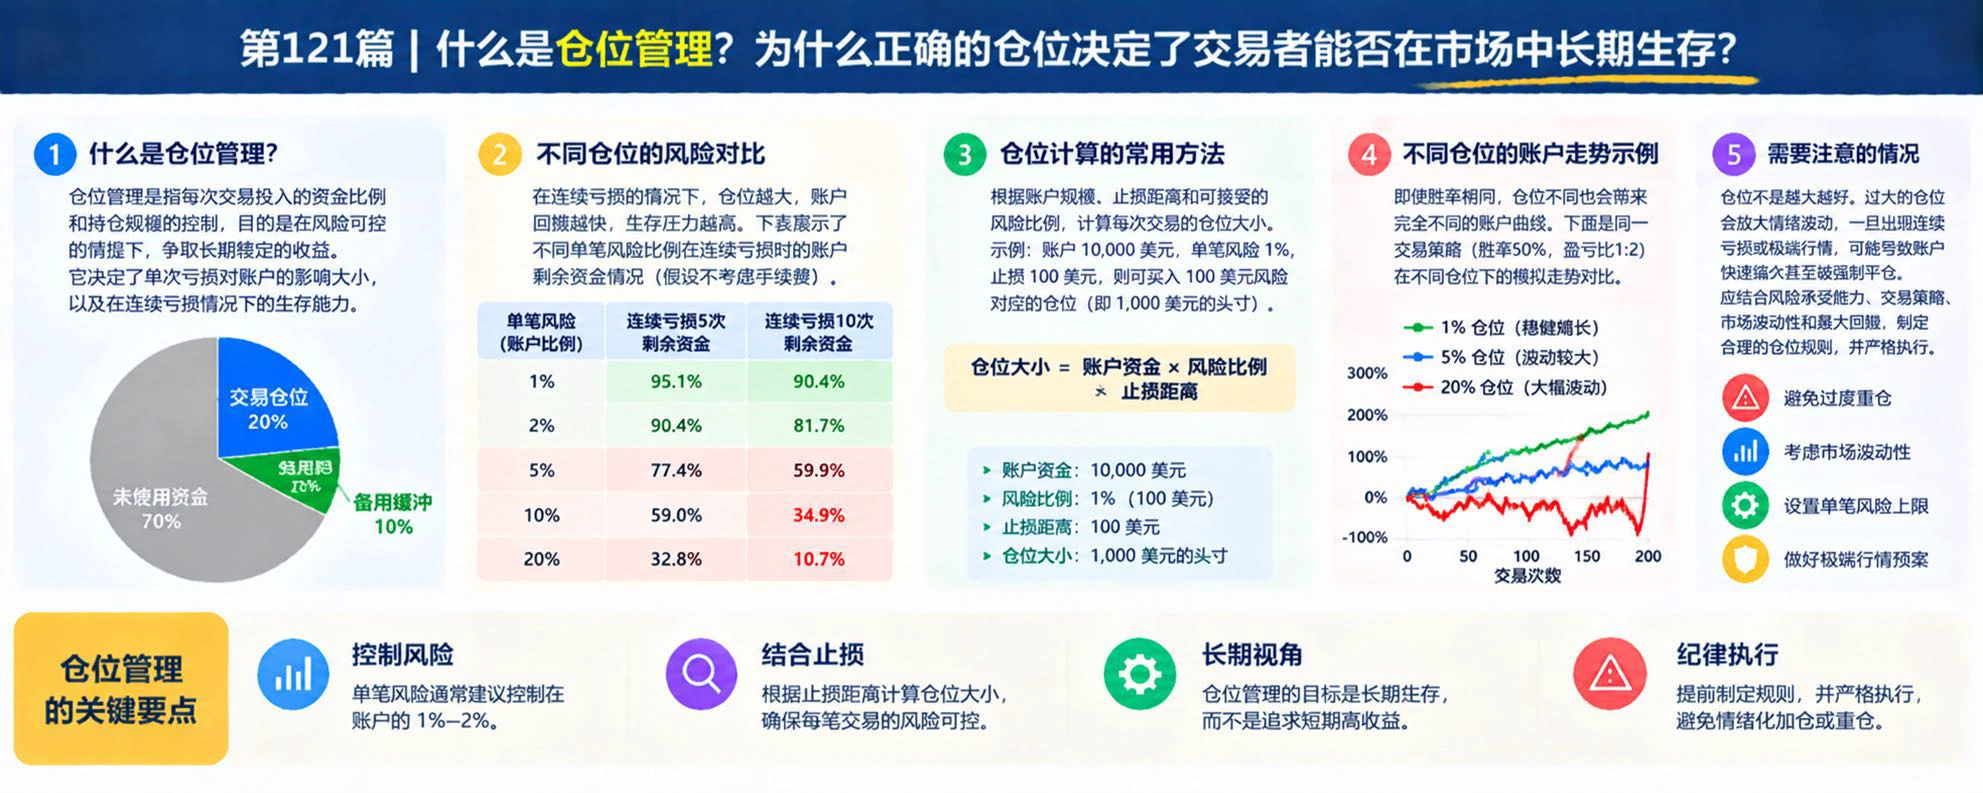
What Is Position Sizing? Why Does Proper Position Sizing Determine Whether Traders Can Survive in the Market Long Term?

In cryptocurrency trading, even if you correctly predict the direction, an oversized position can still result in severe losses due to short-term volatility. Position sizing is not simply about deciding how much to buy; it means determining how much risk each trade should carry based on your account balance, stop-loss distance, and the amount of loss you can afford.

First, what is position sizing?

Position sizing is a way to control the size of each trade, risk exposure, a
post-image
$Hana the real pump will be multiple xs like $Jct
HANA-3.22%
JCT-3.26%
market update
live-cover
LIVE5,774
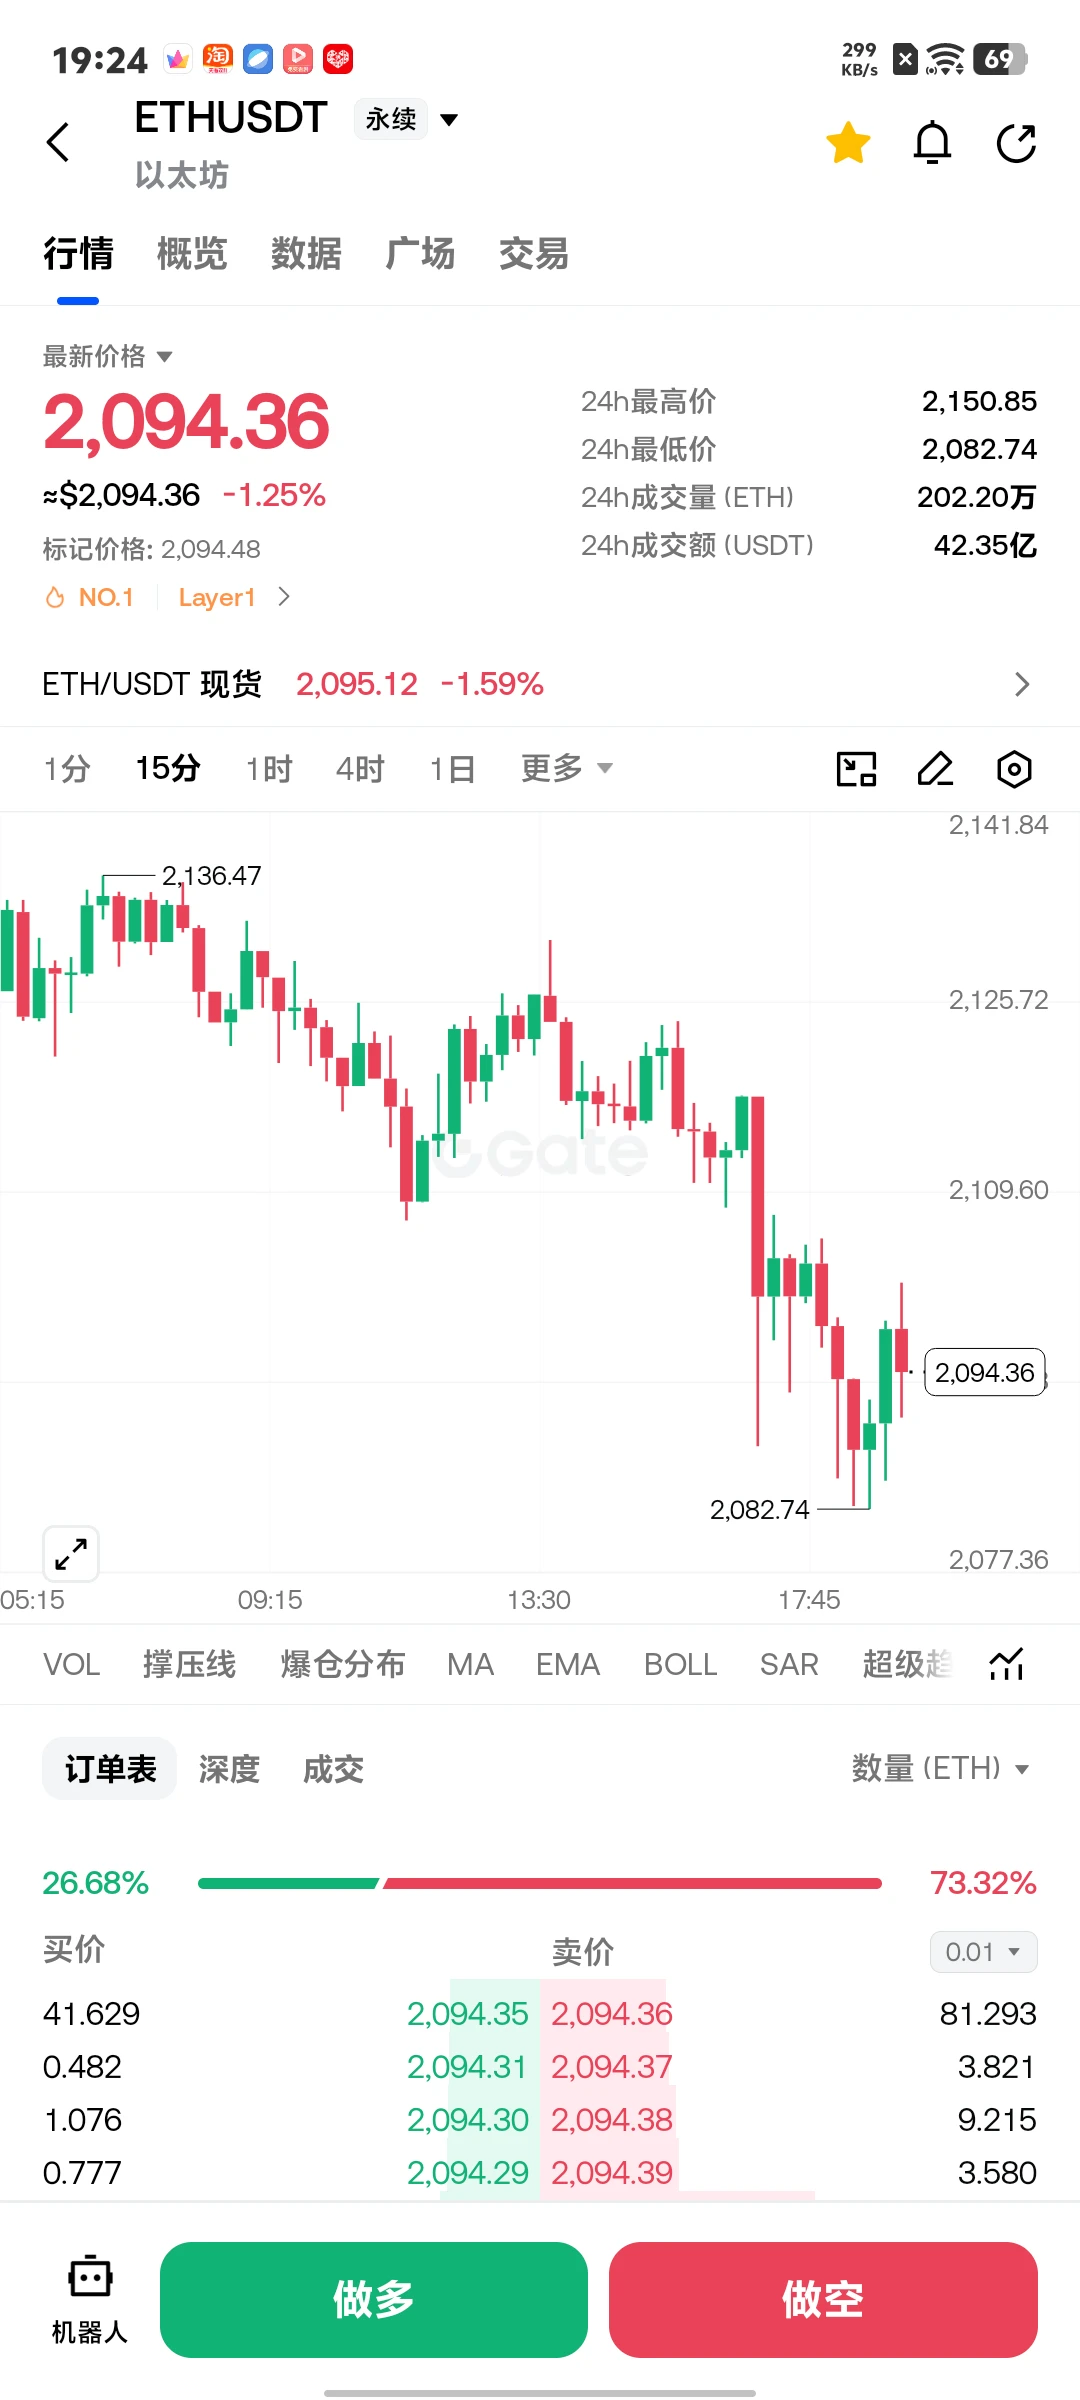
Can this piece-of-shit ETH still go up to 2150?$ETH ‌
post-image
ETH-1.23%
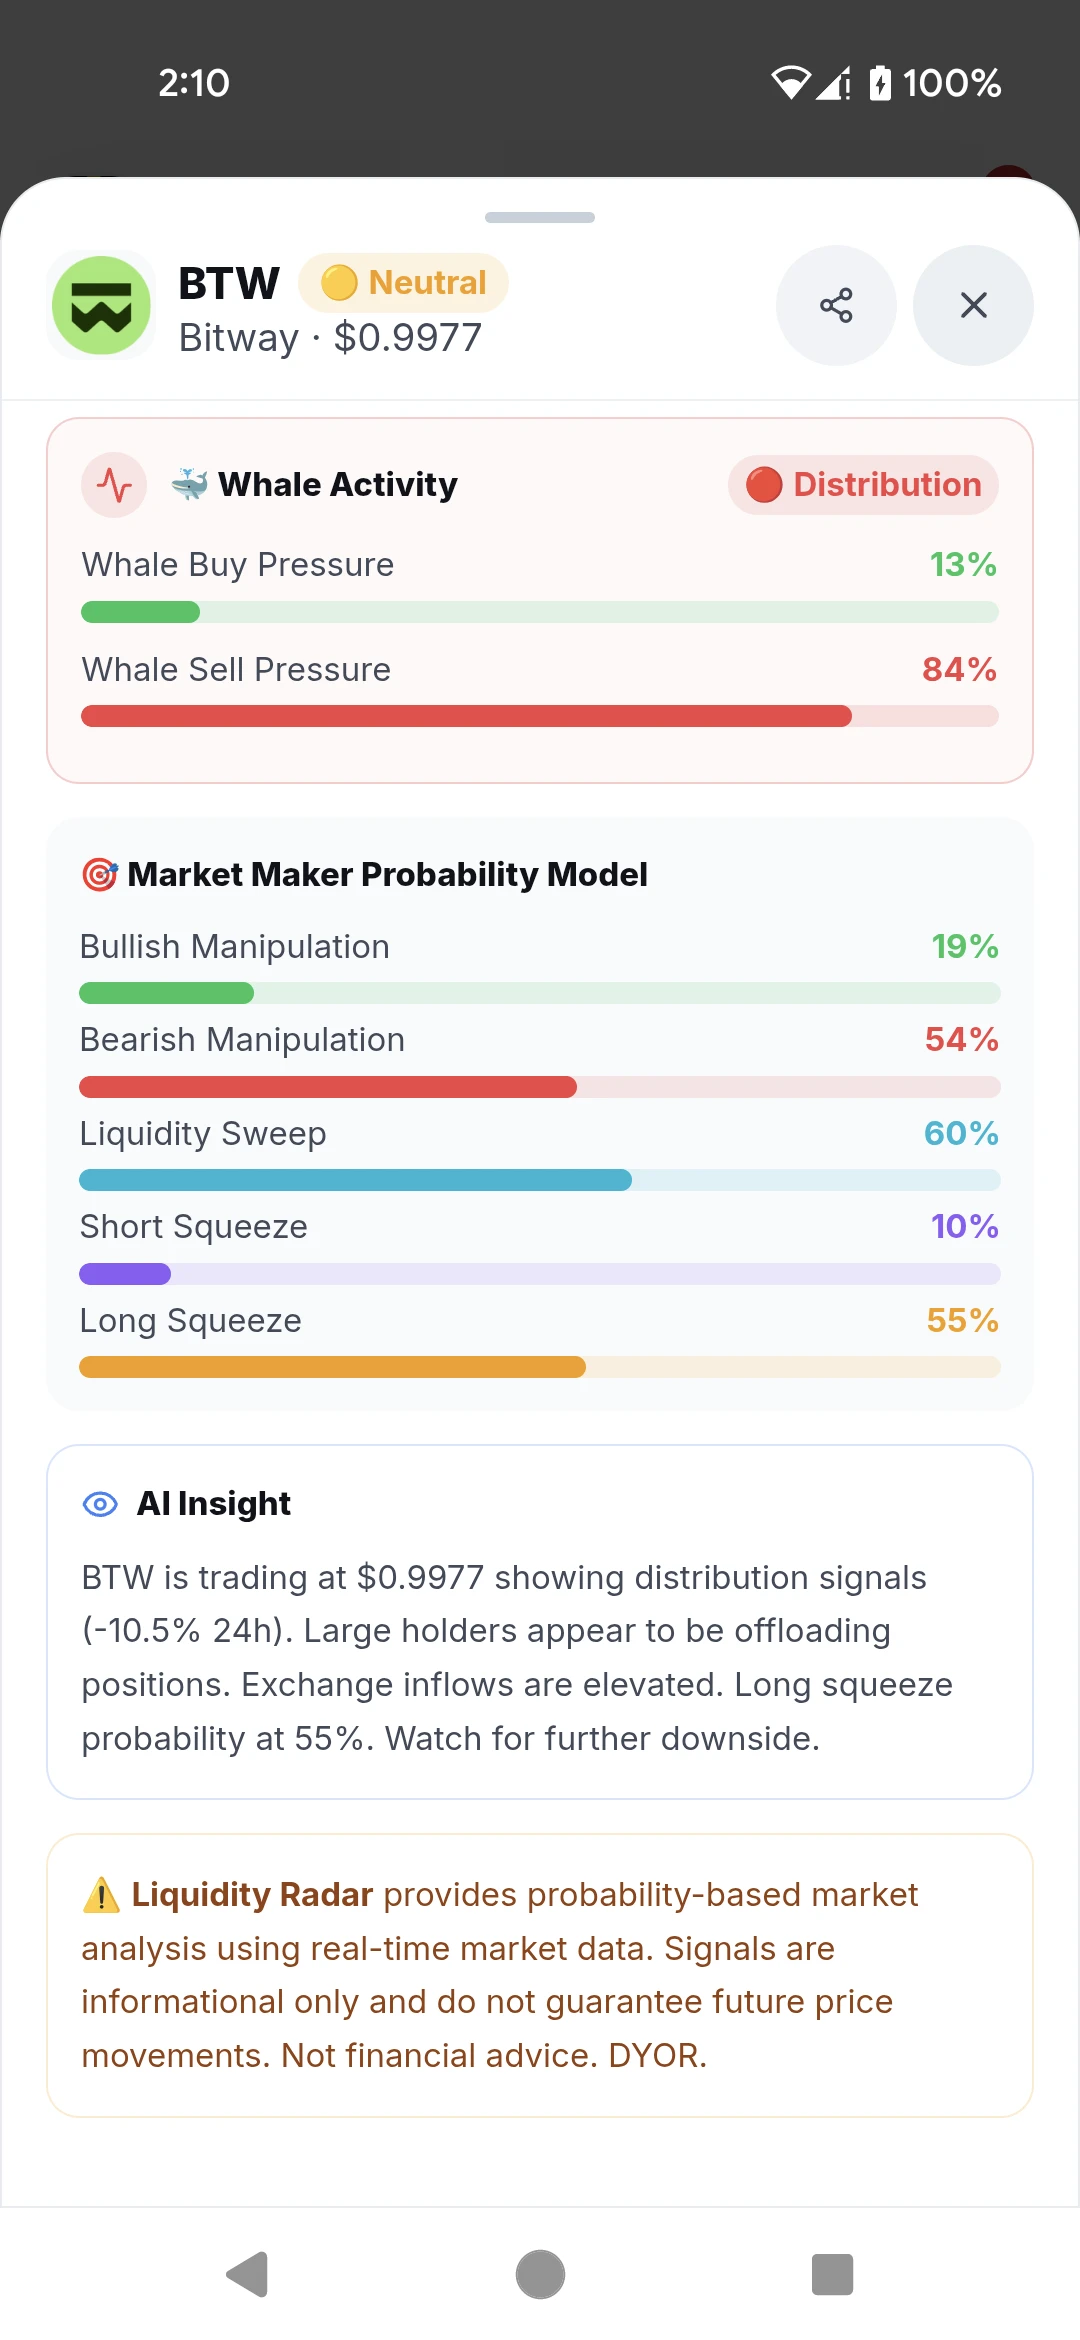
$BTW ‌ WARNING: HEAVY WHALE DUMPING DETECTED AMIDST A NEUTRAL STRUCTURE! 📉

Do not let the "Neutral" market structure tag fool you into thinking this is a safe zone. Bitway (BTW) is currently sitting at $0.9977, down a heavy -10.47%, and the underlying data is screaming danger. The big players are aggressively exiting their positions.

Here is the exact breakdown of the current market conditions:

📊 Market Overview:

· Market Cap: $1.50B
· Volume Change: 0% of Mkt Cap
· Open Interest (OI) Change: -6.4%
· Funding Rate: -1.0000% (Long/Short ratio is a heavily skewed 0.49x)
· Volatility Score:
post-image
BTW-7.75%
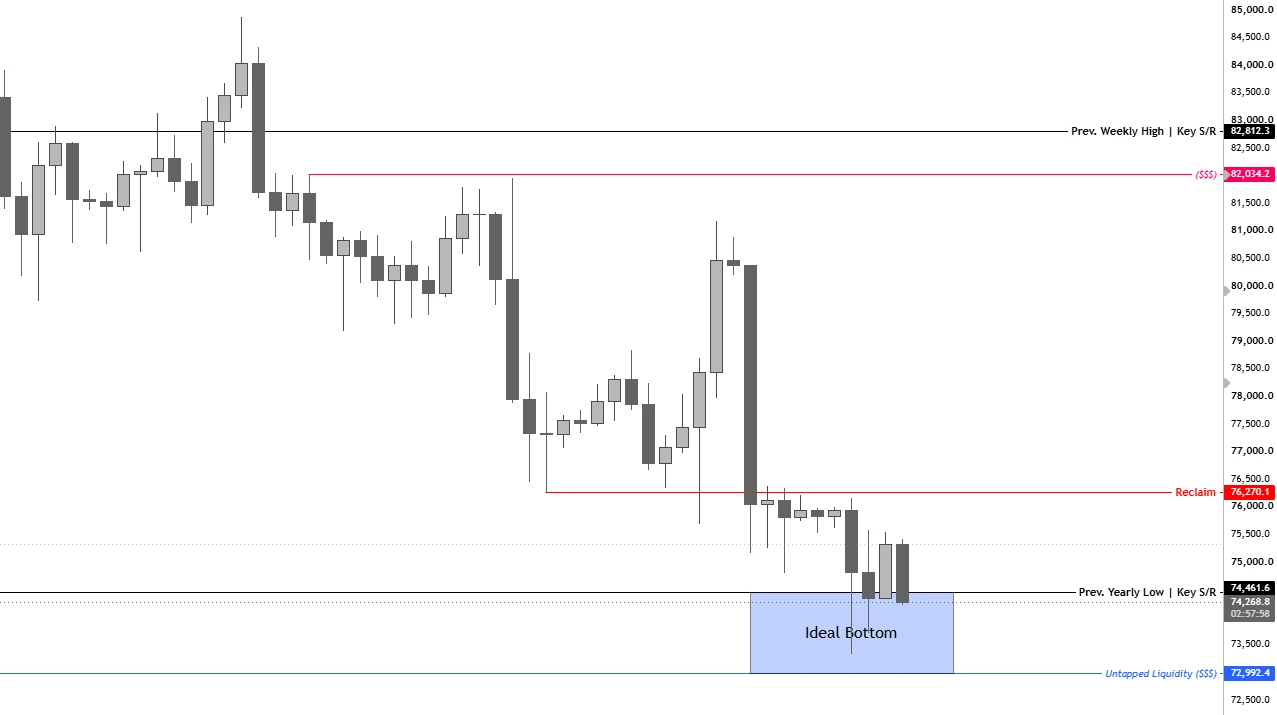
$BTC We have tapped the Ideal Bottom Zone

Now, We need to hold 74.3k region inside this daily session.

If we do, We will likely push into the 76.2k LTF highs which need to be reclaimed for continuation higher.

The bottom is close...
post-image
BTC-0.67%
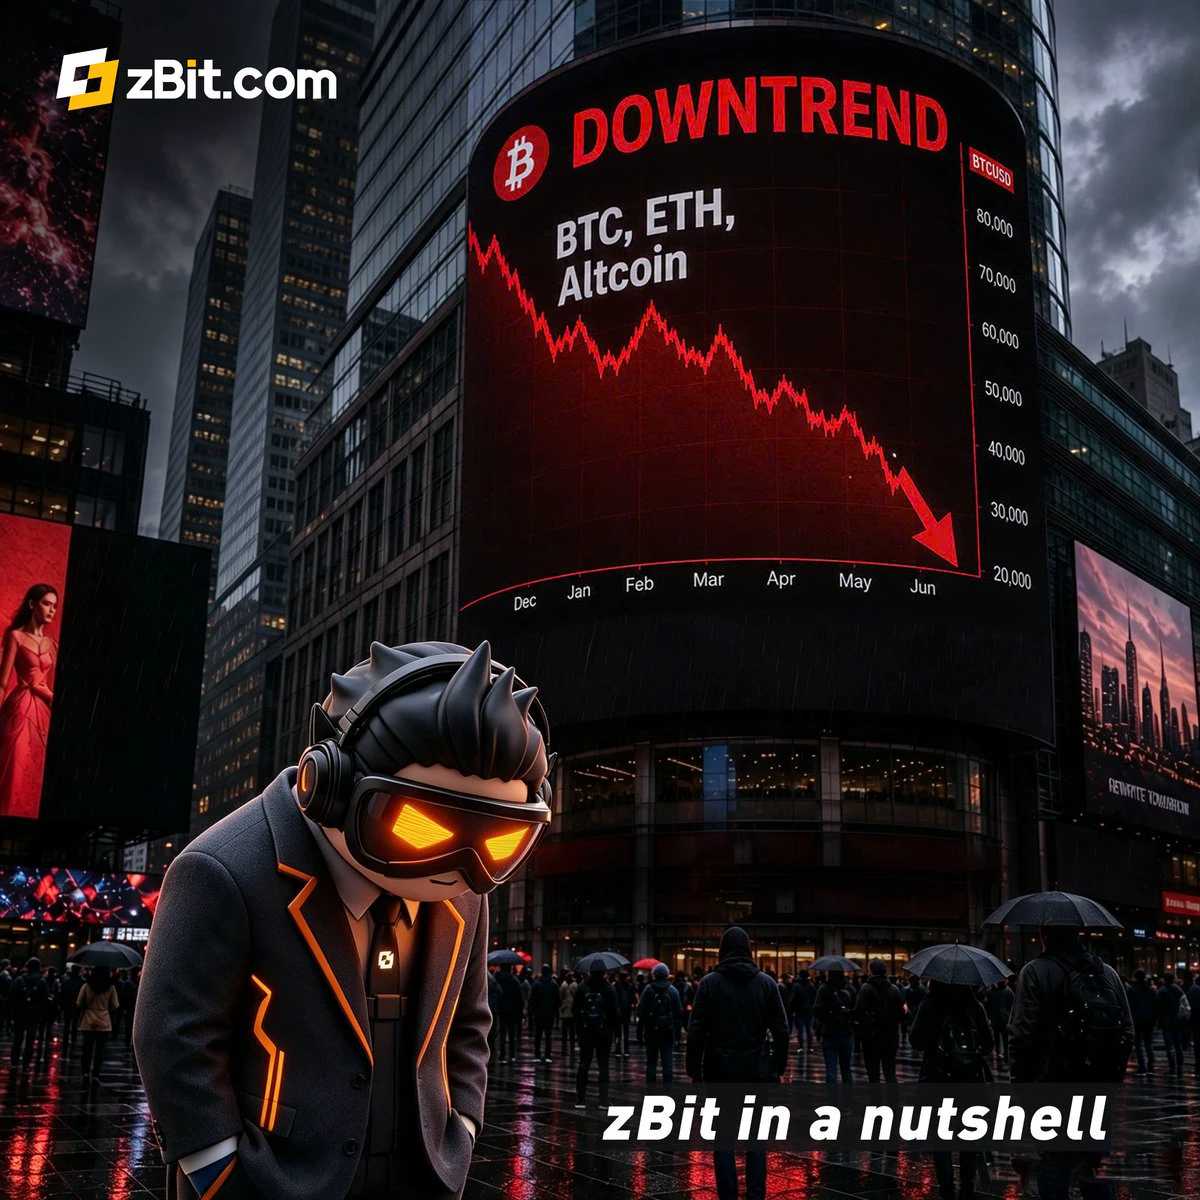
⭐️ zBit Daily Brief: 4 Headlines You Shouldn't Miss ⭐️
🟢 Nvidia CEO Under FBI Scrutiny: President Trump said the FBI is “looking into” Nvidia CEO Jensen Huang following reports of an alleged affair with a woman suspected by US authorities of being a Chinese intelligence agent, according to the Financial Times. Nvidia is also facing a shareholder lawsuit after its stock fell more than 4% amid the controversy.
🟢 Peter Schiff Sees More Downside for Bitcoin: Bitcoin's drop below $75,000 has reignited Peter Schiff's bearish outlook, with the economist warning of a potential BTC crash even as stoc
post-image
NVDA-4.34%
BTC-0.67%
ETH-1.26%
HYPE+0.24%
XAU+0.38%
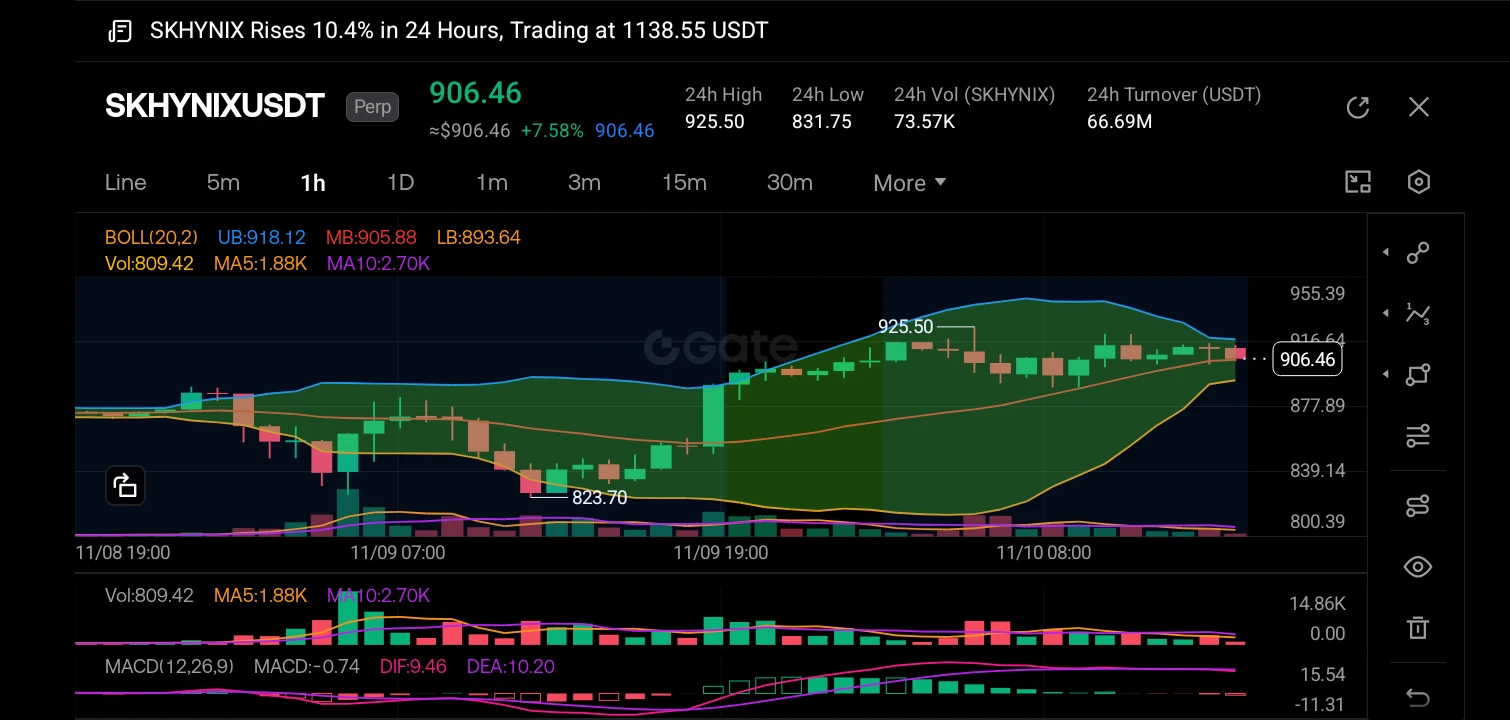
$SKHYNIXG ‌
The market structure has decisively shifted bullish, transitioning from a downtrend into a strong impulsive leg up, as evidenced by the price breaking above the middle Bollinger Band and establishing a higher high at 925.50.

The K-line analysis shows a consolidation phase following the initial surge, with the price currently retracing to test dynamic support near the 906 level; the Bollinger Bands are expanding, indicating increased volatility, while the price holds above the critical MA5 and MA10 lines, suggesting the short-term trend remains intact despite the current pullback
post-image
SKHYNIXG+1.47%
Load More

Join 40 M users in our growing community

⚡️ Join 40 M users in the crypto craze discussion

💬 Engage with your favorite top creators

👍 See what interests you

Trending Topics

GateGlobalComplianceExpansion

646 Views201 Discussing

Gate continues to expand its global compliance footprint, now covering 81 regulated jurisdictions across Europe, North America, Asia, and Oceania. From MiCA and U.S. state-level MTLs to Japan’s FSA, Dubai, and Australia-related regulatory approvals, global exchanges are entering a new stage of compliance competition. Do you think regulatory strength will become as important as products and liquidity for exchanges in the future?

USCPIDataIncoming

56.23k Views2.3k Discussing

USIranTalksShowNewProgress

10.54k Views1.29k Discussing

View More