Square
Following
Hot
News
Notifications
Profile
Share your thoughts
placeholder
Article
$IRON may come tomorrow
IRON-0.01%
$BCH Fell to the weakest in the sector—is this a risk or an opportunity? The answer leans bullish—this is relative weakness amid panic-driven indiscriminate selling, not a fundamental collapse.

Comparing across the sector: NEAR is currently at 3.688, down just 2.12% over 24h; MA5 has crossed above MA20, RSI is neutral at 47.6, and the MACD histogram has turned positive, with a much smaller decline than BCH. MITO is even up 21.26% against the trend, with a relatively strong RSI of 60.6. Of the three, BCH is relatively the weakest: down 6.24% over 24h, with its price of 248 below MA5 at 248.62
BCH+0.95%
MITO+8.51%
Trenches
ZIG
Z
bade
b
ZIG
0x8c...1145
Market Cap
$.
Change
.
24h Vol
$.
Holders
.
STONK
S
bade
b
STONK
6GmA...UNgx
Market Cap
$
Change
.
24h Vol
$.
Holders
.
IDOL
I
bade
b
IDOL
0x3b...ab07
Market Cap
$.
Change
.
24h Vol
$.
Holders
.
BTC
B
bade
b
BTC
C5xp...pump
Market Cap
$.
Change
.
24h Vol
$.
Holders
.
FLOAT
F
bade
b
FLOAT
Bv1a...BMmr
Market Cap
$.
Change
.
24h Vol
$.
Holders
.
Yesterday I asked Grok Bot to keep an eye on DMIT restocks, and it used up 30% of my $100 plan’s weekly quota in one day. I’m furious 😭
post-image
$LYN Go long!! The market just showed unusual activity. The pullback is over, and the price is starting to rise. This coin still has a major rally ahead! Go long! ⬇️
post-image
LYN-0.44%
𝗘𝗧𝗛𝗘𝗥𝗘𝗨𝗠 ⚡ | 𝗣𝗥𝗜𝗖𝗘 𝗦𝗧𝗔𝗕𝗜𝗟𝗜𝗭𝗘𝗦 𝗡𝗘𝗔𝗥 $𝟮,𝟮𝟯𝟳

💰 Price: $2,236.92
₿ BTC Value: 0.02953 BTC

📊 Market Performance

- 1H Change: +0.24%
- 24H Change: +0.07%
- 7D Change: -0.70%

🏦 Market Cap: $273.34B
📈 24H Volume: $3.89B

Supply Details

- Circulating Supply: 122.19M ETH
- Total Supply: 122.19M ETH

Ethereum is showing slight positive movement over the past 24 hours, but its weekly performance remains marginally negative.

Trading activity remains important to watch. $ETH needs stronger buying momentum to establish a clearer recovery trend.

For now, the market i
post-image
ETH-0.91%
$ZEC I caught the falling knife at 1241, and my hands are still shaking.
Let’s start with the data—no need to comfort me yet. ZEC is currently at 1241.52, down 8.06% over 24h, with an intraday high of 1355.45 and low of 1235.21. Trading volume is 1.349 billion—it hasn’t contracted, which means panic selling is still underway. I reviewed ZEC’s price action across the past three halving cycles: after the first halving, a roughly -12% shakeout came on day 18; after the second, it was -9.8% on day 22; after the third, -8.5% on day 15. Today is exactly day 16 after this halving, with a decline of 8
ZEC+1.16%
Traders should remain cautious and watch BTC support and resistance levels.
live-cover
LIVE204
Buying the dip has already brought me to tears. Promise me, don’t cry so easily.
post-image
$LINK 🔎

LINK, the native token of Chainlink, is trading at approximately $10.80. On the charts, the price remains below all short- and medium-term moving averages. While LINK shed nearly 19% of its value in October—falling significantly below its late-September peak—the same period saw major ecosystem projects announce their transition to Chainlink’s cross-chain infrastructure. Meanwhile, Bitcoin is struggling to hold the $75,000 level, and the market’s attention is firmly fixed on Tuesday’s U.S. CPI (Consumer Price Index) data.

Where does the contradiction surrounding LINK begin?

In the c
LINK-0.18%
  • 2
  • 2
#DGAI

Worked for 8s
DGAI Gains 1.3%: Is Growing AI Infrastructure Demand Supporting Its Market Momentum?

What Is Driving DGAI Today?

Is DGAI starting another upward move, or is this simply a short-term pause in a wider market battle? The latest figures show a modest positive move, but the trading activity deserves closer attention.

As of November 8, 2026, at 01:30 UTC, DGAI/USDT was trading at $0.76992, up 1.3% over 24 hours. Trading volume reached approximately 3,471,405 USDT.

The price increase shows that buyers have maintained a slightly positive position during this period. However,
DGAI+0.67%
  • 1
US Adds 165,000 Jobs in October: Why Bitcoin Traders Watch the Fed
The US economy added 165,000 payroll jobs in October while unemployment held at 4.1%, the Bureau of Labor Statistics reported on November 6. The release complicates hopes for rapid monetary easing, but it cannot by itself determine what the Federal Reserve will do next or where Bitcoin will trade.
Bitcoin’s difficult trading week has coincided with a closely watched update on the US economy. The Bureau of Labor Statistics said nonfarm payroll employment increased by 165,000 in October, and the unemployment rate was little chang
post-image
BTC-0.67%
  • 2
$BTC LONG SETUP — BIG REBOUND AHEAD?

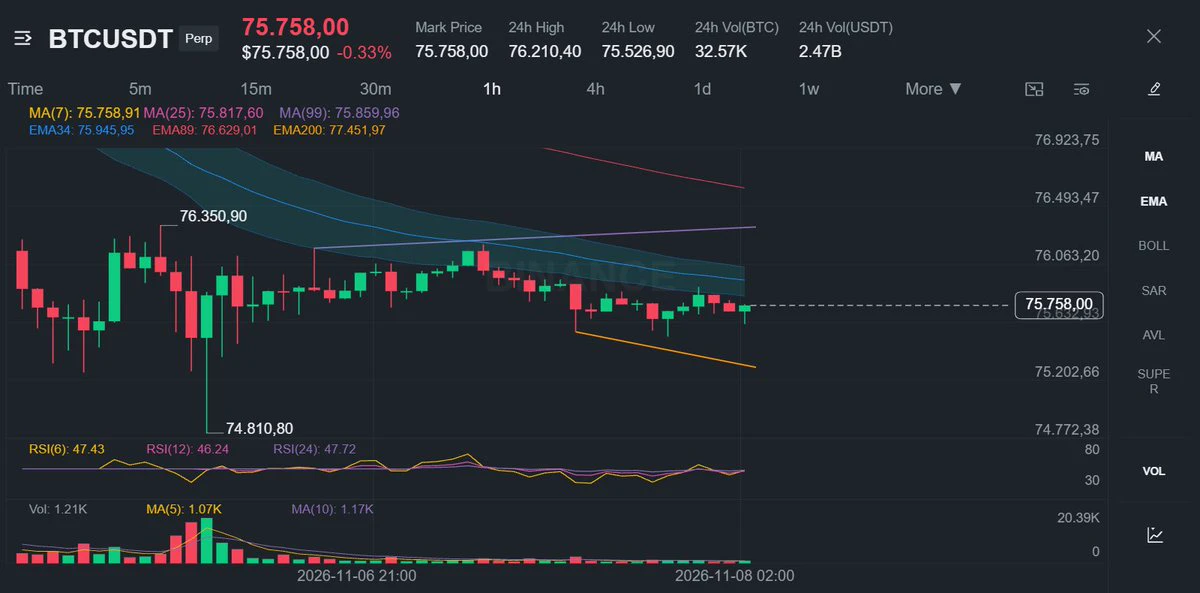
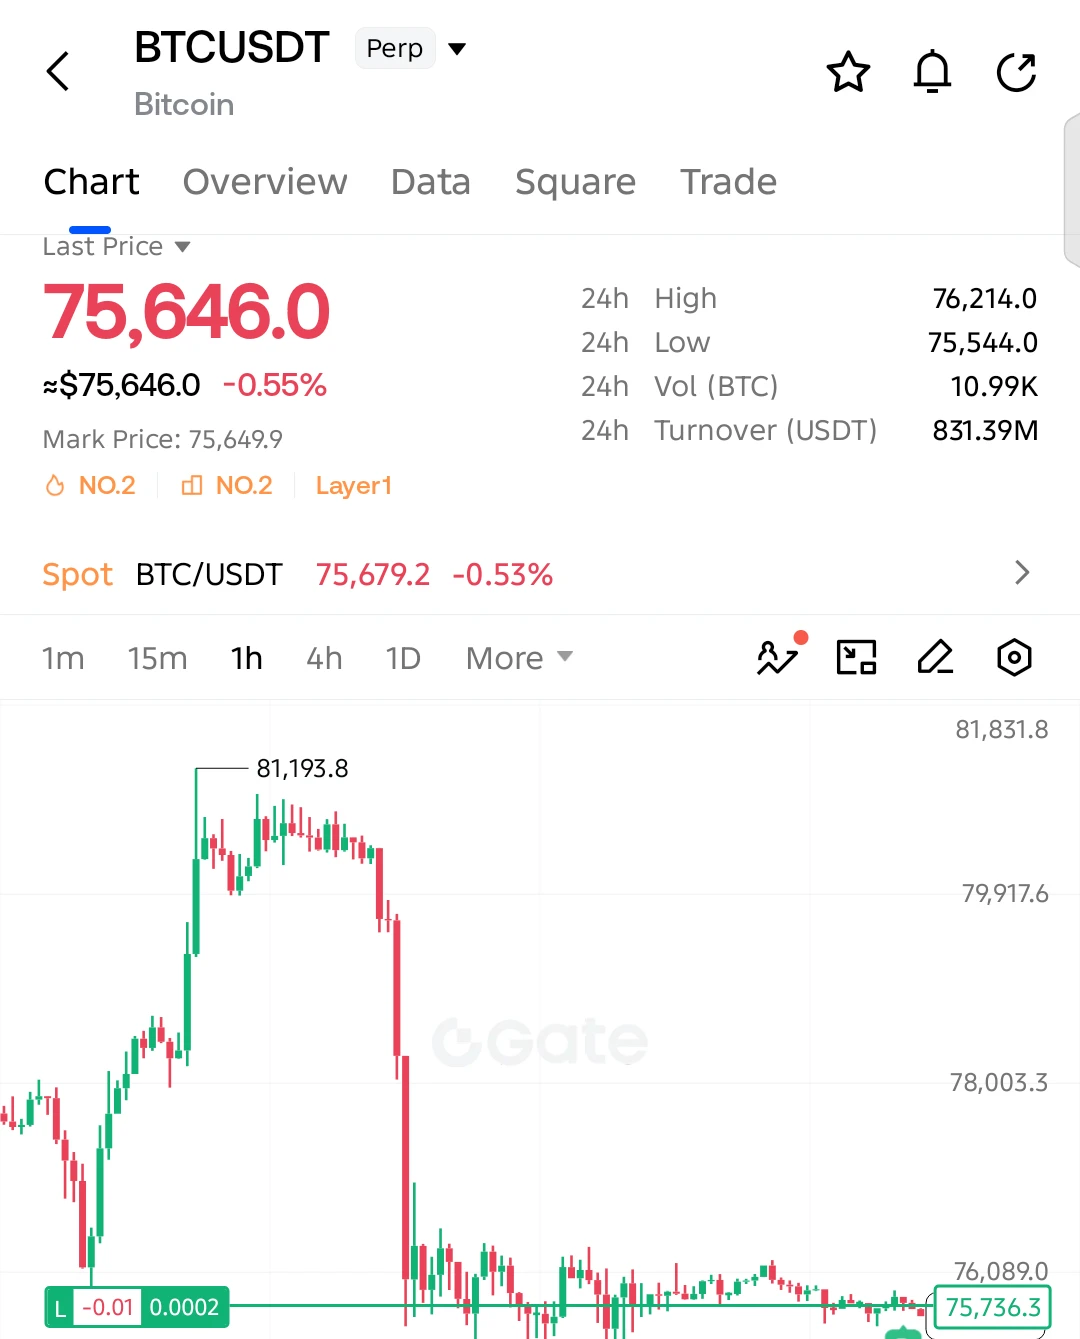
$BTC is holding near the 75,500 support zone after a massive sell-off. Buyers are defending this area, and a recovery could be developing!

Entry: 75,646
SL: 75,320

TP1: 76,090
TP2: 76,214
TP3: 76,800
Final Target: 78,000

Bitcoin is consolidating after its sharp decline from 81,193. The 75,500 area remains crucial for buyers. If this support holds and BTC reclaims 76,214, a stronger recovery toward 76,800–78,000 could follow.

Invalidation: A sustained break below 75,320 invalidates the bullish setup.

Keep your eyes on $BTC!
post-image
BTC-0.67%
#ARIA

Writing

ARIA Climbs 7.8%: A Strong Market Move, but the Real Story Is What Happens Next

The Move That Caught Attention

ARIA has recorded a positive 24-hour move, reaching 0.16023 USDT with a price increase of 7.8%. The move comes alongside approximately 3.45 million USDT in 24-hour trading volume. These figures show meaningful market activity, but there is an important question behind the rise: is this the beginning of stronger demand, or simply a short-term wave of buying?

Market data recorded on November 8, 2026, at 01:30 UTC, provides a useful starting point for understanding wh
post-image
ARIA+22.03%
#USCPIDataIncoming

Will the Next U.S. CPI Report Trigger a Major Move in Bitcoin, Stocks and Gold?

The Key Question

Will U.S. inflation cool enough to improve market sentiment, or will another hot reading create fresh pressure across financial markets?

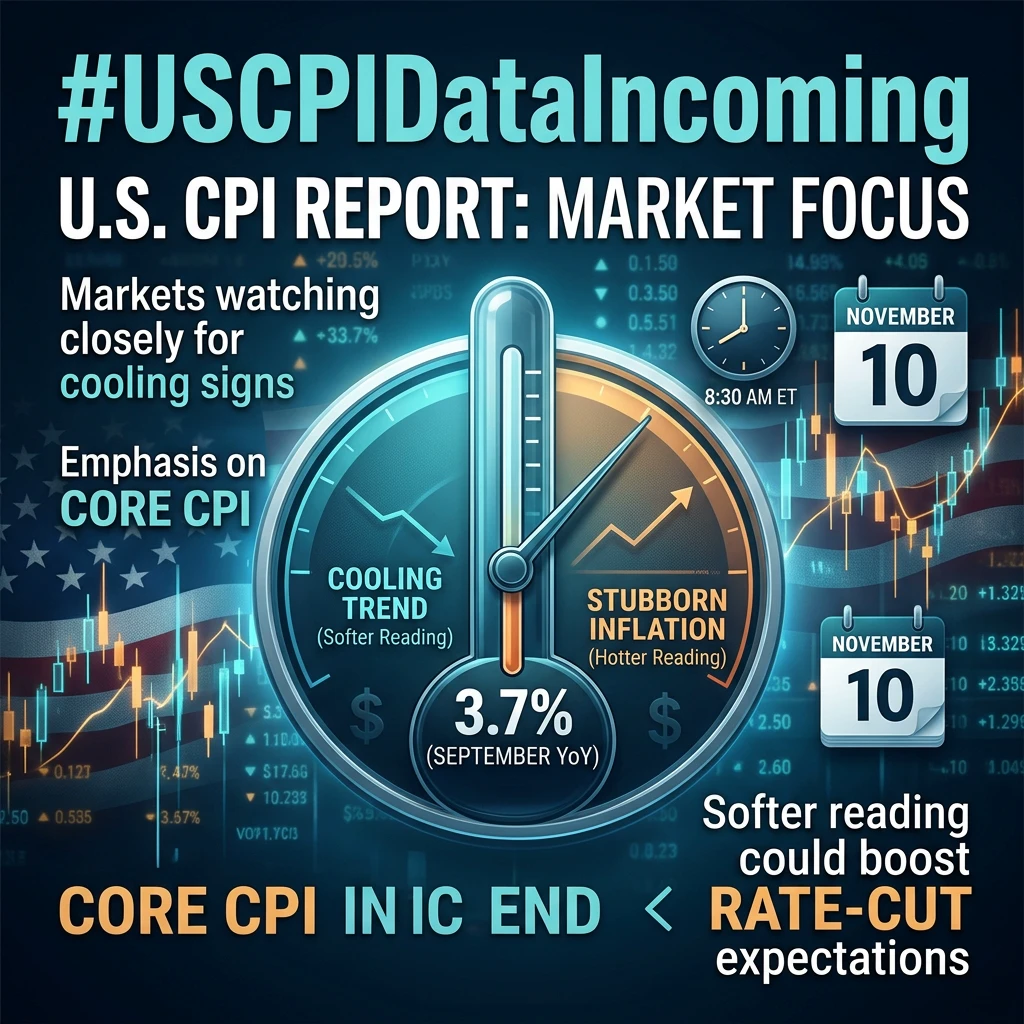
Investors are preparing for an important economic release on November 10. The October U.S. Consumer Price Index (CPI) report is scheduled for 8:30 a.m. Eastern Time. Its results could influence expectations about future Federal Reserve interest-rate decisions and create volatility across Bitcoin, U.S. stocks and gold.

The important point i
post-image
BTC-0.67%
Six dead and 15 injured at Krakow’s Old Town Main Square; three bodies still lay in the killer’s home—the case is even more chilling than the shooting itself!
Poland’s Prime Minister’s Office counted the suspect among the injured, reporting 6 dead and 16 injured, which doesn’t match the Associated Press’s figure of 15 injured. Do we have to reconcile the casualty figures before we can get at the truth?
The first report came in at 15:00:15 on November 7. No one can say how long the gunfire lasted or when the first shot was fired; with so many people at Old Town Main Square, the response time is
post-image
#Ahr999EntersBottomBuyingZone

AHR999 Drops Below 0.45: Bitcoin Enters a Historically Important Bottom-Buying Zone

The Market Has Reached an Important Point

Imagine watching Bitcoin trade around $80,000, then seeing its price move lower while a long-term valuation indicator enters a historically important zone. You might wonder whether the market is approaching a major turning point or simply experiencing another correction.

That is the situation surrounding the AHR999 indicator on November 8, 2026. Its latest reported reading is approximately 0.429, placing Bitcoin inside the historically
post-image
BTC-0.67%
HOT TOPIC PREDICTION
live-cover
LIVE324
When BTC shows bearish divergence, does it mean a decline is imminent?
In BTC technical analysis, bearish divergence is often seen as a warning that an uptrend may be weakening. But many traders rush to short as soon as they spot bearish divergence, only for the price to keep rising instead of falling, ultimately getting caught on the wrong side of the market.
So how should bearish divergence be interpreted?
First, understand the basic principle of bearish divergence. When the BTC price keeps making new highs, but the peaks of the RSI or MACD gradually decline, bearish divergence may be formin
post-image
BTC-0.67%
Will this week's CPI data bring a reversal?❓
Key Web3 events this week (11.9–11.15)⭐️
November 9
Publication date moved to November 9, allowing Polymarket Protocol V2 to avoid U.S. midterm election week;
Hyperliquid L2 network Elysium will launch on November 9;
Uniswap confirms V4 Hooks support on Elysium, with mainnet expected to launch on November 9
Mercado Bitcoin: Platform services will gradually resume on November 9, with compensation paid from its own funds
November 10
U.S. October CPI will be released on November 10 at 21:30;
Bitcoin payment coverage expands to over 4 million merchants,
BTC-0.67%
  • 1
Ten years of childhood sweethearts showing off their love.
A classmate dropped a major bombshell.
post-image
Load More

Join 40 M users in our growing community

⚡️ Join 40 M users in the crypto craze discussion

💬 Engage with your favorite top creators

👍 See what interests you

Trending Topics

USCPIDataIncoming

1.04k Views1.47k Discussing

The U.S. October CPI report will be released on November 10 at 8:30 a.m. ET. September CPI came in at 3.7% year over year, and markets will be watching closely for signs that inflation is cooling, especially in core CPI. A softer-than-expected reading could strengthen rate-cut expectations, while hotter inflation may pressure risk assets through higher Treasury yields and a stronger dollar. How do you think this CPI print will move $BTC, U.S. stocks and gold?

USAIStocksHitHard

23.56k Views3.69k Discussing

USNonfarmPayrolls

40.34k Views4.38k Discussing

View More