
Square
Following
Hot
News
Profile
Share your thoughts
placeholder
Article
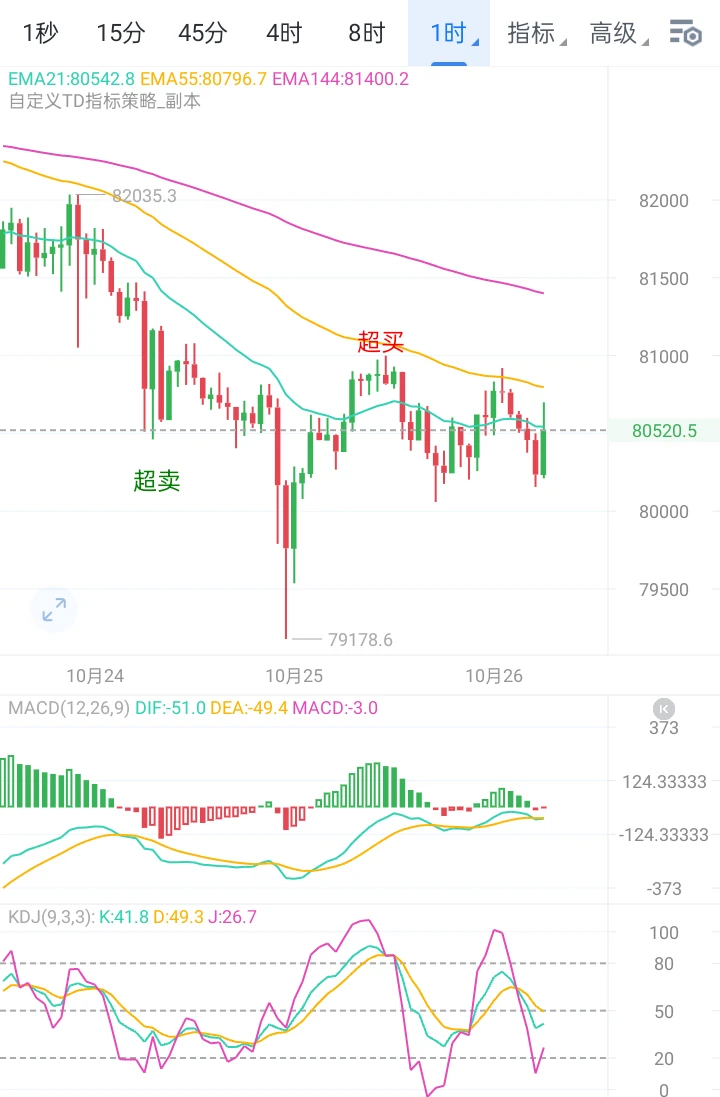
At 2 a.m. last night, BTC bottomed at 80344 before beginning a rebound. After climbing to around 81700, it fell into sustained choppy consolidation, beginning to digest short-term positions.
The market is currently seeing repeated tug-of-war between bulls and bears, with plenty of uncertainty still present. Do not make subjective bets on a one-sided move.
Keep a close eye on defense of the 80344 low below and resistance at 82000‑82400 above. The current price is ranging between these levels, so prioritize waiting for directional confirmation before entering. Avoid rushing to open positions in
post-image
BTC-1.93%
ETH-4.18%
MUBARAK is currently above the 1-hour MA99, with the price trading around 0.07428; a constructive rebound has emerged from the low of 0.07026. The 15-minute RSI(12) is 53.00, and the price is consolidating near the MA25, making a retest of the 0.07830 resistance level the most likely short-term path. You can go long now $MUBARA ! 🔥
Entry: 0.0749 - 0.0753Take-profit target 1: 0.07872Take-profit target 2: 0.08162Risk level: 0.07265Trade here 👇👇👇 Also: $BT : Current price 81,792.7 - 24-hour change: -1.88%
$JCT : Current price 0.002514 - 24-hour change: +58.11%.
post-image
JCT+40.71%
🌈 Gate Live Streaming Inspiration - October 9
Trending topic recommendations:
🔹 Friday “Black Opening”: BTC’s rebound is running out of steam, AI earnings concerns have resurfaced—how much longer will U.S. stocks and Crypto keep falling?
🔹 Is the AI storage myth about to burst? SK Hynix ADR fell over 4%—are the once-hottest chip stocks now starting to retreat across the board?
🔹 Altcoins plunge across the board! Even previously strong coins can’t hold up—is capital rotation over, or is a new round of shakeout underway?
🔹 KOL view: Arthur Hayes firmly believes the super bull market has onl
post-image
BTC-1.93%
SOL-6.48%
MEME-5.67%
  • 1
  • 1
🔥 $JCT
Going big on a long position again, brothers. Yang is here 💰 Entry 0.00259-0.00262, stop loss 0.00199, take profit 0.00300-0.00350-0.00400. Go long $JCT 👇
post-image
JCT+40.71%
$Lobster breakout is imminent! Technical indicators have all formed golden crosses—are you on board? Where is the next target? #Gate.io 🔥🚀 #Gate广场中秋团圆局
龙虾+15.44%
This article is no coincidence. With the V28 upgrade, the core team’s official announcement is also imminent. Nodes must complete the upgrade before October 13, and the mainnet is expected to switch over on October 16. This upgrade improves delays in transaction data processing and supports grouped smart contract upgrades and secure changes to stored data, laying a solid foundation for application iteration.
What the pioneers are looking forward to more is the release schedule beyond the announcement: the timeline, developer interfaces, and ecosystem integration guidelines. Only after the infr
post-image
  • 1
It dumped 3,000 points in a single day yesterday, and those who chased longs are still stunned—now that the price has climbed back to 81,900, are you thinking the opportunity has come again?
The director said this level was supporting the price yesterday, but today it should be viewed as resistance instead—the 81,900 area that Gong Youcai marked last night was indeed retested by the price this morning.
Among the people I follow, his take is one of the more grounded. I checked the numbers— the 80,000 level has been tested more than 20 times over the past month, with the harshest wick reaching 8
post-image
$OGN ’s strength remains, and so does the rising crowding risk
$OGN 24-hour +85.19%, current price 0.04228. The 1-hour and 4-hour RSI are 62 and 77, respectively. The strength is real, and so is the crowding. The question is not whether it can continue moving higher, but who will be willing to catch it on the first pullback.
The bears also have clear invalidation lines. A break below the 1-hour support at 0.02243 would mean short-term buying support has failed the test; if the 4-hour support at 0.02034 is also broken, the previous assessment of strength or recovery must be rewritten. Views can
post-image
OGN+83.07%
Golden opportunity! 3 tokens worth buying. ONDO: Tokenized real-world assets (RWA), including exposure to tokenized U.S. Treasuries. TAO (Bittensor): A decentralized AI network that rewards contributions to machine intelligence. QNT (Quant): Blockchain interoperability connecting different networks and enterprise systems. $OND $TAO $QNT
.
post-image
ONDO-0.23%
RWA-4.57%
TAO-8.17%
QNT-4.33%
$RLC ’s direction looks consistent, but the volume contraction has yet to confirm it
$RLC 24-hour +24.42%, current price 0.8571. The 1-hour and 4-hour structures are both relatively strong, but current volume is only 0.07 times the average volume of the previous 20 candles. The direction is consistent, but participation has not kept up—that is the point most worth debating right now.
Let’s pull the camera back to the 24-hour range: low 0.6515, high 1.0845. Where does the current price of 0.8571 sit within this range? That directly affects the meaning of the same signal. Near the high, strength
post-image
RLC+27.80%
Friday Morning Market Updates
live-cover
LIVE1,879
Why am I in this $NQ trade?
- Holding DBS
Wrong if?
- If price breaks under DBS or unable to push above AORL
Trim?
- 5/10 - 100 ticks + stops moved to breakeven
- 3/10 - 250 ticks
- 2/10 - DBS 31,132
post-image
$WLD Conclusion first: The trend has not recovered; the rebound is a recovery rather than a reversal. The current bias is bearish: only buy dips within the range, and do not chase longs.
Use moving averages to determine whether the trend is healthy, focusing only on two things: the price’s position relative to the moving averages, and the arrangement of the short- and long-term moving averages. Currently, MA5=0.48182 is below MA20=0.49909, confirming a bearish alignment and indicating that the medium-term trend is still dominated by sellers. Any rebound will first face selling pressure near M
post-image
WLD-7.09%
LDO-11.47%
UNI-9.18%
The Federal Reserve's September meeting minutes were released on October 7, and the market's interpretation of them has been far from straightforward. All nineteen officials supported the quarter-point hike that lifted the benchmark rate to 3.75%–4.00%, and most participants believed another increase by year-end could be appropriate. Yet within days, the implied probability of a hike at the October 27–28 meeting fell below 20%, down from roughly 70% in the period immediately after the September decision. That gap between the minutes' language and the market's pricing is the central fact shapin
post-image
User_any
When the Federal Reserve released the minutes from its September meeting, the immediate reading was that the central bank was still leaning toward tightening. All nineteen officials supported the quarter-point hike that lifted the benchmark rate to 3.75%–4.00%, and most participants believed another increase by year-end could be appropriate. Yet the market’s response over the following days told a different story. The odds of a hike at the October 27–28 meeting have fallen to roughly 17%–20%, down from nearly 70% in the days right after the September decision. That gap between what the minutes said and what traders are pricing is the central tension in the market right now.
Part of the explanation lies in the language the minutes used. While most officials saw another hike as potentially appropriate, the document also stressed that decisions would remain data-dependent and gave no indication that October was the intended venue. The phrasing “by year-end” rather than “at the next meeting” left room for interpretation, and the market chose to read it as a signal that the Fed is in no rush. Officials have reinforced that view in public remarks since the meeting. Fed Governor Christopher Waller said this week that further rate hikes are needed, but he also noted that the labor market is cooling and that the central bank can afford to be patient. That combination—a willingness to tighten, but without urgency—has kept October hike odds low.
The data that has come in since the September meeting has supported the patient approach. The August PCE price index, the Fed’s preferred inflation gauge, rose 3.4% year over year, below the 3.7% consensus estimate, while core PCE came in at 3.0%. The September jobs report, released on October 2, showed the economy added just 29,000 jobs, far below expectations, with the unemployment rate ticking up to 4.2%. Softer inflation and a cooling labor market give the Fed room to hold rates steady at the October meeting without risking a surge in price pressures. The market has interpreted that combination as reducing the case for an immediate hike.
That brings us to the October 14 CPI report, which is now the single most important data point on the calendar before the Fed meets. Forecasts point to headline inflation rising to around 3.6%–3.7% year over year, up from 3.4% in August. Core CPI, which strips out food and energy, will draw the most attention because it is a better gauge of underlying price pressures. If core CPI comes in at 0.3% month over month or higher, the case for an October hike will resurface, and the odds could climb back toward 40%–50%. A softer reading, closer to 0.2%, would confirm that inflation is continuing to cool and would likely keep October hike odds where they are—or push them lower still.
So how would a hotter-than-expected CPI print affect the Fed’s decision? The minutes already noted that inflation risks are skewed to the upside, with some participants concerned that energy prices and the AI buildout could keep price pressures elevated. A hot CPI reading would validate those concerns and give the hawks on the committee a stronger argument for acting in October rather than waiting until December. But it is worth remembering that the Fed has repeatedly emphasized its data-dependent approach. One inflation report alone is unlikely to force a hike if the broader trend still points toward gradual cooling. The bar for an October move is high, and it would likely take a combination of hot inflation and resilient jobs data to clear it.
For crypto and U.S. stocks, the transmission channel runs through rate expectations and the dollar. When hike odds fall, the opportunity cost of holding risk assets declines, which tends to support prices. Crypto investment products recorded $3.55 billion in inflows in the week after the September hike, the largest weekly figure of 2026, showing how sensitive digital asset flows are to the rate outlook. But the relationship is not one-directional. The 10-year Treasury yield is holding near 5.28%, and the 30-year is near 5.63%, both at multi-decade highs. Those elevated yields continue to weigh on valuations, particularly for high-growth sectors that depend on discounted future earnings. A softer CPI print would ease that pressure by reducing the probability of further tightening. A hotter print would do the opposite.
Is the current outlook already priced in? Largely, yes—but not entirely. The market has priced a pause for October and a hike for December, with December odds around 70%. Those expectations are reflected in current asset prices. What is not fully priced is the possibility of a meaningful surprise in the CPI data. If the report comes in significantly above or below expectations, the repricing could be sharp, because so much of the market’s positioning is built around the assumption that the Fed will hold in October. A hot print would force traders to reconsider that assumption, and the adjustment could ripple across bonds, currencies, equities, and crypto simultaneously.
My own view is that the Fed is unlikely to hike in October unless the CPI report delivers a genuine upside surprise. The labor market is cooling, inflation is trending in the right direction, and the committee has signaled that it sees no urgency to act. The December meeting remains the more likely venue for the next move, if there is one at all. But the October 14 CPI release is the variable that could change that calculus. Until it lands, the market is operating on incomplete information, and the gap between the hawkish minutes and the dovish pricing will remain unresolved.
This article is not investment advice. Analysis is based on publicly available information and does not guarantee future outcomes.
$BTC $ETH $GT
#ShareWeekly #FedSeptemberMinutesLeanHawkis
BTC-1.94%
ETH-4.19%
GT-2.05%
NVDA-2.86%
SNDK-4.91%
  • 1
  • 1
Layout: Bitcoin, Ethereum, Dogecoin
live-cover
LIVE880
  • 6
I forgot to post yesterday’s strategy. Everyone, remember that joining the livestream is the most direct way to listen, and you’re also welcome to join the groups for more discussion! The chart-based predictions 📈 I’ve shared in the livestream during this period have been fairly accurate.
Gate Web3 – your bridge to the blockchain era:
🧧 Gate Live’s red packet rain is here every day—have you grabbed yours today?
🎙 Chat about trending markets in real time, watch the markets with professional hosts online, and connect with them anytime to interact as you discuss hot topics and spot opportunities together~
Look for livestreams with the red packet icon on the cover—enter to participate in the red packet giveaway!
⚡ Get your fingers ready: https://www.gate.com/live.
post-image
  • 7
  • 1
I did nothing—just went to the restroom, and when I came back, the candlestick chart had already done the work for me.

I was watching $HOOKED while it was bottoming out intraday. It held after the pullback, and buying pressure was clearly strengthening. My bullish call was simply to wait patiently for confirmation. While others were still doubting, I had already written out the plan: hold if it doesn’t break down; accept it if it does. At levels like this, impatient people get nothing—only the steady-handed get their share. I don’t guess the top or the bottom; I only trade the move after con
post-image
BNB-5.21%
SNDK-5.07%
.Don't just watch the broader market fall—this coin is quietly doing something. Over the past two days, $NEAR has pulled back nearly 16%. Everyone is shouting that the bear market is here, but after looking through its on-chain activity, I actually think there's something there. Intents has accumulated $29 million in user-paid fees since changing its fee rules in February. This money isn't just sitting idle—$5.3 million of it went directly back into the secondary market to buy NEAR. It generated $1.84 million in September alone, two and a half times August's $720,000. Hot coin: $WIF $PEPE For r
post-image
WIF-9.69%
PEPE-6.11%
Load More

Join 40 M users in our growing community

⚡️ Join 40 M users in the crypto craze discussion

💬 Engage with your favorite top creators

👍 See what interests you

Trending Topics

Gate Money Officially Launches

3.46k Views12.89k Discussing

Gate officially launches Gate Money, a global integrated financial services app that brings digital assets, fiat, stocks, ETFs, gold, bank accounts, and payments into one Gate App. Users can manage assets, invest, send and receive funds, convert currencies, and make payments — all from a single account. Which use case are you most excited about? [👉 Learn more](https://www.gate.com/announcements/article/102094)

Fed September Minutes Lean Hawkish

64.18k Views2.73k Discussing

Samsung Q3 Operating Profit Surges 782.5%

36.98k Views1.93k Discussing

View More